Bucket Market Size and Share Forecast Outlook (2024 to 2034)

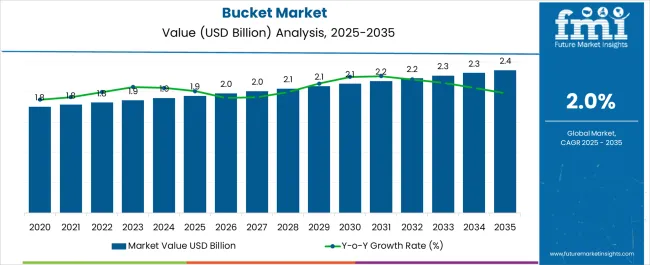
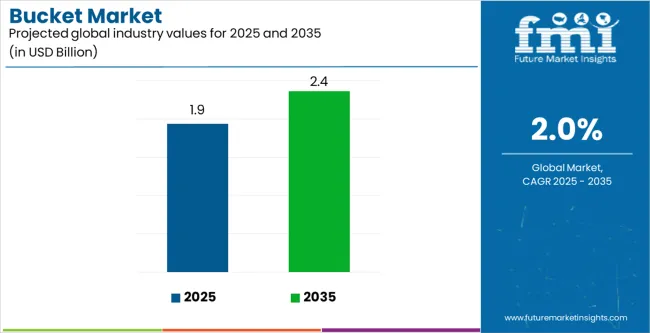
After a detailed analysis of the packaging industry, FMI recently published a new report on the bucket market. As per the analysis, sales of buckets hold a current valuation of USD 1.9 billion in 2024.

Reflecting on consumers’ expectations, bucket producers work on simpler labels with understandable ingredients, reinforcing continuous demand. Going by this pattern, demand could rise and equate to a market valuation of USD 2.7 billion, with a CAGR of 2% by 2034.

Attributes Details
Bucket Market Value for 2024 USD 1.9 billion
Bucket Market Value for 2034 USD 2.7 billion
Bucket Market CAGR from 2024 to 2034 2%

Historical Performance vs Future Growth Outlook for the Bucket Market

In 2019, the global bucket market showed a potential worth USD 1.7 billion, according to Future Market Insights. From 2019 to 2023, bucket sales inclined at a 3.5% CAGR, experiencing linear expansion.

Historical CAGR 3.5%
Forecast CAGR 2%

Several market phenomena, including a rise in industrial activity, the development of infrastructure, and demand from industries like agriculture and construction probably caused the market evolution.

With a predicted CAGR of 2%, projections for the future trajectory point of the bucket market led to a reduction in growth. Economic volatility, shifting consumer tastes, and regulation changes that affect market dynamics could all impact this adjustment.

The bucket market is broadened further, albeit more slowly, due to perpetual demand from various end-user sectors worldwide, even with the predicted slowdown in growth.

Key Factors Accelerating Growth in the Global Bucket Market

  • The continuous focus on infrastructural development in different areas acts as a considerable factor propelling the bucket industry.
  • The magnification of the construction sector, especially in developing nations, is a major factor speeding the bucket market.
  • The need for buckets is consistently generated by the agriculture industry, largely for irrigation, land preparation, and harvesting. Buggy systems are highly necessary as farming methods change to fulfill the advancing needs for food.
  • Ongoing technical breakthroughs improve the efficiency, durability, and versatility of buckets in their design, and buckets may face issues due to production methods.

Challenges Restraining Expansion of the Bucket Market

  • Economic turbulence and uncertainty, like recessions or currency devaluations, cause concussions while investing in building and infrastructure projects.
  • Certain buckets face issues due to the burgeoning environmental restrictions and sustainability programs, peculiarly those that do not meet emissions standards or are not environmentally friendly.
  • Natural disasters, geopolitical unrest, or worldwide pandemics can all cause supply chain disruptions that might negatively impact the availability of components and raw materials required to produce buckets.

Bucket Industry Analysis by Top Investment Segments

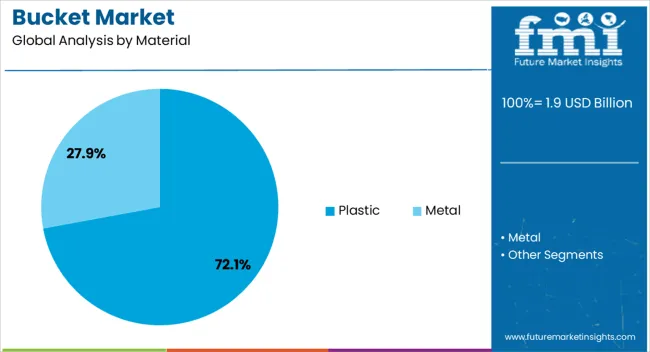
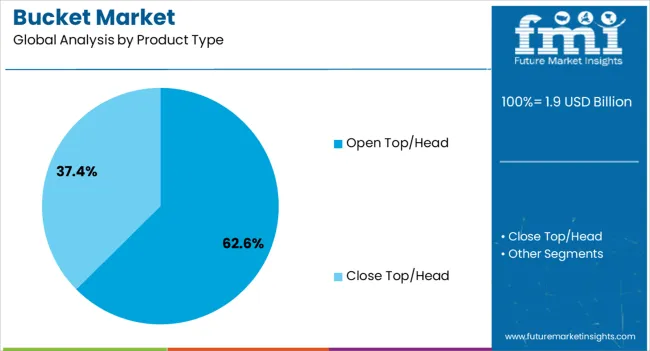
The below section shows the leading segment. Based on the material, the plastic segment is accounted to hold a market share of 72.1% in 2024. Based on product type, the open top/head segment is accounted to hold a market share of 62.6% in 2024.

Plastic buckets are preferred over metal or wooden ones as they are lighter in weight and easier to handle and transport.

Better accessibility is provided with open top/head buckets, making loading and unloading items simple without the need for extra opening mechanisms.

Category Market Share in 2024
Plastic 72.1%
Open Top/Head 62.6%

Plastic Segment to Hold a Significant Share in the Market

Based on material, the plastic sector is accounted to hold a market share of 72.1% in 2024. The popularity of plastic buckets can be ascribed to several things, including their durability, corrosion resistance, and capacity to withstand chemicals.

Plastic buckets are successively less expensive than equivalents made of wood or metal. Plastic buckets are mostly preferred by various industries, including agriculture and construction as they are adaptable and suitable for a wide range of uses.

Open Top/Head Segment to Hold a Dominant Share in the Market

Based on product type, the open top/head sector is accounted to hold a market share of 62.6% in 2024. Open top/head buckets are used because they are convenient and readily accessible, making both quick and easy in loading and emptying materials.

Open top/head buckets are widely used in the construction, waste management, and agricultural industries and for jobs that require quick material handling.

Analysis of Top Countries Manufacturing and Distributing Buckets

The table mentions the top five countries ranked by revenue, with India holding the top position.

India is the market leader in buckets because of its wide usage in various industries, including rural development, agriculture, and construction. The demand for buckets remains constant due to infrastructural developments, rising urbanization, and the focus on agricultural output.

The developing economy and the vast population of 1.42 billion in India further propel the market by positioning it as a major participant in the global bucket industry.

Forecast CAGRs from 2024 to 2034

Countries CAGR through 2034
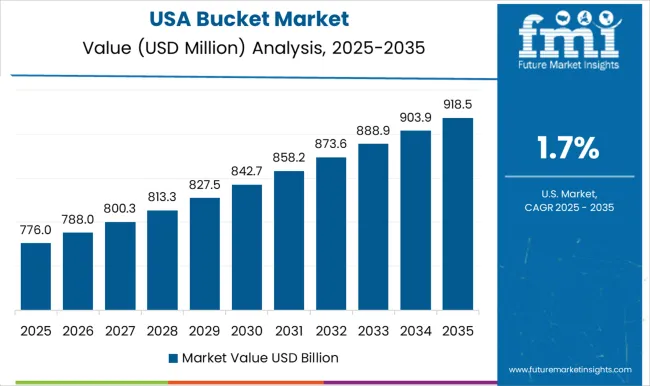
United States 1.9%
Germany 1.6%
China 4.6%
Thailand 4.3%
India 6%

Infrastructure Development Impresses the United States Market

The bucket market is predominantly utilized in infrastructure development projects in the United States. The market substantially includes the construction of roads, bridges, commercial buildings, and residential complexes.

Buckets are commonly employed for excavation, material handling, and transportation on construction sites across the country.

Manufacturing and Industrial Applications Accelerate the Demand for Buckets in Germany

The bucket market finds significant usage in manufacturing and industrial applications. Industries like automotive, engineering, and manufacturing largely rely on buckets for material handling, storage, and transportation within their production processes.

Buckets are essential for handling raw materials, components, and finished products in these sectors.

Construction and Urbanization Boost the Bucket Market in China

The booming construction sector upsurges the demand for buckets in the country. With rapid urbanization and infrastructure development projects underway, buckets are extensively used in construction activities such as excavation, concrete mixing, and debris removal.

The construction of residential complexes, commercial buildings, and transportation infrastructure fuels the widespread usage of buckets across China.

Thailand Holds a Prominent Position in Agriculture and Farming

In Thailand, the bucket market is predominantly utilized in agriculture and farming activities. Buckets are essential tools for irrigation, harvesting, and livestock feeding on farms across the country.

Buckets are utilized in aquaculture, horticulture, and other agricultural practices to facilitate various farming operations efficiently.

India has a Pivotal Position for Rural Development and Construction

Rural development initiatives and construction projects majorly require buckets for their usage. With ongoing efforts for improvement in rural infrastructure, buckets play a compelling role in activities such as road construction, water supply projects, and sanitation programs.

Buckets are widely utilized in urban construction projects, real estate development, and infrastructure upgrades in rapidly growing cities across the country.
Competitive Landscape of the Bucket Market

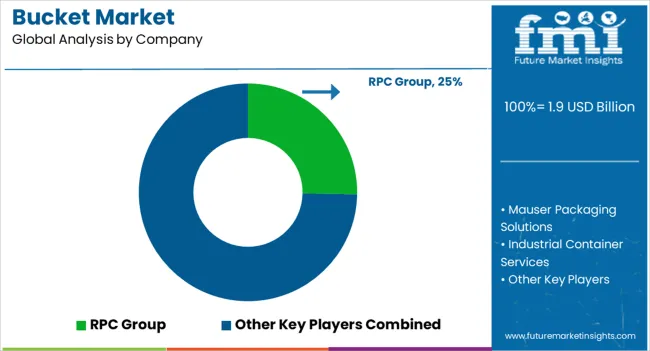
The bucket market is very competitive, with many companies, from large multinationals to small-town producers. Lucrative opportunities are available for market players who invest in bucket market technology for improving features that frequently compete on product quality, cost, innovation, and distribution networks.

Smaller regional businesses concentrate on specialized products or niche markets for establishing their presence, whereas multinational corporations utilize their worldwide reach and ample resources for sustaining a substantial market share.

Diversified companies frequently use partnerships, mergers, and acquisitions for bolstering their market position and product offerings, hence cherishing a dynamic and competitive landscape in the bucket market.

Some of the key developments are

  • In 2023, Mauser Group concentrated on burgeoning its product line and strengthening its position in the plastic bucket industry. The company offered innovative plastic bucket solutions, emphasizing sustainability, durability, and customization choices to meet the changing demands of different industries.
  • In 2023, RPC Group strengthened its position in the plastic bucket market, a well-known producer of plastic packaging solutions, probably pursued significant advancements. The key player introduced new product lines, investing in cutting-edge manufacturing techniques, and raising production levels to meet demand.

Scope and Coverage of the Bucket Market Report

  • Adjacent Study on Bucket Market, Bucket Elevator Market
  • Indian Loader Bucket Market
  • Bucket Trucks Market Size, Current Insights, and Demographic Trends
  • Global Bucket Sales Market
  • Key Strategies in the Global Excavator Bucket Market

Overview of Analytical Coverage and Study Boundaries for the Bucket Industry

Attributes Details
Estimated Market Size in 2024 USD 1.9 billion
Projected Market Valuation in 2034 USD 2.7 billion
Value-based CAGR 2024 to 2034 2%
Forecast Period 2024 to 2034
Historical Data Available for 2019 to 2023
Market Analysis Value in USD billion
Key Regions Covered North America; Latin America; Western Europe; Eastern Europe; South Asia and Pacific; East Asia; The Middle East and Africa
Key Market Segments Covered Material, Product Type, End Use, Region
Key Countries Profiled The United States, Canada, Brazil, Mexico, Germany, The United Kingdom, France, Spain, Italy, Russia, Poland, Czech Republic, Romania, India, Bangladesh, Australia, New Zealand, China, Japan, South Korea, GCC countries, South Africa, Israel
Key Companies Profiled RPC Group; Mauser Packaging Solutions; Industrial Container Services; C.L. Smith; Affordable Buckets; Encore Plastics Corporation; FDL Packaging Group

Top Segments Studied in the Bucket Market Report

By Material:

  • Plastic
  • Metal

By Product Type:

  • Open Top/Head
  • Close Top/Head

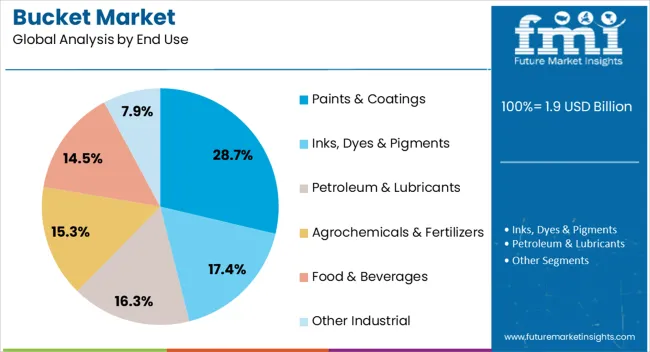
By End Use:

  • Paints & Coatings
  • Inks, Dyes & Pigments
  • Petroleum & Lubricants
  • Agrochemicals & Fertilizers
  • Food & Beverages
  • Other Industrial

By Region:

  • North America
  • Latin America
  • Western Europe
  • Eastern Europe
  • South Asia and Pacific
  • East Asia
  • The Middle East and Africa

Table of Content

  • 1. Executive Summary
  • 2. Market Overview
  • 3. Market Background
  • 4. Global Market Analysis 2019 to 2023 and Forecast, 2024 to 2034
  • 5. Global Market Analysis 2019 to 2023 and Forecast 2024 to 2034, By Material
    • 5.1. Plastic
    • 5.2. Metal
  • 6. Global Market Analysis 2019 to 2023 and Forecast 2024 to 2034, By Product Type
    • 6.1. Open Top/Head
    • 6.2. Close Top/Head
  • 7. Global Market Analysis 2019 to 2023 and Forecast 2024 to 2034, By End Use
    • 7.1. Paints & Coatings
    • 7.2. Inks, Dyes & Pigments
    • 7.3. Petroleum & Lubricants
    • 7.4. Agrochemicals & Fertilizers
    • 7.5. Food & Beverages
    • 7.6. Other Industrial
  • 8. Global Market Analysis 2019 to 2023 and Forecast 2024 to 2034, By Region
    • 8.1. North America
    • 8.2. Latin America
    • 8.3. Western Europe
    • 8.4. Eastern Europe
    • 8.5. South Asia and Pacific
    • 8.6. East Asia
    • 8.7. Middle East and Africa
  • 9. North America Market Analysis 2019 to 2023 and Forecast 2024 to 2034, By Country
  • 10. Latin America Market Analysis 2019 to 2023 and Forecast 2024 to 2034, By Country
  • 11. Western Europe Market Analysis 2019 to 2023 and Forecast 2024 to 2034, By Country
  • 12. Eastern Europe Market Analysis 2019 to 2023 and Forecast 2024 to 2034, By Country
  • 13. South Asia and Pacific Market Analysis 2019 to 2023 and Forecast 2024 to 2034, By Country
  • 14. East Asia Market Analysis 2019 to 2023 and Forecast 2024 to 2034, By Country
  • 15. Middle East and Africa Market Analysis 2019 to 2023 and Forecast 2024 to 2034, By Country
  • 16. Key Countries Market Analysis
  • 17. Market Structure Analysis
  • 18. Competition Analysis
    • 18.1. RPC Group
    • 18.2. Mauser Packaging Solutions
    • 18.3. Industrial Container Services
    • 18.4. C.L. Smith
    • 18.5. Affordable Buckets
    • 18.6. Encore Plastics Corporation
    • 18.7. FDL Packaging Group
  • 19. Assumptions & Acronyms Used
  • 20. Research Methodology

List of Tables

Table 1: Global Market Value (US$ Billion) Forecast by Region, 2019 to 2034

Table 2: Global Market Volume (Units) Forecast by Region, 2019 to 2034

Table 3: Global Market Value (US$ Billion) Forecast by Material, 2019 to 2034

Table 4: Global Market Volume (Units) Forecast by Material, 2019 to 2034

Table 5: Global Market Value (US$ Billion) Forecast by Product Type, 2019 to 2034

Table 6: Global Market Volume (Units) Forecast by Product Type, 2019 to 2034

Table 7: Global Market Value (US$ Billion) Forecast by End Use, 2019 to 2034

Table 8: Global Market Volume (Units) Forecast by End Use, 2019 to 2034

Table 9: North America Market Value (US$ Billion) Forecast by Country, 2019 to 2034

Table 10: North America Market Volume (Units) Forecast by Country, 2019 to 2034

Table 11: North America Market Value (US$ Billion) Forecast by Material, 2019 to 2034

Table 12: North America Market Volume (Units) Forecast by Material, 2019 to 2034

Table 13: North America Market Value (US$ Billion) Forecast by Product Type, 2019 to 2034

Table 14: North America Market Volume (Units) Forecast by Product Type, 2019 to 2034

Table 15: North America Market Value (US$ Billion) Forecast by End Use, 2019 to 2034

Table 16: North America Market Volume (Units) Forecast by End Use, 2019 to 2034

Table 17: Latin America Market Value (US$ Billion) Forecast by Country, 2019 to 2034

Table 18: Latin America Market Volume (Units) Forecast by Country, 2019 to 2034

Table 19: Latin America Market Value (US$ Billion) Forecast by Material, 2019 to 2034

Table 20: Latin America Market Volume (Units) Forecast by Material, 2019 to 2034

Table 21: Latin America Market Value (US$ Billion) Forecast by Product Type, 2019 to 2034

Table 22: Latin America Market Volume (Units) Forecast by Product Type, 2019 to 2034

Table 23: Latin America Market Value (US$ Billion) Forecast by End Use, 2019 to 2034

Table 24: Latin America Market Volume (Units) Forecast by End Use, 2019 to 2034

Table 25: Western Europe Market Value (US$ Billion) Forecast by Country, 2019 to 2034

Table 26: Western Europe Market Volume (Units) Forecast by Country, 2019 to 2034

Table 27: Western Europe Market Value (US$ Billion) Forecast by Material, 2019 to 2034

Table 28: Western Europe Market Volume (Units) Forecast by Material, 2019 to 2034

Table 29: Western Europe Market Value (US$ Billion) Forecast by Product Type, 2019 to 2034

Table 30: Western Europe Market Volume (Units) Forecast by Product Type, 2019 to 2034

Table 31: Western Europe Market Value (US$ Billion) Forecast by End Use, 2019 to 2034

Table 32: Western Europe Market Volume (Units) Forecast by End Use, 2019 to 2034

Table 33: Eastern Europe Market Value (US$ Billion) Forecast by Country, 2019 to 2034

Table 34: Eastern Europe Market Volume (Units) Forecast by Country, 2019 to 2034

Table 35: Eastern Europe Market Value (US$ Billion) Forecast by Material, 2019 to 2034

Table 36: Eastern Europe Market Volume (Units) Forecast by Material, 2019 to 2034

Table 37: Eastern Europe Market Value (US$ Billion) Forecast by Product Type, 2019 to 2034

Table 38: Eastern Europe Market Volume (Units) Forecast by Product Type, 2019 to 2034

Table 39: Eastern Europe Market Value (US$ Billion) Forecast by End Use, 2019 to 2034

Table 40: Eastern Europe Market Volume (Units) Forecast by End Use, 2019 to 2034

Table 41: South Asia and Pacific Market Value (US$ Billion) Forecast by Country, 2019 to 2034

Table 42: South Asia and Pacific Market Volume (Units) Forecast by Country, 2019 to 2034

Table 43: South Asia and Pacific Market Value (US$ Billion) Forecast by Material, 2019 to 2034

Table 44: South Asia and Pacific Market Volume (Units) Forecast by Material, 2019 to 2034

Table 45: South Asia and Pacific Market Value (US$ Billion) Forecast by Product Type, 2019 to 2034

Table 46: South Asia and Pacific Market Volume (Units) Forecast by Product Type, 2019 to 2034

Table 47: South Asia and Pacific Market Value (US$ Billion) Forecast by End Use, 2019 to 2034

Table 48: South Asia and Pacific Market Volume (Units) Forecast by End Use, 2019 to 2034

Table 49: East Asia Market Value (US$ Billion) Forecast by Country, 2019 to 2034

Table 50: East Asia Market Volume (Units) Forecast by Country, 2019 to 2034

Table 51: East Asia Market Value (US$ Billion) Forecast by Material, 2019 to 2034

Table 52: East Asia Market Volume (Units) Forecast by Material, 2019 to 2034

Table 53: East Asia Market Value (US$ Billion) Forecast by Product Type, 2019 to 2034

Table 54: East Asia Market Volume (Units) Forecast by Product Type, 2019 to 2034

Table 55: East Asia Market Value (US$ Billion) Forecast by End Use, 2019 to 2034

Table 56: East Asia Market Volume (Units) Forecast by End Use, 2019 to 2034

Table 57: Middle East and Africa Market Value (US$ Billion) Forecast by Country, 2019 to 2034

Table 58: Middle East and Africa Market Volume (Units) Forecast by Country, 2019 to 2034

Table 59: Middle East and Africa Market Value (US$ Billion) Forecast by Material, 2019 to 2034

Table 60: Middle East and Africa Market Volume (Units) Forecast by Material, 2019 to 2034

Table 61: Middle East and Africa Market Value (US$ Billion) Forecast by Product Type, 2019 to 2034

Table 62: Middle East and Africa Market Volume (Units) Forecast by Product Type, 2019 to 2034

Table 63: Middle East and Africa Market Value (US$ Billion) Forecast by End Use, 2019 to 2034

Table 64: Middle East and Africa Market Volume (Units) Forecast by End Use, 2019 to 2034

List of Figures

Figure 1: Global Market Value (US$ Billion) by Material, 2024 to 2034

Figure 2: Global Market Value (US$ Billion) by Product Type, 2024 to 2034

Figure 3: Global Market Value (US$ Billion) by End Use, 2024 to 2034

Figure 4: Global Market Value (US$ Billion) by Region, 2024 to 2034

Figure 5: Global Market Value (US$ Billion) Analysis by Region, 2019 to 2034

Figure 6: Global Market Volume (Units) Analysis by Region, 2019 to 2034

Figure 7: Global Market Value Share (%) and BPS Analysis by Region, 2024 to 2034

Figure 8: Global Market Y-o-Y Growth (%) Projections by Region, 2024 to 2034

Figure 9: Global Market Value (US$ Billion) Analysis by Material, 2019 to 2034

Figure 10: Global Market Volume (Units) Analysis by Material, 2019 to 2034

Figure 11: Global Market Value Share (%) and BPS Analysis by Material, 2024 to 2034

Figure 12: Global Market Y-o-Y Growth (%) Projections by Material, 2024 to 2034

Figure 13: Global Market Value (US$ Billion) Analysis by Product Type, 2019 to 2034

Figure 14: Global Market Volume (Units) Analysis by Product Type, 2019 to 2034

Figure 15: Global Market Value Share (%) and BPS Analysis by Product Type, 2024 to 2034

Figure 16: Global Market Y-o-Y Growth (%) Projections by Product Type, 2024 to 2034

Figure 17: Global Market Value (US$ Billion) Analysis by End Use, 2019 to 2034

Figure 18: Global Market Volume (Units) Analysis by End Use, 2019 to 2034

Figure 19: Global Market Value Share (%) and BPS Analysis by End Use, 2024 to 2034

Figure 20: Global Market Y-o-Y Growth (%) Projections by End Use, 2024 to 2034

Figure 21: Global Market Attractiveness by Material, 2024 to 2034

Figure 22: Global Market Attractiveness by Product Type, 2024 to 2034

Figure 23: Global Market Attractiveness by End Use, 2024 to 2034

Figure 24: Global Market Attractiveness by Region, 2024 to 2034

Figure 25: North America Market Value (US$ Billion) by Material, 2024 to 2034

Figure 26: North America Market Value (US$ Billion) by Product Type, 2024 to 2034

Figure 27: North America Market Value (US$ Billion) by End Use, 2024 to 2034

Figure 28: North America Market Value (US$ Billion) by Country, 2024 to 2034

Figure 29: North America Market Value (US$ Billion) Analysis by Country, 2019 to 2034

Figure 30: North America Market Volume (Units) Analysis by Country, 2019 to 2034

Figure 31: North America Market Value Share (%) and BPS Analysis by Country, 2024 to 2034

Figure 32: North America Market Y-o-Y Growth (%) Projections by Country, 2024 to 2034

Figure 33: North America Market Value (US$ Billion) Analysis by Material, 2019 to 2034

Figure 34: North America Market Volume (Units) Analysis by Material, 2019 to 2034

Figure 35: North America Market Value Share (%) and BPS Analysis by Material, 2024 to 2034

Figure 36: North America Market Y-o-Y Growth (%) Projections by Material, 2024 to 2034

Figure 37: North America Market Value (US$ Billion) Analysis by Product Type, 2019 to 2034

Figure 38: North America Market Volume (Units) Analysis by Product Type, 2019 to 2034

Figure 39: North America Market Value Share (%) and BPS Analysis by Product Type, 2024 to 2034

Figure 40: North America Market Y-o-Y Growth (%) Projections by Product Type, 2024 to 2034

Figure 41: North America Market Value (US$ Billion) Analysis by End Use, 2019 to 2034

Figure 42: North America Market Volume (Units) Analysis by End Use, 2019 to 2034

Figure 43: North America Market Value Share (%) and BPS Analysis by End Use, 2024 to 2034

Figure 44: North America Market Y-o-Y Growth (%) Projections by End Use, 2024 to 2034

Figure 45: North America Market Attractiveness by Material, 2024 to 2034

Figure 46: North America Market Attractiveness by Product Type, 2024 to 2034

Figure 47: North America Market Attractiveness by End Use, 2024 to 2034

Figure 48: North America Market Attractiveness by Country, 2024 to 2034

Figure 49: Latin America Market Value (US$ Billion) by Material, 2024 to 2034

Figure 50: Latin America Market Value (US$ Billion) by Product Type, 2024 to 2034

Figure 51: Latin America Market Value (US$ Billion) by End Use, 2024 to 2034

Figure 52: Latin America Market Value (US$ Billion) by Country, 2024 to 2034

Figure 53: Latin America Market Value (US$ Billion) Analysis by Country, 2019 to 2034

Figure 54: Latin America Market Volume (Units) Analysis by Country, 2019 to 2034

Figure 55: Latin America Market Value Share (%) and BPS Analysis by Country, 2024 to 2034

Figure 56: Latin America Market Y-o-Y Growth (%) Projections by Country, 2024 to 2034

Figure 57: Latin America Market Value (US$ Billion) Analysis by Material, 2019 to 2034

Figure 58: Latin America Market Volume (Units) Analysis by Material, 2019 to 2034

Figure 59: Latin America Market Value Share (%) and BPS Analysis by Material, 2024 to 2034

Figure 60: Latin America Market Y-o-Y Growth (%) Projections by Material, 2024 to 2034

Figure 61: Latin America Market Value (US$ Billion) Analysis by Product Type, 2019 to 2034

Figure 62: Latin America Market Volume (Units) Analysis by Product Type, 2019 to 2034

Figure 63: Latin America Market Value Share (%) and BPS Analysis by Product Type, 2024 to 2034

Figure 64: Latin America Market Y-o-Y Growth (%) Projections by Product Type, 2024 to 2034

Figure 65: Latin America Market Value (US$ Billion) Analysis by End Use, 2019 to 2034

Figure 66: Latin America Market Volume (Units) Analysis by End Use, 2019 to 2034

Figure 67: Latin America Market Value Share (%) and BPS Analysis by End Use, 2024 to 2034

Figure 68: Latin America Market Y-o-Y Growth (%) Projections by End Use, 2024 to 2034

Figure 69: Latin America Market Attractiveness by Material, 2024 to 2034

Figure 70: Latin America Market Attractiveness by Product Type, 2024 to 2034

Figure 71: Latin America Market Attractiveness by End Use, 2024 to 2034

Figure 72: Latin America Market Attractiveness by Country, 2024 to 2034

Figure 73: Western Europe Market Value (US$ Billion) by Material, 2024 to 2034

Figure 74: Western Europe Market Value (US$ Billion) by Product Type, 2024 to 2034

Figure 75: Western Europe Market Value (US$ Billion) by End Use, 2024 to 2034

Figure 76: Western Europe Market Value (US$ Billion) by Country, 2024 to 2034

Figure 77: Western Europe Market Value (US$ Billion) Analysis by Country, 2019 to 2034

Figure 78: Western Europe Market Volume (Units) Analysis by Country, 2019 to 2034

Figure 79: Western Europe Market Value Share (%) and BPS Analysis by Country, 2024 to 2034

Figure 80: Western Europe Market Y-o-Y Growth (%) Projections by Country, 2024 to 2034

Figure 81: Western Europe Market Value (US$ Billion) Analysis by Material, 2019 to 2034

Figure 82: Western Europe Market Volume (Units) Analysis by Material, 2019 to 2034

Figure 83: Western Europe Market Value Share (%) and BPS Analysis by Material, 2024 to 2034

Figure 84: Western Europe Market Y-o-Y Growth (%) Projections by Material, 2024 to 2034

Figure 85: Western Europe Market Value (US$ Billion) Analysis by Product Type, 2019 to 2034

Figure 86: Western Europe Market Volume (Units) Analysis by Product Type, 2019 to 2034

Figure 87: Western Europe Market Value Share (%) and BPS Analysis by Product Type, 2024 to 2034

Figure 88: Western Europe Market Y-o-Y Growth (%) Projections by Product Type, 2024 to 2034

Figure 89: Western Europe Market Value (US$ Billion) Analysis by End Use, 2019 to 2034

Figure 90: Western Europe Market Volume (Units) Analysis by End Use, 2019 to 2034

Figure 91: Western Europe Market Value Share (%) and BPS Analysis by End Use, 2024 to 2034

Figure 92: Western Europe Market Y-o-Y Growth (%) Projections by End Use, 2024 to 2034

Figure 93: Western Europe Market Attractiveness by Material, 2024 to 2034

Figure 94: Western Europe Market Attractiveness by Product Type, 2024 to 2034

Figure 95: Western Europe Market Attractiveness by End Use, 2024 to 2034

Figure 96: Western Europe Market Attractiveness by Country, 2024 to 2034

Figure 97: Eastern Europe Market Value (US$ Billion) by Material, 2024 to 2034

Figure 98: Eastern Europe Market Value (US$ Billion) by Product Type, 2024 to 2034

Figure 99: Eastern Europe Market Value (US$ Billion) by End Use, 2024 to 2034

Figure 100: Eastern Europe Market Value (US$ Billion) by Country, 2024 to 2034

Figure 101: Eastern Europe Market Value (US$ Billion) Analysis by Country, 2019 to 2034

Figure 102: Eastern Europe Market Volume (Units) Analysis by Country, 2019 to 2034

Figure 103: Eastern Europe Market Value Share (%) and BPS Analysis by Country, 2024 to 2034

Figure 104: Eastern Europe Market Y-o-Y Growth (%) Projections by Country, 2024 to 2034

Figure 105: Eastern Europe Market Value (US$ Billion) Analysis by Material, 2019 to 2034

Figure 106: Eastern Europe Market Volume (Units) Analysis by Material, 2019 to 2034

Figure 107: Eastern Europe Market Value Share (%) and BPS Analysis by Material, 2024 to 2034

Figure 108: Eastern Europe Market Y-o-Y Growth (%) Projections by Material, 2024 to 2034

Figure 109: Eastern Europe Market Value (US$ Billion) Analysis by Product Type, 2019 to 2034

Figure 110: Eastern Europe Market Volume (Units) Analysis by Product Type, 2019 to 2034

Figure 111: Eastern Europe Market Value Share (%) and BPS Analysis by Product Type, 2024 to 2034

Figure 112: Eastern Europe Market Y-o-Y Growth (%) Projections by Product Type, 2024 to 2034

Figure 113: Eastern Europe Market Value (US$ Billion) Analysis by End Use, 2019 to 2034

Figure 114: Eastern Europe Market Volume (Units) Analysis by End Use, 2019 to 2034

Figure 115: Eastern Europe Market Value Share (%) and BPS Analysis by End Use, 2024 to 2034

Figure 116: Eastern Europe Market Y-o-Y Growth (%) Projections by End Use, 2024 to 2034

Figure 117: Eastern Europe Market Attractiveness by Material, 2024 to 2034

Figure 118: Eastern Europe Market Attractiveness by Product Type, 2024 to 2034

Figure 119: Eastern Europe Market Attractiveness by End Use, 2024 to 2034

Figure 120: Eastern Europe Market Attractiveness by Country, 2024 to 2034

Figure 121: South Asia and Pacific Market Value (US$ Billion) by Material, 2024 to 2034

Figure 122: South Asia and Pacific Market Value (US$ Billion) by Product Type, 2024 to 2034

Figure 123: South Asia and Pacific Market Value (US$ Billion) by End Use, 2024 to 2034

Figure 124: South Asia and Pacific Market Value (US$ Billion) by Country, 2024 to 2034

Figure 125: South Asia and Pacific Market Value (US$ Billion) Analysis by Country, 2019 to 2034

Figure 126: South Asia and Pacific Market Volume (Units) Analysis by Country, 2019 to 2034

Figure 127: South Asia and Pacific Market Value Share (%) and BPS Analysis by Country, 2024 to 2034

Figure 128: South Asia and Pacific Market Y-o-Y Growth (%) Projections by Country, 2024 to 2034

Figure 129: South Asia and Pacific Market Value (US$ Billion) Analysis by Material, 2019 to 2034

Figure 130: South Asia and Pacific Market Volume (Units) Analysis by Material, 2019 to 2034

Figure 131: South Asia and Pacific Market Value Share (%) and BPS Analysis by Material, 2024 to 2034

Figure 132: South Asia and Pacific Market Y-o-Y Growth (%) Projections by Material, 2024 to 2034

Figure 133: South Asia and Pacific Market Value (US$ Billion) Analysis by Product Type, 2019 to 2034

Figure 134: South Asia and Pacific Market Volume (Units) Analysis by Product Type, 2019 to 2034

Figure 135: South Asia and Pacific Market Value Share (%) and BPS Analysis by Product Type, 2024 to 2034

Figure 136: South Asia and Pacific Market Y-o-Y Growth (%) Projections by Product Type, 2024 to 2034

Figure 137: South Asia and Pacific Market Value (US$ Billion) Analysis by End Use, 2019 to 2034

Figure 138: South Asia and Pacific Market Volume (Units) Analysis by End Use, 2019 to 2034

Figure 139: South Asia and Pacific Market Value Share (%) and BPS Analysis by End Use, 2024 to 2034

Figure 140: South Asia and Pacific Market Y-o-Y Growth (%) Projections by End Use, 2024 to 2034

Figure 141: South Asia and Pacific Market Attractiveness by Material, 2024 to 2034

Figure 142: South Asia and Pacific Market Attractiveness by Product Type, 2024 to 2034

Figure 143: South Asia and Pacific Market Attractiveness by End Use, 2024 to 2034

Figure 144: South Asia and Pacific Market Attractiveness by Country, 2024 to 2034

Figure 145: East Asia Market Value (US$ Billion) by Material, 2024 to 2034

Figure 146: East Asia Market Value (US$ Billion) by Product Type, 2024 to 2034

Figure 147: East Asia Market Value (US$ Billion) by End Use, 2024 to 2034

Figure 148: East Asia Market Value (US$ Billion) by Country, 2024 to 2034

Figure 149: East Asia Market Value (US$ Billion) Analysis by Country, 2019 to 2034

Figure 150: East Asia Market Volume (Units) Analysis by Country, 2019 to 2034

Figure 151: East Asia Market Value Share (%) and BPS Analysis by Country, 2024 to 2034

Figure 152: East Asia Market Y-o-Y Growth (%) Projections by Country, 2024 to 2034

Figure 153: East Asia Market Value (US$ Billion) Analysis by Material, 2019 to 2034

Figure 154: East Asia Market Volume (Units) Analysis by Material, 2019 to 2034

Figure 155: East Asia Market Value Share (%) and BPS Analysis by Material, 2024 to 2034

Figure 156: East Asia Market Y-o-Y Growth (%) Projections by Material, 2024 to 2034

Figure 157: East Asia Market Value (US$ Billion) Analysis by Product Type, 2019 to 2034

Figure 158: East Asia Market Volume (Units) Analysis by Product Type, 2019 to 2034

Figure 159: East Asia Market Value Share (%) and BPS Analysis by Product Type, 2024 to 2034

Figure 160: East Asia Market Y-o-Y Growth (%) Projections by Product Type, 2024 to 2034

Figure 161: East Asia Market Value (US$ Billion) Analysis by End Use, 2019 to 2034

Figure 162: East Asia Market Volume (Units) Analysis by End Use, 2019 to 2034

Figure 163: East Asia Market Value Share (%) and BPS Analysis by End Use, 2024 to 2034

Figure 164: East Asia Market Y-o-Y Growth (%) Projections by End Use, 2024 to 2034

Figure 165: East Asia Market Attractiveness by Material, 2024 to 2034

Figure 166: East Asia Market Attractiveness by Product Type, 2024 to 2034

Figure 167: East Asia Market Attractiveness by End Use, 2024 to 2034

Figure 168: East Asia Market Attractiveness by Country, 2024 to 2034

Figure 169: Middle East and Africa Market Value (US$ Billion) by Material, 2024 to 2034

Figure 170: Middle East and Africa Market Value (US$ Billion) by Product Type, 2024 to 2034

Figure 171: Middle East and Africa Market Value (US$ Billion) by End Use, 2024 to 2034

Figure 172: Middle East and Africa Market Value (US$ Billion) by Country, 2024 to 2034

Figure 173: Middle East and Africa Market Value (US$ Billion) Analysis by Country, 2019 to 2034

Figure 174: Middle East and Africa Market Volume (Units) Analysis by Country, 2019 to 2034

Figure 175: Middle East and Africa Market Value Share (%) and BPS Analysis by Country, 2024 to 2034

Figure 176: Middle East and Africa Market Y-o-Y Growth (%) Projections by Country, 2024 to 2034

Figure 177: Middle East and Africa Market Value (US$ Billion) Analysis by Material, 2019 to 2034

Figure 178: Middle East and Africa Market Volume (Units) Analysis by Material, 2019 to 2034

Figure 179: Middle East and Africa Market Value Share (%) and BPS Analysis by Material, 2024 to 2034

Figure 180: Middle East and Africa Market Y-o-Y Growth (%) Projections by Material, 2024 to 2034

Figure 181: Middle East and Africa Market Value (US$ Billion) Analysis by Product Type, 2019 to 2034

Figure 182: Middle East and Africa Market Volume (Units) Analysis by Product Type, 2019 to 2034

Figure 183: Middle East and Africa Market Value Share (%) and BPS Analysis by Product Type, 2024 to 2034

Figure 184: Middle East and Africa Market Y-o-Y Growth (%) Projections by Product Type, 2024 to 2034

Figure 185: Middle East and Africa Market Value (US$ Billion) Analysis by End Use, 2019 to 2034

Figure 186: Middle East and Africa Market Volume (Units) Analysis by End Use, 2019 to 2034

Figure 187: Middle East and Africa Market Value Share (%) and BPS Analysis by End Use, 2024 to 2034

Figure 188: Middle East and Africa Market Y-o-Y Growth (%) Projections by End Use, 2024 to 2034

Figure 189: Middle East and Africa Market Attractiveness by Material, 2024 to 2034

Figure 190: Middle East and Africa Market Attractiveness by Product Type, 2024 to 2034

Figure 191: Middle East and Africa Market Attractiveness by End Use, 2024 to 2034

Figure 192: Middle East and Africa Market Attractiveness by Country, 2024 to 2034

Frequently Asked Questions

What is the expected worth of the bucket market in 2024?

As of 2024, the market for buckets is expected to be valued at USD 1.9 billion.

What is the market potential for buckets?

The bucket market is projected to expand at a CAGR of 2% between 2024 and 2034.

Which product type segment dominates the bucket market?

The open top/head segment is projected to dominate the industry.

What is the anticipated market value for bucket in 2034?

By 2034, the market value of the bucket is expected to reach USD 2.7 billion.

Which country is likely to dominate the bucket market?

India is likely the top-performing market, with a CAGR of 6%.

Explore Similar Insights

Future Market Insights

Bucket Market