Bucket Trucks Market Size, Share, and Forecast Outlook 2025 to 2035

The bucket trucks market is forecast to reach USD 1.5 billion by 2025, with a CAGR of 14.2%. This growth results in a substantial absolute dollar opportunity as the market expands from approximately USD 0.7 billion in 2020. By 2035, the market value is expected to surpass USD 6 billion, supported by rising demand across utilities, telecommunications, and construction sectors.
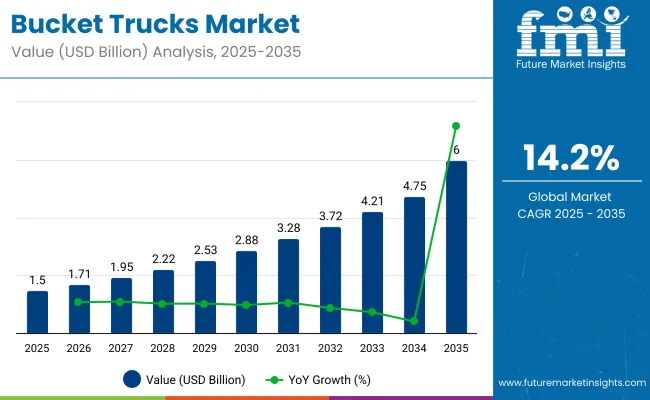
Quick stats of Bucket Trucks Market

  • Bucket Trucks Market Size (2025): USD 1.5 billion
  • Projected Bucket Trucks Market Size (2035): Exceeding USD 6 billion
  • Forecast CAGR of Bucket Trucks Market (2025 to 2035): 14.2%
  • Leading Segment of Bucket Trucks Market (2025): Non-insulated trucks (55%)
  • Key Application Segment of Bucket Trucks Market (2025): Construction (28%)
  • Key Growth Regions of Bucket Trucks Market: North America, Europe, Asia Pacific
  • Top Key Players of Bucket Trucks Market: Aichi Corporation, Altec Inc., Axion Lift, BrontoSkylift, CTE Group SPA, Dur-A-Lift Inc., Elliott Equipment Company, Equipment Technology LLC, Manitex International Inc., Palfinger AG, Tadano Ltd., Terex Corporation, Versalift

Bucket Trucks Market

Metric Value
Industry Size (2025E) USD 1.5 billion
Industry Value (2035F) USD 6 billion
CAGR (2025 to 2035) 14.2%

The replacement of older equipment and ongoing infrastructure development drive consistent market expansion. Investments in power grid upgrades, fiber-optic network installations, and industrial maintenance increase the need for bucket trucks worldwide. North America and Europe account for significant shares due to strict safety regulations and infrastructure enhancements.

Asia Pacific is set for notable growth as urban areas and industrial activity increase. Advancements such as electric and hybrid bucket trucks improve efficiency and reduce emissions, making these vehicles more attractive to fleet operators. The absolute dollar opportunity reflects the revenue growth potential over the coming decade, offering promising prospects for manufacturers and service providers. The market’s steady rise corresponds with the critical role bucket trucks play in supporting infrastructure maintenance and development globally.

The bucket truck market holds distinct shares across its parent markets, reflecting its specialized role. Within the heavy duty trucks market, bucket trucks represent approximately 5-7%. In the broader commercial vehicles market, the share is around 3-5%. Their presence is more significant in the aerial work platforms market, accounting for about 20-25%.

Within the utility vehicles market, bucket trucks comprise roughly 10-12%, while in the construction equipment market, they hold a 4-6% share. These percentages highlight the market’s focused application in sectors requiring elevated access and maintenance.

The industry is experiencing significant advancements, with key players focusing on enhancing safety features, fuel efficiency, and operational capabilities. Manufacturers are integrating advanced telematics systems for real-time monitoring and diagnostics, improving fleet management. There is a growing trend towards the adoption of electric and hybrid powertrains to meet environmental regulations and reduce operating costs.

Additionally, innovations in boom design and insulation materials are enhancing the versatility and safety of bucket trucks, particularly in utility and telecommunications applications. These developments are shaping the future of the bucket truck market, aligning with broader industry trends towards sustainability and technological integration.

Top Bucket Trucks Market Dynamics

Utilities spend approximately 10 to 15% of their budgets on aerial maintenance activities. Advanced insulated booms with load capacities up to 500 kilograms improve job safety and efficiency. Acquisition costs typically range from USD 150,000 to USD 200,000 per vehicle, with maintenance expenses limiting wider fleet adoption. Electric bucket trucks reduce fuel consumption by up to 40%. Telematics technology is implemented in nearly 30% of new trucks, enhancing operational control.

Expansion in Utilities and Telecom Networks Supports Market Demand

Utilities worldwide plan to invest over USD 100 billion in grid modernization and upkeep through 2028, driving bucket truck requirements. Telecom 5G coverage targets over 60% of the population by 2025, necessitating elevated equipment access for installation and repair. Bucket trucks enable safe work at heights from 10 to 40 meters on power poles, streetlights, and telecom towers. Improved electrical insulation reduces exposure to hazards by nearly 80%, enhancing workplace safety and compliance.

  • Substantial utility infrastructure investment fuels bucket truck procurement.
  • Telecom rollout generates consistent demand for aerial access vehicles.
  • Safety advancements mitigate electrical risk for operators.

Significant Capital and Maintenance Costs Hinder Market Expansion

Bucket trucks cost between USD 120,000 and USD 250,000 depending on features, creating barriers for smaller operators. Annual maintenance consumes 10 to 15% of total ownership costs, including hydraulic system upkeep and part replacements. Mandatory operator training imposes additional expenses estimated at USD 1,000 to USD 3,000 annually per driver. Diesel fuel price volatility, sometimes shifting by 20% yearly, affects operational budgets. Equipment downtime averages 5 to 7% of operational hours, impacting fleet productivity.

  • Considerable upfront investment limits acquisition by smaller companies.
  • Regular upkeep and operator training contribute to operating expenses.
  • Fluctuating fuel prices elevate overall fleet operating costs.

Electric and Hybrid Bucket Trucks Reduce Operational Costs and Emissions

Electric bucket trucks cut fuel consumption by as much as 40% and lower maintenance needs by roughly 25%, thanks to fewer mechanical components. Hybrid trucks extend operational hours and reduce emissions by approximately 30% compared to diesel models. Government incentives provide tax credits up to 30% of purchase price, boosting adoption rates. Battery technology improvements enable over 8 hours of continuous operation per charge. Adoption by municipal and utility fleets is growing, with electric models expected to reach 15% of new sales by 2030.

  • Electric trucks deliver substantial savings in fuel and maintenance expenditures.
  • Hybrid technology enhances operational range and environmental performance.
  • Incentive programs accelerate the transition to clean vehicle fleets.

Telematics Integration and Modular Designs Enhance Fleet Productivity

Approximately 30% of bucket trucks in developed markets utilize telematics for live location tracking, equipment monitoring, and maintenance forecasting, decreasing fuel usage by 12% and downtime by 15%. Modular designs allow operators to adjust aerial lift heights from 10 to 40 meters and support load capacities up to 1,000 kilograms.

Cloud-based management platforms enable remote diagnostics and efficient fleet coordination. Use of lightweight materials such as aluminum alloys lowers vehicle weight by 15%, improving fuel economy. Hybrid powertrain adoption increases at about 8% annually, reflecting demand for greener solutions.

  • Fleet operators benefit from data-driven monitoring and predictive upkeep.
  • Adjustable platform configurations meet varied operational demands.
  • Lightweight materials and hybrid engines optimize fuel consumption.

Analyzing Bucket Trucks Market by Top Investment Segments

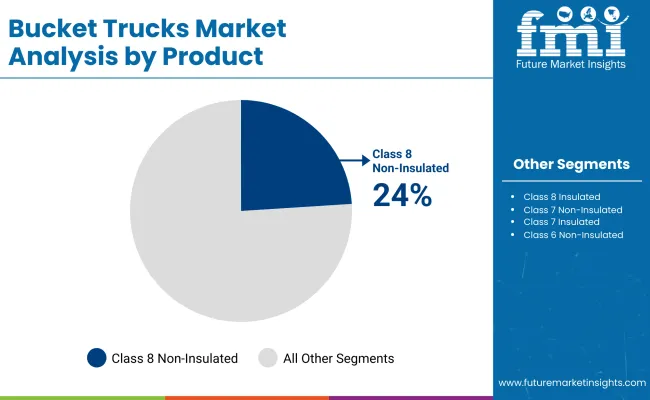
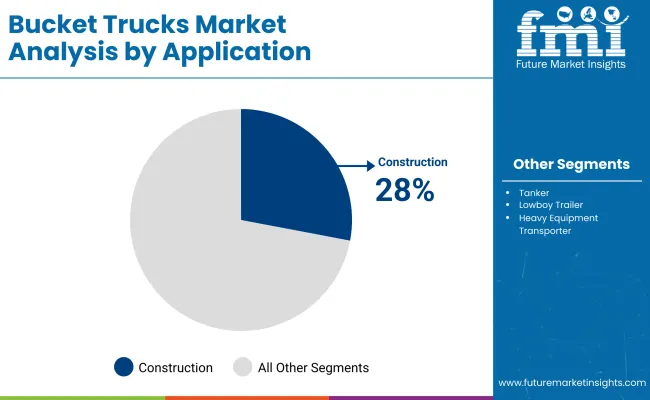
The bucket trucks market in 2025 is primarily led by class 8 non-insulated trucks, which capture 24% market share by product. Non-insulated trucks dominate the type category at 55%, reflecting their widespread use across applications. Construction is the largest application segment with 28%, driven by infrastructure projects and equipment installation. The utility sector follows with 22% share, relying on bucket trucks for maintenance and repair activities. Insulated variants account for 45% of the type segment, addressing safety needs in electrical and telecommunication work.
Class 8 non-insulated trucks lead by product segment

Bucket Trucks Market By Product

Class 8 non-insulated trucks hold 24% share of the product category, positioning them as the largest sub segment by value. These trucks are widely used in heavy-duty applications requiring extended reach and load capacity, including large-scale construction and utility maintenance. Manufacturers like Altec, Versalift, and Terex focus on optimizing chassis strength and boom reach for demanding environments.

The non-insulated design suits applications where electrical isolation is not required, providing cost-effective solutions with robust performance. Class 8 trucks’ high GVWR enables them to carry heavier equipment and withstand rugged terrain, which is critical for heavy infrastructure projects and emergency repair operations.

  • 24% market share driven by demand in heavy construction and utilities
  • High GVWR supports carrying heavy equipment and personnel safely
  • Focus on boom durability and reach optimization by OEMs

Non-insulated trucks dominate type category in 2025

Non-insulated trucks account for 55% of the bucket trucks market by type, reflecting their extensive use across construction, forestry, and water management applications. These trucks offer versatility in non-electrical environments where safety insulation is not required, reducing manufacturing costs and maintenance complexity.

Companies such as Altec and Terex emphasize modular designs and ease of serviceability to enhance uptime for operators. Non-insulated variants are preferred for their ruggedness and adaptability, serving as workhorses for industries that require frequent, reliable aerial access without electrical hazard concerns. The segment’s dominance aligns with increasing infrastructure projects and utility maintenance needs globally.
  • 55% share due to wide applicability in non-electrical work environments
  • Modular design focus supports quick repairs and lower downtime
  • Favored for durability in diverse operational conditions

Construction sector leads bucket truck applications

Bucket Trucks Market By Application

Construction is the leading application segment with 28% share, driven by demand for aerial access in building, maintenance, and infrastructure development projects. Bucket trucks facilitate installation of electrical lines, signage, and lighting, enabling safe, elevated work. Companies like Terex, Altec, and Versalift supply models tailored for construction environments, focusing on boom reach, maneuverability, and operator safety.

The sector’s growth is linked to expanding urban development, highway projects, and commercial construction activity. Demand is particularly strong for non-insulated trucks in construction, where electrical hazard is limited, but precise reach and durability are critical.
  • 28% application share supported by expanding infrastructure and urban projects
  • Focus on operator safety and boom flexibility in construction models
  • High demand for trucks capable of navigating congested urban job sites

Top Countries Driving Bucket Trucks Market Growth

Bucket Trucks Market By Country

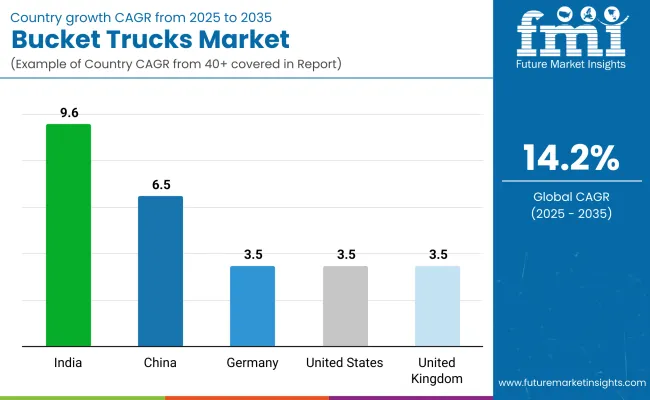
The market is projected to grow at a CAGR of 14.2% from 2025 to 2035. India leads with a CAGR of 9.6%, followed by China at 6.5%. Germany, the United States, and the United Kingdom each record growth of 3.5%. India’s growth is -32% below the global average, while China trails by -54%.

Germany, the United States, and the United Kingdom show a similar difference of -75%. Market expansion is shaped by rapid infrastructure development and utility sector investments in BRICS countries, while OECD nations focus on fleet modernization and technological upgrades. ASEAN economies, although not listed here, are expected to contribute through increasing demand for maintenance and service vehicles. The contrast between emerging and mature markets highlights varied drivers influencing the bucket trucks segment globally.

Analysis of Bucket Trucks Market in India

The demand of bucket trucks in India is projected to grow at a CAGR of 9.6%, propelled by infrastructure development and expanding utility networks. Operators prefer versatile models with robust hydraulic lifts suitable for varied terrain and climatic conditions. Domestic manufacturers focus on cost effective solutions with extended service intervals to reduce downtime. Financing linked to project schedules has enabled smaller operators to acquire new equipment. Safety training programs are increasingly adopted to meet regulatory requirements and reduce on-site incidents.

  • Hydraulic lift reliability improvements have extended average service intervals by 22%.
  • Project-based financing has increased new equipment acquisitions by smaller contractors by 15%.
  • Safety training adoption has contributed to a 12% reduction in workplace accidents involving bucket trucks.

Demand Forecast for Bucket Trucks Market in China

The bucket trucks market in China is expected to expand at a CAGR of 6.5%, driven by rapid industrial growth and urban infrastructure upgrades. Large OEMs provide a range of electric and diesel-powered bucket trucks tailored for heavy duty applications. Dealer networks have improved spare parts availability, reducing repair lead times. Integration of smart control systems enhances operational precision and safety during maintenance work. Municipal fleet renewals and renewable energy projects contribute to sustained demand for bucket trucks with advanced features.

  • Electric bucket trucks now account for nearly 25% of new sales in major metropolitan regions.
  • Spare parts supply chain improvements have cut average repair times by 20-24 hours.
  • Smart control system integration has lowered operational errors by 15%.

Heavy Haul Truck Market Growth Outlook in Germany

The bucket trucks industry in Germany is forecast to grow at a CAGR of 3.5%, supported by stringent safety standards and emphasis on energy efficient vehicles. Operators select models with advanced stabilization systems and low emission engines to comply with regulatory norms.

Modular aerial platforms improve adaptability for diverse applications including maintenance of renewable energy installations. Digital fleet management tools enhance scheduling efficiency and reduce idle times, improving overall productivity in heavy maintenance operations.

  • Adoption of stabilization technology has decreased operational setup time by 17%.
  • Low emission engines have reduced fleet average emissions by 22%.
  • Fleet management software has improved utilization rates by up to 19%.

Growth Analysis of Bucket Trucks Market in the United States

The United States bucket trucks market is anticipated to grow at a CAGR of 3.5%, driven by infrastructure upgrades and utility grid modernization projects. Demand focuses on models with higher reach and load capacities to support telecom and power distribution maintenance. Lease and rental options are widely used to optimize capital deployment. Increasing use of telematics supports real-time monitoring and predictive maintenance, helping reduce downtime and repair costs in fleet operations.

  • Average boom reach in new bucket trucks has increased by approximately 8% over the past five years.
  • Leasing and rental penetration has expanded by 14%, improving fleet flexibility.
  • Predictive maintenance enabled by telematics has reduced unplanned repairs by 16%.

Future Outlook for Bucket Trucks Market in the United Kingdom

The United Kingdom bucket trucks market is forecast to grow at a CAGR of 3.5%, supported by rising demand for aerial work platforms in urban infrastructure and telecom sectors. Operators prefer compact, maneuverable models capable of navigating narrow streets and congested sites. Investment in electric bucket trucks is increasing due to emission regulations. Close collaboration between fleet operators and local authority’s streamlines permitting for oversize vehicles, reducing project delays.
  • Compact models now represent nearly 30% of bucket truck sales in urban areas.
  • Electric bucket truck sales have grown by over 40% in the last three years.
  • Streamlined permitting processes have reduced project delays related to vehicle access by 15%.

Leading Bucket Truck Manufacturers, Suppliers, Distributors

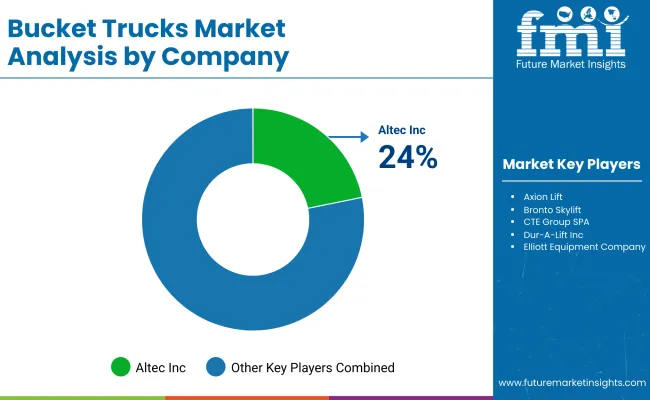
Bucket Trucks Market By Company

Leading bucket truck manufacturers employ a variety of strategies to strengthen their market positions and meet diverse industry demands. Aichi Corporation has expanded its product lineup with models offering greater reach and enhanced safety features. Altec Inc. focuses on research and development, recently launching lightweight, durable aerial devices tailored for utility and telecommunications sectors. Axion Lift emphasizes modular designs for customization, helping it grow in regional markets.

BrontoSkylift and CTE Group SPA broaden their ranges to address different height and terrain needs, with BrontoSkylift introducing trucks designed for challenging urban environments and CTE Group SPA expanding its international dealer network. Dur-A-Lift Inc. and Elliott Equipment Company invest in hydraulic system improvements aimed at boosting performance and reducing maintenance costs. Equipment Technology LLC gains traction with engineering focused on stability and maneuverability in specialized applications.

Manitex International Inc. pursues growth through acquisitions and diversified product offerings, serving construction and maintenance industries with versatile boom trucks. Palfinger AG and Tadano Ltd. have launched models featuring improved controls and safety technology to enhance operator efficiency. Terex Corporation integrates user feedback into product development, expanding its range with versatile, cost-effective bucket trucks.

Versalift focuses on customer retention through training and aftersales support while targeting global expansion. Emerging companies compete with competitive pricing and tailored designs for specific regions, using localized manufacturing and flexible product configurations to capture market share. These strategies collectively reflect the industry’s response to evolving operational challenges and customer needs.

Leading Players

  • Aichi Corporation
  • Altec Inc.
  • Axion Lift
  • BrontoSkylift
  • CTE Group SPA
  • Dur-A-Lift Inc.
  • Elliott Equipment Company
  • Equipment Technology LLC
  • Manitex International Inc.
  • Palfinger AG
  • Tadano Ltd.
  • Terex Corporation
  • Versalift
  • Terex Corporation
  • Palfinger AG

Report Scope

Report Attributes Details
Market Size (2025) USD 1.5 billion
Projected Market Size (2035) Exceeding USD 6 billion
CAGR (2025 to 2035) 14.2%
Base Year for Estimation 2024
Historical Period 2020 to 2024
Projections Period 2025 to 2035
Quantitative Units USD billion for value and relevant units for volume
Product Types Analyzed (Segment 1) Class 4 (Insulated, Non-Insulated), Class 5 (Insulated, Non-Insulated), Class 6 (Insulated, Non-Insulated), Class 7 (Insulated, Non-Insulated), Class 8 (Insulated, Non-Insulated)
Type Analyzed (Segment 2) Insulated, Non-Insulated
Applications Analyzed (Segment 3) Construction, Utility, Electric, Water, Telecommunication, Forestry
Regions Covered North America; Europe; Asia Pacific; Latin America; Middle East and Africa
Countries Covered United States, Canada, Germany, France, United Kingdom, China, Japan, Brazil, India, South Africa, UAE
Key Players Influencing the Market Aichi Corporation, Altec Inc., Axion Lift, Bronto Skylift, CTE Group SPA, Dur -A-Lift Inc., Elliott Equipment Company, Equipment Technology LLC, Manitex International Inc., Palfinger AG, Tadano Ltd., Terex Corporation, Versalift
Additional Attributes Dollar sales by truck type and lifting capacity, demand dynamics across utility services, construction, and telecommunications, regional trends in deployment across North America, Europe, and Asia-Pacific, innovation in safety systems, electric powertrains, and telematics, environmental impact of fuel use and emissions, and emerging use cases in renewable energy maintenance, smart city infrastructure, and disaster response operations

Bucket Truck Market Analyzed by Key Investment Segments 

By Product:

  • Class 4
  • Insulated
  • Non-Insulated
  • Class 5
  • Insulated
  • Non-Insulated
  • Class 6
  • Insulated
  • Non-Insulated
  • Class 7
  • Insulated
  • Non-Insulated
  • Class 8
  • Insulated
  • Non-Insulated

By Type:

  • Insulated
  • Non-Insulated

By Application:

  • Construction
  • Utility
  • Electric
  • Water
  • Telecommunication
  • Forestry

By Geography:

  • North America
  • Europe
  • Asia Pacific
  • Latin America
  • Middle East and Africa

Table of Content

  1. Executive Summary
    • Global Market Outlook
    • Demand-side Trends
    • Supply-side Trends
    • Technology Roadmap Analysis
    • Analysis and Recommendations
  2. Market Overview
    • Market Coverage / Taxonomy
    • Market Definition / Scope / Limitations
  3. Market Background
    • Market Dynamics
      • Drivers
      • Restraints
      • Opportunity
      • Trends
    • Scenario Forecast
      • Demand in Optimistic Scenario
      • Demand in Likely Scenario
      • Demand in Conservative Scenario
    • Opportunity Map Analysis
    • Product Life Cycle Analysis
    • Supply Chain Analysis
      • Supply Side Participants and their Roles
        • Producers
        • Mid-Level Participants (Traders/ Agents/ Brokers)
        • Wholesalers and Distributors
      • Value Added and Value Created at Node in the Supply Chain
      • List of Raw Material Suppliers
      • List of Existing and Potential Buyer’s
    • Investment Feasibility Matrix
    • Value Chain Analysis
      • Profit Margin Analysis
      • Wholesalers and Distributors
      • Retailers
    • PESTLE and Porter’s Analysis
    • Regulatory Landscape
      • By Key Regions
      • By Key Countries
    • Regional Parent Market Outlook
    • Production and Consumption Statistics
    • Import and Export Statistics
  4. Global Market Analysis 2020 to 2024 and Forecast, 2025 to 2035
    • Historical Market Size Value (USD Billion) & Volume (Units) Analysis, 2020 to 2024
    • Current and Future Market Size Value (USD Billion) & Volume (Units) Projections, 2025 to 2035
      • Y-o-Y Growth Trend Analysis
      • Absolute $ Opportunity Analysis
  5. Global Market Pricing Analysis 2020 to 2024 and Forecast 2025 to 2035
  6. Global Market Analysis 2020 to 2024 and Forecast 2025 to 2035, By Product
    • Introduction / Key Findings
    • Historical Market Size Value (USD Billion) & Volume (Units) Analysis By Product, 2020 to 2024
    • Current and Future Market Size Value (USD Billion) & Volume (Units) Analysis and Forecast By Product, 2025 to 2035
      • Class 4
        • Insulated
        • Non-Insulated
      • Class 5
        • Insulated
        • Non-Insulated
      • Class 6
        • Insulated
        • Non-Insulated
      • Class 7
        • Insulated
        • Non-Insulated
      • Class 8
        • Insulated
        • Non-Insulated
    • Y-o-Y Growth Trend Analysis By Product, 2020 to 2024
    • Absolute $ Opportunity Analysis By Product, 2025 to 2035
  7. Global Market Analysis 2020 to 2024 and Forecast 2025 to 2035, By Type
    • Introduction / Key Findings
    • Historical Market Size Value (USD Billion) & Volume (Units) Analysis By Type, 2020 to 2024
    • Current and Future Market Size Value (USD Billion) & Volume (Units) Analysis and Forecast By Type, 2025 to 2035
      • Insulated
      • Non-Insulated
    • Y-o-Y Growth Trend Analysis By Type, 2020 to 2024
    • Absolute $ Opportunity Analysis By Type, 2025 to 2035
  8. Global Market Analysis 2020 to 2024 and Forecast 2025 to 2035, By Application
    • Introduction / Key Findings
    • Historical Market Size Value (USD Billion) & Volume (Units) Analysis By Application, 2020 to 2024
    • Current and Future Market Size Value (USD Billion) & Volume (Units) Analysis and Forecast By Application, 2025 to 2035
      • Construction
      • Utility
      • Electric
      • Water
      • Telecommunication
      • Forestry
    • Y-o-Y Growth Trend Analysis By Application, 2020 to 2024
    • Absolute $ Opportunity Analysis By Application, 2025 to 2035
  9. Global Market Analysis 2020 to 2024 and Forecast 2025 to 2035, By Region
    • Introduction
    • Historical Market Size Value (USD Billion) & Volume (Units) Analysis By Region, 2020 to 2024
    • Current Market Size Value (USD Billion) & Volume (Units) Analysis and Forecast By Region, 2025 to 2035
      • North America
      • Latin America
      • Western Europe
      • Eastern Europe
      • East Asia
      • South Asia & Pacific
      • Middle East and Africa
    • Market Attractiveness Analysis By Region
  10. North America Market Analysis 2020 to 2024 and Forecast 2025 to 2035, By Country
    • Historical Market Size Value (USD Billion) & Volume (Units) Trend Analysis By Market Taxonomy, 2020 to 2024
    • Market Size Value (USD Billion) & Volume (Units) Forecast By Market Taxonomy, 2025 to 2035
      • By Country
        • USA
        • Canada
        • Mexico
      • By Product
      • By Type
      • By Application
    • Market Attractiveness Analysis
      • By Country
      • By Product
      • By Type
      • By Application
    • Key Takeaways
  11. Latin America Market Analysis 2020 to 2024 and Forecast 2025 to 2035, By Country
    • Historical Market Size Value (USD Billion) & Volume (Units) Trend Analysis By Market Taxonomy, 2020 to 2024
    • Market Size Value (USD Billion) & Volume (Units) Forecast By Market Taxonomy, 2025 to 2035
      • By Country
        • Brazil
        • Argentina
        • Rest of LATAM
      • By Product
      • By Type
      • By Application
    • Market Attractiveness Analysis
      • By Country
      • By Product
      • By Type
      • By Application
    • Key Takeaways
  12. Western Europe Market Analysis 2020 to 2024 and Forecast 2025 to 2035, By Country
    • Historical Market Size Value (USD Billion) & Volume (Units) Trend Analysis By Market Taxonomy, 2020 to 2024
    • Market Size Value (USD Billion) & Volume (Units) Forecast By Market Taxonomy, 2025 to 2035
      • By Country
        • Germany
        • Italy
        • France
        • UK
        • Spain
        • BENELUX
        • Nordic
        • Rest of W.Europe
      • By Product
      • By Type
      • By Application
    • Market Attractiveness Analysis
      • By Country
      • By Product
      • By Type
      • By Application
    • Key Takeaways
  13. Eastern Europe Market Analysis 2020 to 2024 and Forecast 2025 to 2035, By Country
    • Historical Market Size Value (USD Billion) & Volume (Units) Trend Analysis By Market Taxonomy, 2020 to 2024
    • Market Size Value (USD Billion) & Volume (Units) Forecast By Market Taxonomy, 2025 to 2035
      • By Country
        • Russia
        • Hungary
        • Poland
        • Balkan & Baltics
        • Rest of E. Europe
      • By Product
      • By Type
      • By Application
    • Market Attractiveness Analysis
      • By Country
      • By Product
      • By Type
      • By Application
    • Key Takeaways
  14. East Asia Market Analysis 2020 to 2024 and Forecast 2025 to 2035, By Country
    • Historical Market Size Value (USD Billion) & Volume (Units) Trend Analysis By Market Taxonomy, 2020 to 2024
    • Market Size Value (USD Billion) & Volume (Units) Forecast By Market Taxonomy, 2025 to 2035
      • By Country
        • China
        • Japan
        • South Korea
      • By Product
      • By Type
      • By Application
    • Market Attractiveness Analysis
      • By Country
      • By Product
      • By Type
      • By Application
    • Key Takeaways
  15. South Asia & Pacific Market Analysis 2020 to 2024 and Forecast 2025 to 2035, By Country
    • Historical Market Size Value (USD Billion) & Volume (Units) Trend Analysis By Market Taxonomy, 2020 to 2024
    • Market Size Value (USD Billion) & Volume (Units) Forecast By Market Taxonomy, 2025 to 2035
      • By Country
        • India
        • Australia & New Zealand
        • ASEAN
        • Rest of SAP
      • By Product
      • By Type
      • By Application
    • Market Attractiveness Analysis
      • By Country
      • By Product
      • By Type
      • By Application
    • Key Takeaways
  16. Middle East and Africa Market Analysis 2020 to 2024 and Forecast 2025 to 2035, By Country
    • Historical Market Size Value (USD Billion) & Volume (Units) Trend Analysis By Market Taxonomy, 2020 to 2024
    • Market Size Value (USD Billion) & Volume (Units) Forecast By Market Taxonomy, 2025 to 2035
      • By Country
        • GCC Countries
        • Northern Africa
        • South Africa
        • Turkiye
        • Rest of MEA
      • By Product
      • By Type
      • By Application
    • Market Attractiveness Analysis
      • By Country
      • By Product
      • By Type
      • By Application
    • Key Takeaways
  17. Key Countries Market Analysis
    • USA
      • Pricing Analysis
      • Market Share Analysis, 2024
        • By Product
        • By Type
        • By Application
    • Canada
      • Pricing Analysis
      • Market Share Analysis, 2024
        • By Product
        • By Type
        • By Application
    • Brazil
      • Pricing Analysis
      • Market Share Analysis, 2024
        • By Product
        • By Type
        • By Application
    • Mexico
      • Pricing Analysis
      • Market Share Analysis, 2024
        • By Product
        • By Type
        • By Application
    • Argentina
      • Pricing Analysis
      • Market Share Analysis, 2024
        • By Product
        • By Type
        • By Application
  18. Market Structure Analysis
    • Competition Dashboard
    • Competition Benchmarking
    • Market Share Analysis of Top Players
      • By Regional
      • By Product
      • By Type
      • By Application
  19. Competition Analysis
    • Competition Deep Dive
      • Aichi Corporation
        • Overview
        • Product Portfolio
        • Profitability by Market Segments (Product/Age /Sales Channel/Region)
        • Sales Footprint
        • Strategy Overview
          • Marketing Strategy
          • Product Strategy
          • Channel Strategy
      • Altec Inc.
        • Overview
        • Product Portfolio
        • Profitability by Market Segments (Product/Age /Sales Channel/Region)
        • Sales Footprint
        • Strategy Overview
          • Marketing Strategy
          • Product Strategy
          • Channel Strategy
      • Axion Lift
        • Overview
        • Product Portfolio
        • Profitability by Market Segments (Product/Age /Sales Channel/Region)
        • Sales Footprint
        • Strategy Overview
          • Marketing Strategy
          • Product Strategy
          • Channel Strategy
      • Bronto Skylift
        • Overview
        • Product Portfolio
        • Profitability by Market Segments (Product/Age /Sales Channel/Region)
        • Sales Footprint
        • Strategy Overview
          • Marketing Strategy
          • Product Strategy
          • Channel Strategy
      • CTE Group SPA
        • Overview
        • Product Portfolio
        • Profitability by Market Segments (Product/Age /Sales Channel/Region)
        • Sales Footprint
        • Strategy Overview
          • Marketing Strategy
          • Product Strategy
          • Channel Strategy
      • Dur-A-Lift Inc.
        • Overview
        • Product Portfolio
        • Profitability by Market Segments (Product/Age /Sales Channel/Region)
        • Sales Footprint
        • Strategy Overview
          • Marketing Strategy
          • Product Strategy
          • Channel Strategy
      • Elliott Equipment Company
        • Overview
        • Product Portfolio
        • Profitability by Market Segments (Product/Age /Sales Channel/Region)
        • Sales Footprint
        • Strategy Overview
          • Marketing Strategy
          • Product Strategy
          • Channel Strategy
      • Equipment Technology LLC
        • Overview
        • Product Portfolio
        • Profitability by Market Segments (Product/Age /Sales Channel/Region)
        • Sales Footprint
        • Strategy Overview
          • Marketing Strategy
          • Product Strategy
          • Channel Strategy
      • Manitex International Inc.
        • Overview
        • Product Portfolio
        • Profitability by Market Segments (Product/Age /Sales Channel/Region)
        • Sales Footprint
        • Strategy Overview
          • Marketing Strategy
          • Product Strategy
          • Channel Strategy
      • Palfinger AG
        • Overview
        • Product Portfolio
        • Profitability by Market Segments (Product/Age /Sales Channel/Region)
        • Sales Footprint
        • Strategy Overview
          • Marketing Strategy
          • Product Strategy
          • Channel Strategy
      • Tadano Ltd.
        • Overview
        • Product Portfolio
        • Profitability by Market Segments (Product/Age /Sales Channel/Region)
        • Sales Footprint
        • Strategy Overview
          • Marketing Strategy
          • Product Strategy
          • Channel Strategy
      • Terex Corporation
        • Overview
        • Product Portfolio
        • Profitability by Market Segments (Product/Age /Sales Channel/Region)
        • Sales Footprint
        • Strategy Overview
          • Marketing Strategy
          • Product Strategy
          • Channel Strategy
      • Versalift
        • Overview
        • Product Portfolio
        • Profitability by Market Segments (Product/Age /Sales Channel/Region)
        • Sales Footprint
        • Strategy Overview
          • Marketing Strategy
          • Product Strategy
          • Channel Strategy
      • Terex Corporation
        • Overview
        • Product Portfolio
        • Profitability by Market Segments (Product/Age /Sales Channel/Region)
        • Sales Footprint
        • Strategy Overview
          • Marketing Strategy
          • Product Strategy
          • Channel Strategy
      • Palfinger AG
        • Overview
        • Product Portfolio
        • Profitability by Market Segments (Product/Age /Sales Channel/Region)
        • Sales Footprint
        • Strategy Overview
          • Marketing Strategy
          • Product Strategy
          • Channel Strategy
  20. Assumptions & Acronyms Used
  21. Research Methodology

List of Tables

  • Table 1: Global Market Value (USD Billion) Forecast by Region, 2020-2035
  • Table 2: Global Market Volume (Units) Forecast by Region, 2020-2035
  • Table 3: Global Market Value (USD Billion) Forecast by Product, 2020-2035
  • Table 4: Global Market Volume (Units) Forecast by Product, 2020-2035
  • Table 5: Global Market Value (USD Billion) Forecast by Type, 2020-2035
  • Table 6: Global Market Volume (Units) Forecast by Type, 2020-2035
  • Table 7: Global Market Value (USD Billion) Forecast by Application, 2020-2035
  • Table 8: Global Market Volume (Units) Forecast by Application, 2020-2035
  • Table 9: North America Market Value (USD Billion) Forecast by Country, 2020-2035
  • Table 10: North America Market Volume (Units) Forecast by Country, 2020-2035
  • Table 11: North America Market Value (USD Billion) Forecast by Product, 2020-2035
  • Table 12: North America Market Volume (Units) Forecast by Product, 2020-2035
  • Table 13: North America Market Value (USD Billion) Forecast by Type, 2020-2035
  • Table 14: North America Market Volume (Units) Forecast by Type, 2020-2035
  • Table 15: North America Market Value (USD Billion) Forecast by Application, 2020-2035
  • Table 16: North America Market Volume (Units) Forecast by Application, 2020-2035
  • Table 17: Latin America Market Value (USD Billion) Forecast by Country, 2020-2035
  • Table 18: Latin America Market Volume (Units) Forecast by Country, 2020-2035
  • Table 19: Latin America Market Value (USD Billion) Forecast by Product, 2020-2035
  • Table 20: Latin America Market Volume (Units) Forecast by Product, 2020-2035
  • Table 21: Latin America Market Value (USD Billion) Forecast by Type, 2020-2035
  • Table 22: Latin America Market Volume (Units) Forecast by Type, 2020-2035
  • Table 23: Latin America Market Value (USD Billion) Forecast by Application, 2020-2035
  • Table 24: Latin America Market Volume (Units) Forecast by Application, 2020-2035
  • Table 25: Western Europe Market Value (USD Billion) Forecast by Country, 2020-2035
  • Table 26: Western Europe Market Volume (Units) Forecast by Country, 2020-2035
  • Table 27: Western Europe Market Value (USD Billion) Forecast by Product, 2020-2035
  • Table 28: Western Europe Market Volume (Units) Forecast by Product, 2020-2035
  • Table 29: Western Europe Market Value (USD Billion) Forecast by Type, 2020-2035
  • Table 30: Western Europe Market Volume (Units) Forecast by Type, 2020-2035
  • Table 31: Western Europe Market Value (USD Billion) Forecast by Application, 2020-2035
  • Table 32: Western Europe Market Volume (Units) Forecast by Application, 2020-2035
  • Table 33: Eastern Europe Market Value (USD Billion) Forecast by Country, 2020-2035
  • Table 34: Eastern Europe Market Volume (Units) Forecast by Country, 2020-2035
  • Table 35: Eastern Europe Market Value (USD Billion) Forecast by Product, 2020-2035
  • Table 36: Eastern Europe Market Volume (Units) Forecast by Product, 2020-2035
  • Table 37: Eastern Europe Market Value (USD Billion) Forecast by Type, 2020-2035
  • Table 38: Eastern Europe Market Volume (Units) Forecast by Type, 2020-2035
  • Table 39: Eastern Europe Market Value (USD Billion) Forecast by Application, 2020-2035
  • Table 40: Eastern Europe Market Volume (Units) Forecast by Application, 2020-2035
  • Table 41: East Asia Market Value (USD Billion) Forecast by Country, 2020-2035
  • Table 42: East Asia Market Volume (Units) Forecast by Country, 2020-2035
  • Table 43: East Asia Market Value (USD Billion) Forecast by Product, 2020-2035
  • Table 44: East Asia Market Volume (Units) Forecast by Product, 2020-2035
  • Table 45: East Asia Market Value (USD Billion) Forecast by Type, 2020-2035
  • Table 46: East Asia Market Volume (Units) Forecast by Type, 2020-2035
  • Table 47: East Asia Market Value (USD Billion) Forecast by Application, 2020-2035
  • Table 48: East Asia Market Volume (Units) Forecast by Application, 2020-2035
  • Table 49: South Asia & Pacific Market Value (USD Billion) Forecast by Country, 2020-2035
  • Table 50: South Asia & Pacific Market Volume (Units) Forecast by Country, 2020-2035
  • Table 51: South Asia & Pacific Market Value (USD Billion) Forecast by Product, 2020-2035
  • Table 52: South Asia & Pacific Market Volume (Units) Forecast by Product, 2020-2035
  • Table 53: South Asia & Pacific Market Value (USD Billion) Forecast by Type, 2020-2035
  • Table 54: South Asia & Pacific Market Volume (Units) Forecast by Type, 2020-2035
  • Table 55: South Asia & Pacific Market Value (USD Billion) Forecast by Application, 2020-2035
  • Table 56: South Asia & Pacific Market Volume (Units) Forecast by Application, 2020-2035
  • Table 57: Middle East and Africa Market Value (USD Billion) Forecast by Country, 2020-2035
  • Table 58: Middle East and Africa Market Volume (Units) Forecast by Country, 2020-2035
  • Table 59: Middle East and Africa Market Value (USD Billion) Forecast by Product, 2020-2035
  • Table 60: Middle East and Africa Market Volume (Units) Forecast by Product, 2020-2035
  • Table 61: Middle East and Africa Market Value (USD Billion) Forecast by Type, 2020-2035
  • Table 62: Middle East and Africa Market Volume (Units) Forecast by Type, 2020-2035
  • Table 63: Middle East and Africa Market Value (USD Billion) Forecast by Application, 2020-2035
  • Table 64: Middle East and Africa Market Volume (Units) Forecast by Application, 2020-2035

List of Figures

  • Figure 1: Global Market Volume (Units) Forecast 2020-2035
  • Figure 2: Global Market Pricing Analysis
  • Figure 3: Global Market Value (USD Billion) Forecast 2020-2035
  • Figure 4: Global Market Value Share and BPS Analysis by Product, 2025 and 2035
  • Figure 5: Global Market Y-o-Y Growth Comparison by Product, 2025-2035
  • Figure 6: Global Market Attractiveness Analysis by Product
  • Figure 7: Global Market Value Share and BPS Analysis by Type, 2025 and 2035
  • Figure 8: Global Market Y-o-Y Growth Comparison by Type, 2025-2035
  • Figure 9: Global Market Attractiveness Analysis by Type
  • Figure 10: Global Market Value Share and BPS Analysis by Application, 2025 and 2035
  • Figure 11: Global Market Y-o-Y Growth Comparison by Application, 2025-2035
  • Figure 12: Global Market Attractiveness Analysis by Application
  • Figure 13: Global Market Value (USD Billion) Share and BPS Analysis by Region, 2025 and 2035
  • Figure 14: Global Market Y-o-Y Growth Comparison by Region, 2025-2035
  • Figure 15: Global Market Attractiveness Analysis by Region
  • Figure 16: North America Market Incremental $ Opportunity, 2025-2035
  • Figure 17: Latin America Market Incremental $ Opportunity, 2025-2035
  • Figure 18: Western Europe Market Incremental $ Opportunity, 2025-2035
  • Figure 19: Eastern Europe Market Incremental $ Opportunity, 2025-2035
  • Figure 20: East Asia Market Incremental $ Opportunity, 2025-2035
  • Figure 21: South Asia & Pacific Market Incremental $ Opportunity, 2025-2035
  • Figure 22: Middle East and Africa Market Incremental $ Opportunity, 2025-2035
  • Figure 23: North America Market Value Share and BPS Analysis by Country, 2025 and 2035
  • Figure 24: North America Market Value Share and BPS Analysis by Product, 2025 and 2035
  • Figure 25: North America Market Y-o-Y Growth Comparison by Product, 2025-2035
  • Figure 26: North America Market Attractiveness Analysis by Product
  • Figure 27: North America Market Value Share and BPS Analysis by Type, 2025 and 2035
  • Figure 28: North America Market Y-o-Y Growth Comparison by Type, 2025-2035
  • Figure 29: North America Market Attractiveness Analysis by Type
  • Figure 30: North America Market Value Share and BPS Analysis by Application, 2025 and 2035
  • Figure 31: North America Market Y-o-Y Growth Comparison by Application, 2025-2035
  • Figure 32: North America Market Attractiveness Analysis by Application
  • Figure 33: Latin America Market Value Share and BPS Analysis by Country, 2025 and 2035
  • Figure 34: Latin America Market Value Share and BPS Analysis by Product, 2025 and 2035
  • Figure 35: Latin America Market Y-o-Y Growth Comparison by Product, 2025-2035
  • Figure 36: Latin America Market Attractiveness Analysis by Product
  • Figure 37: Latin America Market Value Share and BPS Analysis by Type, 2025 and 2035
  • Figure 38: Latin America Market Y-o-Y Growth Comparison by Type, 2025-2035
  • Figure 39: Latin America Market Attractiveness Analysis by Type
  • Figure 40: Latin America Market Value Share and BPS Analysis by Application, 2025 and 2035
  • Figure 41: Latin America Market Y-o-Y Growth Comparison by Application, 2025-2035
  • Figure 42: Latin America Market Attractiveness Analysis by Application
  • Figure 43: Western Europe Market Value Share and BPS Analysis by Country, 2025 and 2035
  • Figure 44: Western Europe Market Value Share and BPS Analysis by Product, 2025 and 2035
  • Figure 45: Western Europe Market Y-o-Y Growth Comparison by Product, 2025-2035
  • Figure 46: Western Europe Market Attractiveness Analysis by Product
  • Figure 47: Western Europe Market Value Share and BPS Analysis by Type, 2025 and 2035
  • Figure 48: Western Europe Market Y-o-Y Growth Comparison by Type, 2025-2035
  • Figure 49: Western Europe Market Attractiveness Analysis by Type
  • Figure 50: Western Europe Market Value Share and BPS Analysis by Application, 2025 and 2035
  • Figure 51: Western Europe Market Y-o-Y Growth Comparison by Application, 2025-2035
  • Figure 52: Western Europe Market Attractiveness Analysis by Application
  • Figure 53: Eastern Europe Market Value Share and BPS Analysis by Country, 2025 and 2035
  • Figure 54: Eastern Europe Market Value Share and BPS Analysis by Product, 2025 and 2035
  • Figure 55: Eastern Europe Market Y-o-Y Growth Comparison by Product, 2025-2035
  • Figure 56: Eastern Europe Market Attractiveness Analysis by Product
  • Figure 57: Eastern Europe Market Value Share and BPS Analysis by Type, 2025 and 2035
  • Figure 58: Eastern Europe Market Y-o-Y Growth Comparison by Type, 2025-2035
  • Figure 59: Eastern Europe Market Attractiveness Analysis by Type
  • Figure 60: Eastern Europe Market Value Share and BPS Analysis by Application, 2025 and 2035
  • Figure 61: Eastern Europe Market Y-o-Y Growth Comparison by Application, 2025-2035
  • Figure 62: Eastern Europe Market Attractiveness Analysis by Application
  • Figure 63: East Asia Market Value Share and BPS Analysis by Country, 2025 and 2035
  • Figure 64: East Asia Market Value Share and BPS Analysis by Product, 2025 and 2035
  • Figure 65: East Asia Market Y-o-Y Growth Comparison by Product, 2025-2035
  • Figure 66: East Asia Market Attractiveness Analysis by Product
  • Figure 67: East Asia Market Value Share and BPS Analysis by Type, 2025 and 2035
  • Figure 68: East Asia Market Y-o-Y Growth Comparison by Type, 2025-2035
  • Figure 69: East Asia Market Attractiveness Analysis by Type
  • Figure 70: East Asia Market Value Share and BPS Analysis by Application, 2025 and 2035
  • Figure 71: East Asia Market Y-o-Y Growth Comparison by Application, 2025-2035
  • Figure 72: East Asia Market Attractiveness Analysis by Application
  • Figure 73: South Asia & Pacific Market Value Share and BPS Analysis by Country, 2025 and 2035
  • Figure 74: South Asia & Pacific Market Value Share and BPS Analysis by Product, 2025 and 2035
  • Figure 75: South Asia & Pacific Market Y-o-Y Growth Comparison by Product, 2025-2035
  • Figure 76: South Asia & Pacific Market Attractiveness Analysis by Product
  • Figure 77: South Asia & Pacific Market Value Share and BPS Analysis by Type, 2025 and 2035
  • Figure 78: South Asia & Pacific Market Y-o-Y Growth Comparison by Type, 2025-2035
  • Figure 79: South Asia & Pacific Market Attractiveness Analysis by Type
  • Figure 80: South Asia & Pacific Market Value Share and BPS Analysis by Application, 2025 and 2035
  • Figure 81: South Asia & Pacific Market Y-o-Y Growth Comparison by Application, 2025-2035
  • Figure 82: South Asia & Pacific Market Attractiveness Analysis by Application
  • Figure 83: Middle East and Africa Market Value Share and BPS Analysis by Country, 2025 and 2035
  • Figure 84: Middle East and Africa Market Value Share and BPS Analysis by Product, 2025 and 2035
  • Figure 85: Middle East and Africa Market Y-o-Y Growth Comparison by Product, 2025-2035
  • Figure 86: Middle East and Africa Market Attractiveness Analysis by Product
  • Figure 87: Middle East and Africa Market Value Share and BPS Analysis by Type, 2025 and 2035
  • Figure 88: Middle East and Africa Market Y-o-Y Growth Comparison by Type, 2025-2035
  • Figure 89: Middle East and Africa Market Attractiveness Analysis by Type
  • Figure 90: Middle East and Africa Market Value Share and BPS Analysis by Application, 2025 and 2035
  • Figure 91: Middle East and Africa Market Y-o-Y Growth Comparison by Application, 2025-2035
  • Figure 92: Middle East and Africa Market Attractiveness Analysis by Application
  • Figure 93: Global Market - Tier Structure Analysis
  • Figure 94: Global Market - Company Share Analysis

Frequently Asked Questions

What is the projected global bucket trucks market size by 2035?

The market is expected to exceed USD 6 billion by 2035.

What is the CAGR of the bucket trucks market from 2025 to 2035?

The market is growing at a CAGR of 14.2% during this period.

Which bucket truck type holds the largest market share in 2025?

Non-insulated trucks hold 55% of the market share in 2025.

What percentage of new bucket trucks use telematics technology?

Approximately 30% of new bucket trucks are equipped with telematics.

Which company holds the largest market share among bucket truck manufacturers?

Altec Inc. holds the leading market share at 24%.

Explore Similar Insights

Future Market Insights

Bucket Trucks Market