Class 6 Trucks Market Size & Share Forecast Outlook 2025 to 2035

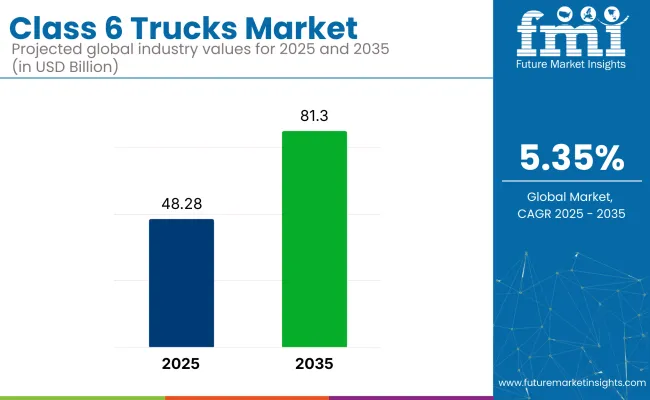
The global Class 6 trucks market is projected to grow from USD 48.28 billion in 2025 to USD 81.3 billion by 2035, registering a CAGR of 5.3% during the forecast period. This growth is being driven by the increasing demand for medium-duty trucks across sectors such as logistics, construction, and distribution. Class 6 trucks are preferred for their ability to carry heavier payloads, making them ideal for urban deliveries and construction applications that require durability, efficiency, and cost-effectiveness.
Class 6 Trucks Market Quick Stats

  • Market Value (2025): USD 48.28 billion
  • Forecast Value (2035): USD 81.3 billion
  • Forecast CAGR: 5.3%
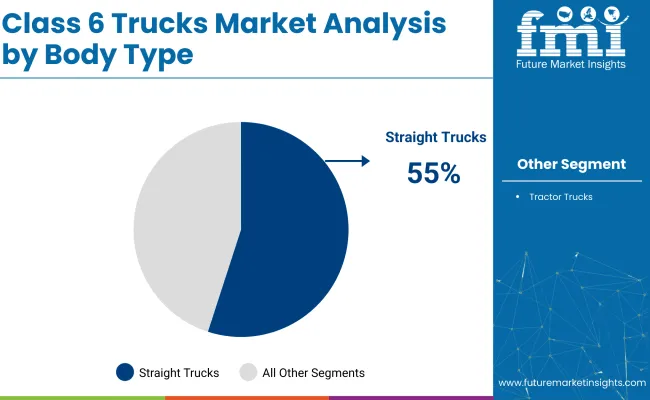
  • Leading Segment in 2025: Straight Trucks (55% share)
  • Key Growth Region: Asia Pacific (India)
  • Top Key Players: Daimler Trucks North America, Volvo Trucks North America, PACCAR Inc., International Inc. (Traton SE), Isuzu Motors Limited

Class 6 Trucks Market

“We see ’24, ’25, ’26 as strong industries in the commercial Class 8 and Class 6-7. We'll see what happens after we hit the '27 emissions. But for right now, when customers are buying and planning, they’ve got to plan on that three-year cycle,” said Jonathan Randall, President of Mack Trucks. This outlook highlights the multi-year purchase cycle for medium-duty trucks and the potential impact of emissions regulations on future purchasing decisions.

The industry is benefiting from the growing demand for commercial vehicles equipped with advanced features such as fuel efficiency and emissions control systems. This demand is being fueled by the rising need for urban mobility solutions and the shift toward greener technologies that meet stricter environmental regulations.

Additionally, the focus on cost-efficient transportation solutions for last-mile deliveries is further pushing the adoption of medium-duty trucks, especially in emerging industries. As the industry evolves, there will be a growing focus on sustainability, fuel efficiency, and smart technologies. These advancements will drive sustained growth, particularly in Asia and India.

Analyzing Class 6 Trucks Market by Top Investment Segments

The Class 6 trucks market is segmented into key investment areas. By body type, the market includes straight trucks and tractor trucks. It is further categorized by fuel type, which includes diesel, electric, and gasoline. The payload capacity segment is divided into up to 10 tonnes, 10-15 tonnes, and 15-20 tonnes.

In terms of application, the industry covers construction, transportation, distribution, and utilities sectors. Geographically, the market spans across North America, Latin America, Western Europe, Eastern Europe, Asia Pacific, the Middle East and Africa, each contributing to the market’s growth and diversification.

Straight Trucks Lead the Class 6 Trucks Market with 55% Market Share in 2025

Straight trucks are expected to dominate the industry by body type, holding 55% of the share in 2025.
Class 6 Trucks Market Analysis By Body Type

  • Companies like International Trucks and Freightliner are heavily investing in the development of advanced straight trucks, enhancing durability, fuel efficiency, and load capacity.
  • Demand for straight trucks is driven by their versatility across various industries, especially in construction and distribution. Their ability to handle various types of cargo, coupled with rising demand for urban delivery services, makes straight trucks a key segment in the industry.

Diesel-Powered Trucks to Capture 70% Market Share in 2025

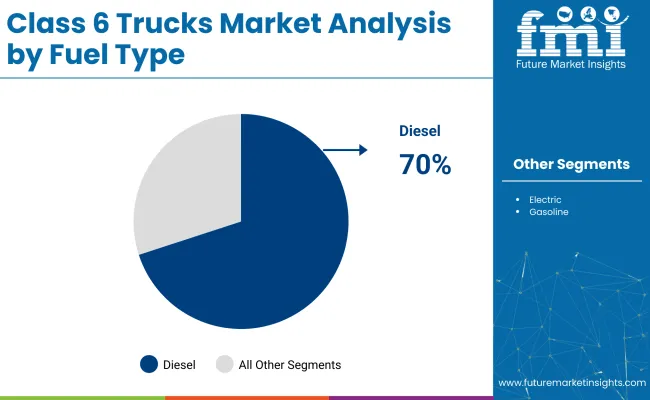
Diesel is projected to capture 70% of the industry share in the Class 6 truck segment by fuel type in 2025.
Class 6 Trucks Market Analysis By Fuel Type

  • Diesel engines are favored for their higher fuel efficiency, long-term durability, and robust performance in heavy-duty applications. Major manufacturers like Cummins and Caterpillar continue to innovate diesel engine technology, ensuring compliance with stringent emission regulations while improving power output and fuel economy.
  • Diesel-powered Class 6 trucks are essential in industries like construction, logistics, and waste management, where heavy load capacity and long-distance performance are critical. The increasing demand for diesel engines in commercial vehicles is expected to drive their continued dominance in this segment.

10-15 Tonnes Payload Capacity Segment to Hold 40% Industry Share in 2025

The 10-15 tonnes payload capacity segment is expected to capture 40% of the industry share by 2025.

  • Trucks in this category are widely used in industries requiring moderate to heavy cargo transport, such as construction, distribution, and urban logistics. Companies like Volvo and Isuzu are designing trucks that can efficiently handle 10-15 tonnes of payload while optimizing fuel efficiency and performance.
  • Growth in demand for medium-duty trucks that can transport a variety of goods, from construction materials to machinery, is expected to maintain the strength of this segment in the industry.

Construction to Drive Class 6 Trucks Market with 40% Share in 2025

The construction application segment is expected to hold a 40% industry share in 2025.

  • Class 6 trucks are vital in construction for transporting building materials, equipment, and debris. Their robust design and strong payload capacity make them ideal for construction site operations. Manufacturers such as Kenworth and Peterbilt are continually enhancing their trucks to meet the growing demand for construction applications, focusing on improving load handling and off-road performance.
  • Expansion of construction activities globally, particularly in developing countries, is expected to drive the need for Class 6 trucks in the sector. Furthermore, the adoption of new technologies in construction trucks, such as GPS tracking and automated safety features, is expected to boost their usage in the industry.

Top Class 6 Trucks Market Dynamics

The industry is being driven by rising demand in freight delivery, construction, and utility services. Technological advancements and e-commerce growth support expansion, while high production costs and regulations limit growth.

Increasing demand across various sectors is driving industry growth

The demand for Class 6 trucks is being significantly boosted by their versatility across a wide range of industries. In the freight delivery sector, they are being preferred for their ability to navigate urban environments and efficiently handle last-mile deliveries.

The construction industry is adopting Class 6 trucks to transport materials and equipment to job sites, benefiting from their maneuverability and payload capacity. Utility services are increasingly using these trucks for maintenance and service operations due to their adaptability and reliability. The diverse adoption of Class 6 trucks in these sectors is driving substantial industry growth.

High production costs and regulatory complexities are limiting industry growth.

Despite strong growth prospects, the industry is facing challenges related to high production costs and regulatory complexities. The integration of advanced technologies and the use of specialized materials in truck manufacturing are raising production expenses, which could deter smaller companies from investing in these vehicles.

Additionally, stringent environmental regulations and safety standards are imposing compliance costs, further increasing operational expenses. These factors are limiting the accessibility of Class 6 trucks, especially in emerging industries, and may slow down the pace of industry expansion. Overcoming these challenges is essential for continued growth.

Analyzing Top Countries Manufacturing, Distributing, and Supplying Class 6 Trucks

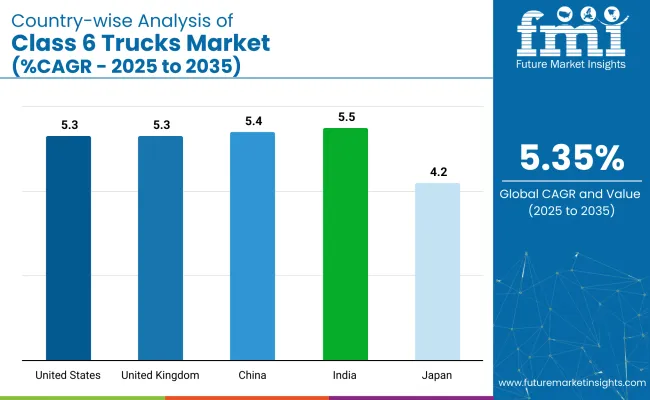
The industry will grow steadily through 2035, driven by rising logistics demand, industrial expansion in China and India, and innovation and sustainability focus in the United States and the United Kingdom.
Country Wise Analysis Of Class 6 Trucks Market

Countries CAGR (2025 to 2035)
United States 5.3%
United Kingdom 5.3%
China 5.4%
India 5.5%
Japan 4.2%

United States Class 6 Trucks Market Driven by E-Commerce and Infrastructure

The United States industry is projected to grow at a CAGR of 5.3% through 2035.

  • Growth is driven by the increasing demand for last-mile delivery services fueled by e-commerce expansion. Leading manufacturers like Ford, Freightliner, and Isuzu are focusing on fuel-efficient and electric Class 6 trucks to meet sustainability goals.
  • Government regulations promoting infrastructure development and clean transportation solutions further support the industry’s growth. The growing emphasis on reducing emissions and improving vehicle performance is contributing to industry innovation. Additionally, advancements in telematics and automation technologies are enhancing operational efficiency in the USA industry.

United Kingdom Class 6 Trucks Market Focused on Urban Mobility and Sustainability

The United Kingdom industry is projected to grow at a CAGR of 5.3% through 2035.

  • Growth is being supported by the increasing demand for efficient and sustainable transportation solutions in urban areas. The adoption of electric and hybrid Class 6 trucks is gaining momentum, with manufacturers like Volvo and Mercedes-Benz leading the way in developing advanced vehicles.
  • Government incentives for low-emission transportation and urban mobility initiatives are fueling industry demand. Technological innovations in logistics and automated systems are further driving the adoption of Class 6 trucks in urban and metropolitan regions.

China Class 6 Trucks Market Expanding with Industrial Growth and Urbanization

The industry in China is projected to grow at a CAGR of 5.4% through 2035.

  • Rapid industrialization and growing urbanization are driving demand for Class 6 trucks in sectors such as construction, logistics, and e-commerce. Leading manufacturers like Dongfeng Motor, FAW, and Beiqi Foton are increasing production capacities to meet industry demand.
  • Government policies promoting infrastructure development and environmental sustainability are supporting the adoption of Class 6 trucks. The shift toward electric vehicles and alternative fuel solutions in China is also contributing to the growing market share of eco-friendly trucks in the country.

India Class 6 Trucks Market Expanding with Infrastructure Development and E-Commerce

The industry in India is expected to grow at a CAGR of 5.5% through 2035.

  • Growth is driven by infrastructure development, increasing demand for last-mile delivery solutions, and the rise of e-commerce. Local manufacturers like Tata Motors and Ashok Leyland are expanding production capacities to meet the demand for heavy-duty vehicles.
  • Government initiatives promoting smart cities and sustainable transportation solutions contribute to industry growth. The rise in urbanization, coupled with improving logistics infrastructure, is further accelerating the adoption of Class 6 trucks. The government’s focus on clean energy and emission standards is enhancing industry growth.

Japan Class 6 Trucks Market Driven by Technological Advancements and Environmental Regulations

The industry in Japan is expected to grow at a CAGR of 4.2% through 2035.

  • Growth is being supported by the adoption of advanced technologies such as electric and autonomous trucks, as well as stringent environmental regulations. Companies like Isuzu, Hino Motors, and Mitsubishi Fuso are investing in fuel-efficient and low-emission vehicles to meet the growing demand for sustainable transportation solutions.
  • Government policies further bolster the industry, supporting green technologies and clean transportation solutions. Demand is also being driven by advancements in telematics and vehicle tracking systems, enhancing efficiency and safety in logistics and distribution.

Leading Class 6 Truck Market Suppliers

Prominent players like Daimler Trucks North America, Volvo Trucks North America, PACCAR Inc., and International Inc. (Traton SE) dominate the industry due to their extensive product portfolios, technological advancements, and strong global presence in the heavy-duty truck sector.

Key suppliers such as Isuzu Motors Limited, Hino Motors, and Mitsubishi Fuso focus on specialized industries, offering innovative and sustainable packaging solutions tailored to the unique requirements of Class 6 trucks. Emerging companies like Bharat Benz, Tata Motors, and Ashok Leyland target regional industries with cost-effective and niche product offerings, catering to specific consumer needs and preferences.
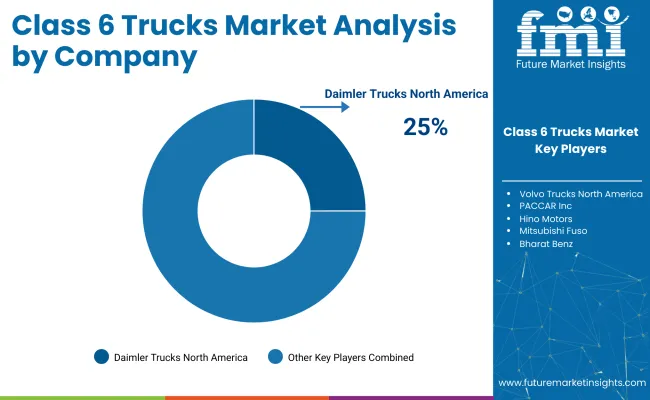
Class 6 Trucks Market Analysis By Company

Recent Class 6 Truck Industry News

  • In April 2025, Ballard Power Systems partnered with Forsee Power and Linamar Corporation to develop a Class 6 hydrogen fuel cell electric truck for the USA industry, focusing on advancing zero-emission technology in medium-duty transportation.
  • In September 2024, Battle Motors launched the Striker, a non-CDL Class 6 truck designed to provide enhanced durability, safety, and comfort, catering to urban and vocational applications.
  • In May 2024, Isuzu teamed up with Cummins to launch a new range of Class 6 trucks in North America, combining Isuzu's truck design with Cummins' advanced powertrains to meet the growing demand for medium-duty vehicles.

Key Players

  • Daimler Trucks North America
  • Volvo Trucks North America
  • PACCAR Inc.
  • International Inc. (Traton SE)
  • Isuzu Motors Limited
  • Hino Motors
  • Mitsubishi Fuso
  • Bharat Benz
  • Tata Motors
  • Ashok Leyland

Research Coverage and Scope Summary

Report Attributes Details
Current Total Market Size (2025) USD 48.28 billion
Projected Market Size (2035) USD 81.3 billion
CAGR (2025 to 2035) 5.3%
Base Year for Estimation 2024
Historical Period 2020 to 2024
Projections Period 2025 to 2035
Quantitative Units USD billion for value, million units for volume
Body Types Analyzed (Segment 1) Straight Trucks; Tractor Trucks
Fuel Types Analyzed (Segment 2) Diesel; Electric; Gasoline
Payload Capacities Analyzed (Segment 3) Up to 10 tonnes; 10-15 tonnes; 15-20 tonnes
Applications Covered (Segment 4) Construction; Transportation; Distribution; Utilities
Regions Covered North America, Latin America, Western Europe, Eastern Europe, Asia Pacific, the Middle East and Africa
Countries Covered United States, Canada, Brazil, Mexico, Argentina, United Kingdom, Germany, France, Italy, Spain, Russia, Poland, Romania, China, India, Japan, South Korea, Australia, Saudi Arabia, UAE, South Africa, Egypt, Turkey
Key Players Influencing the Industry Daimler Trucks North America; Volvo Trucks North America; PACCAR Inc.; International Inc. (Traton SE); Isuzu Motors Limited; Hino Motors; Mitsubishi Fuso; Bharat Benz; Tata Motors; Ashok Leyland
Additional Attributes Dollar sales by body type (straight trucks vs tractor trucks); Growth in electric truck adoption; Regional demand for diesel vs electric trucks; Technological advancements in fuel efficiency; Trends in truck applications for construction, transportation, and distribution

Key Segments

By Body Type:

The industry is segmented into straight trucks and tractor trucks.

By Fuel Type:

The industry includes diesel, electric, and gasoline fuel types.

By Payload Capacity:

The industry is categorized into up to 10 tonnes, 10-15 tonnes, and 15-20 tonnes payload capacities.

By Application:

The industry covers construction, transportation, distribution, and utilities applications.

By Region:

The industry spans North America, Latin America, Western Europe, Eastern Europe, Asia Pacific, and the Middle East and Africa.

Table of Content

  1. Executive Summary
  2. Market Overview
  3. Market Background
  4. Global Market Analysis 2020 to 2024 and Forecast, 2025 to 2035
  5. Global Market Pricing Analysis 2020 to 2024 and Forecast 2025 to 2035
  6. Global Market Analysis 2020 to 2024 and Forecast 2025 to 2035, By Body Type
    • Straight Trucks
    • Tractor Trucks
  7. Global Market Analysis 2020 to 2024 and Forecast 2025 to 2035, By Fuel Type
    • Diesel
    • Electric
    • Gasoline
  8. Global Market Analysis 2020 to 2024 and Forecast 2025 to 2035, By Payload Capacity
    • 10 Tonnes
    • 10-15 Tonnes
    • 15-20 Tonnes
  9. Global Market Analysis 2020 to 2024 and Forecast 2025 to 2035, By Application
    • Construction
    • Transportation
    • Distribution
    • Utilities
  10. Global Market Analysis 2020 to 2024 and Forecast 2025 to 2035, By Region
    • North America
    • Latin America
    • Western Europe
    • Eastern Europe
    • East Asia
    • South Asia & Pacific
    • Middle East and Africa
  11. North America Market Analysis 2020 to 2024 and Forecast 2025 to 2035, By Country
  12. Latin America Market Analysis 2020 to 2024 and Forecast 2025 to 2035, By Country
  13. Western Europe Market Analysis 2020 to 2024 and Forecast 2025 to 2035, By Country
  14. Eastern Europe Market Analysis 2020 to 2024 and Forecast 2025 to 2035, By Country
  15. East Asia Market Analysis 2020 to 2024 and Forecast 2025 to 2035, By Country
  16. South Asia & Pacific Market Analysis 2020 to 2024 and Forecast 2025 to 2035, By Country
  17. Middle East and Africa Market Analysis 2020 to 2024 and Forecast 2025 to 2035, By Country
  18. Key Countries Market Analysis
  19. Market Structure Analysis
  20. Competition Analysis
    • Daimler Trucks North America
    • PACCAR Inc.
    • Volvo Trucks North America
    • International Inc. (Traton SE)
    • International Inc. (Traton SE)
    • Hino Motors
    • Hino Motors
    • Bharat Benz
    • Tata Motors
    • Ashok Leyland
  21. Assumptions & Acronyms Used
  22. Research Methodology

List of Tables

  • Table 1: Global Market Value (USD Billion) Forecast by Region, 2020 to 2035
  • Table 2: Global Market Volume (Million units) Forecast by Region, 2020 to 2035
  • Table 3: Global Market Value (USD Billion) Forecast by Body Type, 2020 to 2035
  • Table 4: Global Market Volume (Million units) Forecast by Body Type, 2020 to 2035
  • Table 5: Global Market Value (USD Billion) Forecast by Fuel Type, 2020 to 2035
  • Table 6: Global Market Volume (Million units) Forecast by Fuel Type, 2020 to 2035
  • Table 7: Global Market Value (USD Billion) Forecast by Payload Capacity, 2020 to 2035
  • Table 8: Global Market Volume (Million units) Forecast by Payload Capacity, 2020 to 2035
  • Table 9: Global Market Value (USD Billion) Forecast by Application, 2020 to 2035
  • Table 10: Global Market Volume (Million units) Forecast by Application, 2020 to 2035
  • Table 11: North America Market Value (USD Billion) Forecast by Country, 2020 to 2035
  • Table 12: North America Market Volume (Million units) Forecast by Country, 2020 to 2035
  • Table 13: North America Market Value (USD Billion) Forecast by Body Type, 2020 to 2035
  • Table 14: North America Market Volume (Million units) Forecast by Body Type, 2020 to 2035
  • Table 15: North America Market Value (USD Billion) Forecast by Fuel Type, 2020 to 2035
  • Table 16: North America Market Volume (Million units) Forecast by Fuel Type, 2020 to 2035
  • Table 17: North America Market Value (USD Billion) Forecast by Payload Capacity, 2020 to 2035
  • Table 18: North America Market Volume (Million units) Forecast by Payload Capacity, 2020 to 2035
  • Table 19: North America Market Value (USD Billion) Forecast by Application, 2020 to 2035
  • Table 20: North America Market Volume (Million units) Forecast by Application, 2020 to 2035
  • Table 21: Latin America Market Value (USD Billion) Forecast by Country, 2020 to 2035
  • Table 22: Latin America Market Volume (Million units) Forecast by Country, 2020 to 2035
  • Table 23: Latin America Market Value (USD Billion) Forecast by Body Type, 2020 to 2035
  • Table 24: Latin America Market Volume (Million units) Forecast by Body Type, 2020 to 2035
  • Table 25: Latin America Market Value (USD Billion) Forecast by Fuel Type, 2020 to 2035
  • Table 26: Latin America Market Volume (Million units) Forecast by Fuel Type, 2020 to 2035
  • Table 27: Latin America Market Value (USD Billion) Forecast by Payload Capacity, 2020 to 2035
  • Table 28: Latin America Market Volume (Million units) Forecast by Payload Capacity, 2020 to 2035
  • Table 29: Latin America Market Value (USD Billion) Forecast by Application, 2020 to 2035
  • Table 30: Latin America Market Volume (Million units) Forecast by Application, 2020 to 2035
  • Table 31: Western Europe Market Value (USD Billion) Forecast by Country, 2020 to 2035
  • Table 32: Western Europe Market Volume (Million units) Forecast by Country, 2020 to 2035
  • Table 33: Western Europe Market Value (USD Billion) Forecast by Body Type, 2020 to 2035
  • Table 34: Western Europe Market Volume (Million units) Forecast by Body Type, 2020 to 2035
  • Table 35: Western Europe Market Value (USD Billion) Forecast by Fuel Type, 2020 to 2035
  • Table 36: Western Europe Market Volume (Million units) Forecast by Fuel Type, 2020 to 2035
  • Table 37: Western Europe Market Value (USD Billion) Forecast by Payload Capacity, 2020 to 2035
  • Table 38: Western Europe Market Volume (Million units) Forecast by Payload Capacity, 2020 to 2035
  • Table 39: Western Europe Market Value (USD Billion) Forecast by Application, 2020 to 2035
  • Table 40: Western Europe Market Volume (Million units) Forecast by Application, 2020 to 2035
  • Table 41: Eastern Europe Market Value (USD Billion) Forecast by Country, 2020 to 2035
  • Table 42: Eastern Europe Market Volume (Million units) Forecast by Country, 2020 to 2035
  • Table 43: Eastern Europe Market Value (USD Billion) Forecast by Body Type, 2020 to 2035
  • Table 44: Eastern Europe Market Volume (Million units) Forecast by Body Type, 2020 to 2035
  • Table 45: Eastern Europe Market Value (USD Billion) Forecast by Fuel Type, 2020 to 2035
  • Table 46: Eastern Europe Market Volume (Million units) Forecast by Fuel Type, 2020 to 2035
  • Table 47: Eastern Europe Market Value (USD Billion) Forecast by Payload Capacity, 2020 to 2035
  • Table 48: Eastern Europe Market Volume (Million units) Forecast by Payload Capacity, 2020 to 2035
  • Table 49: Eastern Europe Market Value (USD Billion) Forecast by Application, 2020 to 2035
  • Table 50: Eastern Europe Market Volume (Million units) Forecast by Application, 2020 to 2035
  • Table 51: East Asia Market Value (USD Billion) Forecast by Country, 2020 to 2035
  • Table 52: East Asia Market Volume (Million units) Forecast by Country, 2020 to 2035
  • Table 53: East Asia Market Value (USD Billion) Forecast by Body Type, 2020 to 2035
  • Table 54: East Asia Market Volume (Million units) Forecast by Body Type, 2020 to 2035
  • Table 55: East Asia Market Value (USD Billion) Forecast by Fuel Type, 2020 to 2035
  • Table 56: East Asia Market Volume (Million units) Forecast by Fuel Type, 2020 to 2035
  • Table 57: East Asia Market Value (USD Billion) Forecast by Payload Capacity, 2020 to 2035
  • Table 58: East Asia Market Volume (Million units) Forecast by Payload Capacity, 2020 to 2035
  • Table 59: East Asia Market Value (USD Billion) Forecast by Application, 2020 to 2035
  • Table 60: East Asia Market Volume (Million units) Forecast by Application, 2020 to 2035
  • Table 61: South Asia & Pacific Market Value (USD Billion) Forecast by Country, 2020 to 2035
  • Table 62: South Asia & Pacific Market Volume (Million units) Forecast by Country, 2020 to 2035
  • Table 63: South Asia & Pacific Market Value (USD Billion) Forecast by Body Type, 2020 to 2035
  • Table 64: South Asia & Pacific Market Volume (Million units) Forecast by Body Type, 2020 to 2035
  • Table 65: South Asia & Pacific Market Value (USD Billion) Forecast by Fuel Type, 2020 to 2035
  • Table 66: South Asia & Pacific Market Volume (Million units) Forecast by Fuel Type, 2020 to 2035
  • Table 67: South Asia & Pacific Market Value (USD Billion) Forecast by Payload Capacity, 2020 to 2035
  • Table 68: South Asia & Pacific Market Volume (Million units) Forecast by Payload Capacity, 2020 to 2035
  • Table 69: South Asia & Pacific Market Value (USD Billion) Forecast by Application, 2020 to 2035
  • Table 70: South Asia & Pacific Market Volume (Million units) Forecast by Application, 2020 to 2035
  • Table 71: Middle East and Africa Market Value (USD Billion) Forecast by Country, 2020 to 2035
  • Table 72: Middle East and Africa Market Volume (Million units) Forecast by Country, 2020 to 2035
  • Table 73: Middle East and Africa Market Value (USD Billion) Forecast by Body Type, 2020 to 2035
  • Table 74: Middle East and Africa Market Volume (Million units) Forecast by Body Type, 2020 to 2035
  • Table 75: Middle East and Africa Market Value (USD Billion) Forecast by Fuel Type, 2020 to 2035
  • Table 76: Middle East and Africa Market Volume (Million units) Forecast by Fuel Type, 2020 to 2035
  • Table 77: Middle East and Africa Market Value (USD Billion) Forecast by Payload Capacity, 2020 to 2035
  • Table 78: Middle East and Africa Market Volume (Million units) Forecast by Payload Capacity, 2020 to 2035
  • Table 79: Middle East and Africa Market Value (USD Billion) Forecast by Application, 2020 to 2035
  • Table 80: Middle East and Africa Market Volume (Million units) Forecast by Application, 2020 to 2035

List of Figures

  • Figure 1: Global Market Volume (Million units) Forecast 2020 to 2035
  • Figure 2: Global Market Pricing Analysis
  • Figure 3: Global Market Value (USD Billion) Forecast 2020 to 2035
  • Figure 4: Global Market Value Share and BPS Analysis by Body Type, 2025 and 2035
  • Figure 5: Global Market Y-o-Y Growth Comparison by Body Type, 2025 to 2035
  • Figure 6: Global Market Attractiveness Analysis by Body Type
  • Figure 7: Global Market Value Share and BPS Analysis by Fuel Type, 2025 and 2035
  • Figure 8: Global Market Y-o-Y Growth Comparison by Fuel Type, 2025 to 2035
  • Figure 9: Global Market Attractiveness Analysis by Fuel Type
  • Figure 10: Global Market Value Share and BPS Analysis by Payload Capacity, 2025 and 2035
  • Figure 11: Global Market Y-o-Y Growth Comparison by Payload Capacity, 2025 to 2035
  • Figure 12: Global Market Attractiveness Analysis by Payload Capacity
  • Figure 13: Global Market Value Share and BPS Analysis by Application, 2025 and 2035
  • Figure 14: Global Market Y-o-Y Growth Comparison by Application, 2025 to 2035
  • Figure 15: Global Market Attractiveness Analysis by Application
  • Figure 16: Global Market Value (USD Billion) Share and BPS Analysis by Region, 2025 and 2035
  • Figure 17: Global Market Y-o-Y Growth Comparison by Region, 2025 to 2035
  • Figure 18: Global Market Attractiveness Analysis by Region
  • Figure 19: North America Market Incremental USD Opportunity, 2025 to 2035
  • Figure 20: Latin America Market Incremental USD Opportunity, 2025 to 2035
  • Figure 21: Western Europe Market Incremental USD Opportunity, 2025 to 2035
  • Figure 22: Eastern Europe Market Incremental USD Opportunity, 2025 to 2035
  • Figure 23: East Asia Market Incremental USD Opportunity, 2025 to 2035
  • Figure 24: South Asia & Pacific Market Incremental USD Opportunity, 2025 to 2035
  • Figure 25: Middle East and Africa Market Incremental USD Opportunity, 2025 to 2035
  • Figure 26: North America Market Value Share and BPS Analysis by Country, 2025 and 2035
  • Figure 27: North America Market Value Share and BPS Analysis by Body Type, 2025 and 2035
  • Figure 28: North America Market Y-o-Y Growth Comparison by Body Type, 2025 to 2035
  • Figure 29: North America Market Attractiveness Analysis by Body Type
  • Figure 30: North America Market Value Share and BPS Analysis by Fuel Type, 2025 and 2035
  • Figure 31: North America Market Y-o-Y Growth Comparison by Fuel Type, 2025 to 2035
  • Figure 32: North America Market Attractiveness Analysis by Fuel Type
  • Figure 33: North America Market Value Share and BPS Analysis by Payload Capacity, 2025 and 2035
  • Figure 34: North America Market Y-o-Y Growth Comparison by Payload Capacity, 2025 to 2035
  • Figure 35: North America Market Attractiveness Analysis by Payload Capacity
  • Figure 36: North America Market Value Share and BPS Analysis by Application, 2025 and 2035
  • Figure 37: North America Market Y-o-Y Growth Comparison by Application, 2025 to 2035
  • Figure 38: North America Market Attractiveness Analysis by Application
  • Figure 39: Latin America Market Value Share and BPS Analysis by Country, 2025 and 2035
  • Figure 40: Latin America Market Value Share and BPS Analysis by Body Type, 2025 and 2035
  • Figure 41: Latin America Market Y-o-Y Growth Comparison by Body Type, 2025 to 2035
  • Figure 42: Latin America Market Attractiveness Analysis by Body Type
  • Figure 43: Latin America Market Value Share and BPS Analysis by Fuel Type, 2025 and 2035
  • Figure 44: Latin America Market Y-o-Y Growth Comparison by Fuel Type, 2025 to 2035
  • Figure 45: Latin America Market Attractiveness Analysis by Fuel Type
  • Figure 46: Latin America Market Value Share and BPS Analysis by Payload Capacity, 2025 and 2035
  • Figure 47: Latin America Market Y-o-Y Growth Comparison by Payload Capacity, 2025 to 2035
  • Figure 48: Latin America Market Attractiveness Analysis by Payload Capacity
  • Figure 49: Latin America Market Value Share and BPS Analysis by Application, 2025 and 2035
  • Figure 50: Latin America Market Y-o-Y Growth Comparison by Application, 2025 to 2035
  • Figure 51: Latin America Market Attractiveness Analysis by Application
  • Figure 52: Western Europe Market Value Share and BPS Analysis by Country, 2025 and 2035
  • Figure 53: Western Europe Market Value Share and BPS Analysis by Body Type, 2025 and 2035
  • Figure 54: Western Europe Market Y-o-Y Growth Comparison by Body Type, 2025 to 2035
  • Figure 55: Western Europe Market Attractiveness Analysis by Body Type
  • Figure 56: Western Europe Market Value Share and BPS Analysis by Fuel Type, 2025 and 2035
  • Figure 57: Western Europe Market Y-o-Y Growth Comparison by Fuel Type, 2025 to 2035
  • Figure 58: Western Europe Market Attractiveness Analysis by Fuel Type
  • Figure 59: Western Europe Market Value Share and BPS Analysis by Payload Capacity, 2025 and 2035
  • Figure 60: Western Europe Market Y-o-Y Growth Comparison by Payload Capacity, 2025 to 2035
  • Figure 61: Western Europe Market Attractiveness Analysis by Payload Capacity
  • Figure 62: Western Europe Market Value Share and BPS Analysis by Application, 2025 and 2035
  • Figure 63: Western Europe Market Y-o-Y Growth Comparison by Application, 2025 to 2035
  • Figure 64: Western Europe Market Attractiveness Analysis by Application
  • Figure 65: Eastern Europe Market Value Share and BPS Analysis by Country, 2025 and 2035
  • Figure 66: Eastern Europe Market Value Share and BPS Analysis by Body Type, 2025 and 2035
  • Figure 67: Eastern Europe Market Y-o-Y Growth Comparison by Body Type, 2025 to 2035
  • Figure 68: Eastern Europe Market Attractiveness Analysis by Body Type
  • Figure 69: Eastern Europe Market Value Share and BPS Analysis by Fuel Type, 2025 and 2035
  • Figure 70: Eastern Europe Market Y-o-Y Growth Comparison by Fuel Type, 2025 to 2035
  • Figure 71: Eastern Europe Market Attractiveness Analysis by Fuel Type
  • Figure 72: Eastern Europe Market Value Share and BPS Analysis by Payload Capacity, 2025 and 2035
  • Figure 73: Eastern Europe Market Y-o-Y Growth Comparison by Payload Capacity, 2025 to 2035
  • Figure 74: Eastern Europe Market Attractiveness Analysis by Payload Capacity
  • Figure 75: Eastern Europe Market Value Share and BPS Analysis by Application, 2025 and 2035
  • Figure 76: Eastern Europe Market Y-o-Y Growth Comparison by Application, 2025 to 2035
  • Figure 77: Eastern Europe Market Attractiveness Analysis by Application
  • Figure 78: East Asia Market Value Share and BPS Analysis by Country, 2025 and 2035
  • Figure 79: East Asia Market Value Share and BPS Analysis by Body Type, 2025 and 2035
  • Figure 80: East Asia Market Y-o-Y Growth Comparison by Body Type, 2025 to 2035
  • Figure 81: East Asia Market Attractiveness Analysis by Body Type
  • Figure 82: East Asia Market Value Share and BPS Analysis by Fuel Type, 2025 and 2035
  • Figure 83: East Asia Market Y-o-Y Growth Comparison by Fuel Type, 2025 to 2035
  • Figure 84: East Asia Market Attractiveness Analysis by Fuel Type
  • Figure 85: East Asia Market Value Share and BPS Analysis by Payload Capacity, 2025 and 2035
  • Figure 86: East Asia Market Y-o-Y Growth Comparison by Payload Capacity, 2025 to 2035
  • Figure 87: East Asia Market Attractiveness Analysis by Payload Capacity
  • Figure 88: East Asia Market Value Share and BPS Analysis by Application, 2025 and 2035
  • Figure 89: East Asia Market Y-o-Y Growth Comparison by Application, 2025 to 2035
  • Figure 90: East Asia Market Attractiveness Analysis by Application
  • Figure 91: South Asia & Pacific Market Value Share and BPS Analysis by Country, 2025 and 2035
  • Figure 92: South Asia & Pacific Market Value Share and BPS Analysis by Body Type, 2025 and 2035
  • Figure 93: South Asia & Pacific Market Y-o-Y Growth Comparison by Body Type, 2025 to 2035
  • Figure 94: South Asia & Pacific Market Attractiveness Analysis by Body Type
  • Figure 95: South Asia & Pacific Market Value Share and BPS Analysis by Fuel Type, 2025 and 2035
  • Figure 96: South Asia & Pacific Market Y-o-Y Growth Comparison by Fuel Type, 2025 to 2035
  • Figure 97: South Asia & Pacific Market Attractiveness Analysis by Fuel Type
  • Figure 98: South Asia & Pacific Market Value Share and BPS Analysis by Payload Capacity, 2025 and 2035
  • Figure 99: South Asia & Pacific Market Y-o-Y Growth Comparison by Payload Capacity, 2025 to 2035
  • Figure 100: South Asia & Pacific Market Attractiveness Analysis by Payload Capacity
  • Figure 101: South Asia & Pacific Market Value Share and BPS Analysis by Application, 2025 and 2035
  • Figure 102: South Asia & Pacific Market Y-o-Y Growth Comparison by Application, 2025 to 2035
  • Figure 103: South Asia & Pacific Market Attractiveness Analysis by Application
  • Figure 104: Middle East and Africa Market Value Share and BPS Analysis by Country, 2025 and 2035
  • Figure 105: Middle East and Africa Market Value Share and BPS Analysis by Body Type, 2025 and 2035
  • Figure 106: Middle East and Africa Market Y-o-Y Growth Comparison by Body Type, 2025 to 2035
  • Figure 107: Middle East and Africa Market Attractiveness Analysis by Body Type
  • Figure 108: Middle East and Africa Market Value Share and BPS Analysis by Fuel Type, 2025 and 2035
  • Figure 109: Middle East and Africa Market Y-o-Y Growth Comparison by Fuel Type, 2025 to 2035
  • Figure 110: Middle East and Africa Market Attractiveness Analysis by Fuel Type
  • Figure 111: Middle East and Africa Market Value Share and BPS Analysis by Payload Capacity, 2025 and 2035
  • Figure 112: Middle East and Africa Market Y-o-Y Growth Comparison by Payload Capacity, 2025 to 2035
  • Figure 113: Middle East and Africa Market Attractiveness Analysis by Payload Capacity
  • Figure 114: Middle East and Africa Market Value Share and BPS Analysis by Application, 2025 and 2035
  • Figure 115: Middle East and Africa Market Y-o-Y Growth Comparison by Application, 2025 to 2035
  • Figure 116: Middle East and Africa Market Attractiveness Analysis by Application
  • Figure 117: Global Market - Tier Structure Analysis
  • Figure 118: Global Market - Company Share Analysis

Frequently Asked Questions

What is the projected size of the Class 6 trucks market by 2035?

The industry is expected to reach USD 81.3 billion by 2035.

What is the estimated size of the Class 6 trucks market in 2025?

The industry size is projected to be USD 48.28 billion in 2025.

What is the CAGR of the Class 6 trucks market from 2025 to 2035?

The industry is expected to grow at a CAGR of 5.3%.

Which segment of the Class 6 trucks market has the largest market share?

In the fuel type segment, diesel-powered trucks capture 70% market share.

Which country holds the highest CAGR in the Class 6 trucks market?

India is projected to hold the highest CAGR with 5.5%.

Explore Specialty Vehicles Insights

Future Market Insights

Class 6 Trucks Market