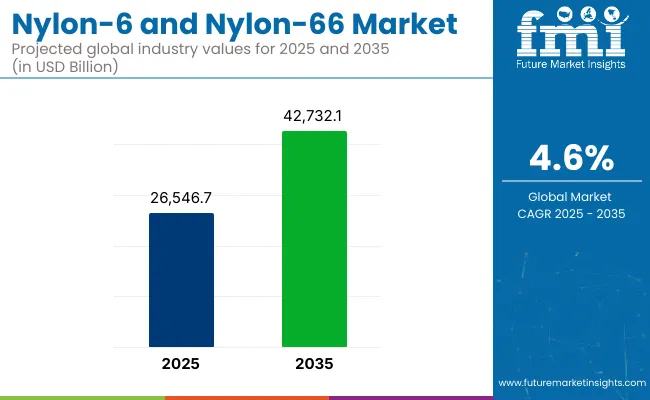
The global nylon-6 and nylon-66 market is expected to reach USD 26,546.7 million in 2025 and is projected to reach USD 42,732.1 million by 2035, growing at a CAGR of 4.6% during the forecast period. Growth is being driven by increasing automotive production, rising use of lightweight polymers, and ongoing material innovation in electrical and consumer industries.

| Metric | Value |
|---|---|
| Market Size in 2025 | USD 26,546.7 million |
| Projected Market Size in 2035 | USD 42,732.1 million |
| CAGR (2025 to 2035) | 4.6% |
In 2024, nylon consumption witnessed a notable uptrend due to a resurgence in automotive manufacturing and growing preference for thermoplastics in under-the-hood components. Countries across Asia Pacific, particularly China and India, reported strong demand for nylon resins in radiator end tanks, engine covers, and air intake manifolds. According to OICA, global vehicle production rose by 5.6% in 2023, reinforcing nylon’s relevance in high-heat and structural applications.
Momentum is building across the market as manufacturers accelerate development of bio-based and recycled nylon alternatives. Sustainability targets and regulatory mandates have prompted major players to invest in renewable feedstocks, depolymerization processes, and closed-loop recycling systems.
Adoption of recycled nylon is gaining traction in packaging, textiles, and automotive applications, particularly as circular economy goals are being embedded into procurement standards. In response, R&D funding and collaborative supply chain models are increasing across North America, Europe, and East Asia.
Specialty grades of nylon-66 with flame retardant and heat-resistant properties are being adopted in the electrical and electronics sectors, especially for connectors, switches, fuse housings, and circuit breaker components. The market is seeing rapid integration of engineered nylons in these segments due to evolving fire safety and insulation performance benchmarks.
Nylon-6 fibers continue to be in high demand across the textile and apparel industry. Manufacturers in Vietnam, Turkey, and Bangladesh are incorporating them into performance sportswear and technical fabrics, supported by their high elasticity, abrasion resistance, and dyeability.
Additional growth is expected from industrial automation and smart manufacturing, where nylon-based gears, bushings, cable ties, and bearings are widely used. Specialty compounding is advancing with glass fiber, mineral fillers, and flame-retardant additives to expand application scope into aerospace, robotics, and precision engineering.

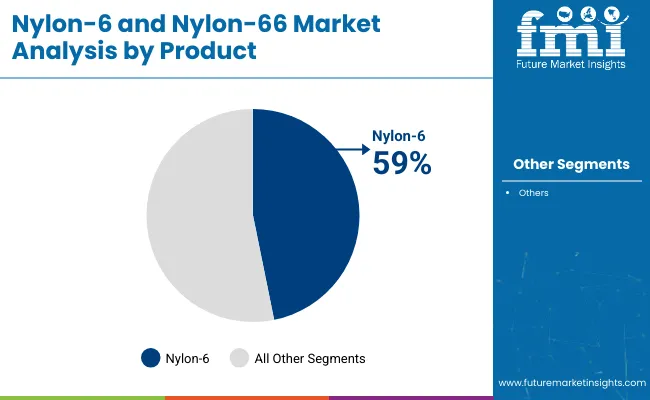
Nylon-6 is anticipated to hold around 59% of the global nylon market share in 2025 and is expected to grow at a CAGR of 4.4% through 2035. Its superior tensile strength, chemical resistance, and dyeability make it well-suited for applications in apparel, carpets, industrial yarns, and flexible food packaging. Rapid urbanization and growing textile demand are driving large-scale production, particularly in China, India, and Southeast Asia.
Advancements in melt compounding and high-speed spinning have enhanced its appeal across diverse industries. Automotive manufacturers are adopting nylon-6 for interior components, while packaging and industrial sectors increasingly rely on it for extrusion films and monofilaments due to its cost-effectiveness and processing efficiency.

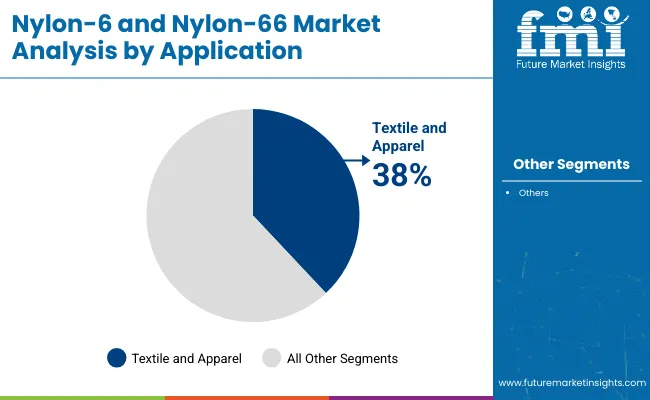
The textile and apparel segment is expected to hold the largest share of the global nylon-6 and nylon-66 market in 2025, accounting for approximately 38% of total demand with CAGR 5.1%. Nylon-6, in particular, is extensively used in synthetic fibers for activewear, hosiery, undergarments, swimwear, and industrial textiles due to its strength, elasticity, and abrasion resistance.
Its excellent dyeability and softness make it a preferred material in high-performance and fashion textiles. Growth in sportswear and technical fabric production, especially across Asia Pacific, is further fueling demand. Nylon-66 is also used in textile applications that require greater durability and heat resistance, particularly in industrial and automotive fabrics.
This study is based on a recent survey of stakeholders in the nylon-6 and nylon-66 value chain, which includes manufacturers, suppliers, and end-user industries, undertaken by Future Market Insights. The results indicate that sustainability and innovation are high on the agenda for most of the respondents, with over 65% identifying the need for bio-based alternatives and circular economy approaches as key trends.
Faced with a raft of stringent environmental policies, particularly in Europe and North America, globally reputable companies are being pressured to shift toward cleaner production and recycled nylon solutions.
With thermal resistance and durability at the forefront, 70% of automotive players favor nylon-66 for EV applications, influencing demand patterns. Meanwhile, the increasing demand for lightweight and breathable fabrics is driving the textile industry's growing adoption of nylon-6 for performance apparel and technical textiles. However, 55% of stakeholders identify supply chain interruptions and price volatility, particularly raw material shortages, as key concerns.
More than 60% of respondents believe that the growth drivers for the future will be 3D printing and polymer blending-with an emphasis on design, product performance, and efficiency. Lower production costs in the Asia-Pacific region, coupled with increasing industrial applications, are key factors driving the industry's projected growth in this area.
| Countries | Key Regulations & Mandatory Certifications |
|---|---|
| United States | There are laws regarding chemicals, such as the TSCA (Toxic Substances Control Act). The EPA (Environmental Protection Agency) sets emissions standards on factories. Many are ISO 14001-certified for environmental management. |
| United Kingdom | Under UK REACH (Registration, Evaluation, Authorization, and Restriction of Chemicals), manufacturers must register chemicals - including nylon intermediates. The Environment Act 2021 provides for stricter control of plastic waste. |
| France | Most notably, Extended Producer Responsibility (EPR) regulations requiring recycling of nylon products, especially within textiles Grenelle II Act brings in sustainability and ecolabeling obligations. NF certification is for industrial materials. |
| Germany | Nylon packaging is subject to recycling compliance requirements under the German Packaging Act (VerpackG). The Blauer Engel (German for “Blue Angel”) eco-label marks nylon as environmentally friendly. DIN EN ISO 9001 specifies quality in production. |
| Italy | Compliance with the EU Green Deal: (i) carbon neutrality and (ii) circular economy values. The UNI 11460 standard is applicable to all sustainable textiles, with direct implications for Fashion and Apparel's nylon-6. |
| South Korea | As K-REACH (Korean REACH) is in line with EU REACH, high chemical registration is required to produce nylon. Material safety KS certification is for industrial use. |
| Japan | Nylon is manufactured from dangerous substances regulated by Chemical Substances Control Law (CSCL). (Japanese Industrial Standards) certification is mandatory for specific applications such as auto and electronics. |
| China | China REACH mandates registering chemicals, which impacts nylon raw material imports. The Plastic Pollution Control Plan (2018 to 2023) reduces the usages of nylon that is not recyclable to packaging and fabrics. In China, Work Group Flow is used to define horizontal manufacturing pieces, whereas CCC (China Compulsory Certification) is requested for nylon applications in electrical and industrial equipment. |
| Australia & New Zealand | Australian Industrial Chemicals Introduction Scheme (AICIS) regulates import and use of chemicals with a basis in nylon. Nylon is regulated in automotive and safety products by AS/NZS standards. |
| India | Nylon products in specific industries are required to obtain a BIS certificate. Plastic Waste Management Rules mandates that more nylon-based products be recycled under the Extended Producer Responsibility (EPR) guidelines. |
Meanwhile, the USA nylon-6 and nylon-66 industry is expected to expand at a CAGR of approximately 4.2% between 2025 and 2035, owing to momentum in automotive, aerospace, and industrial applications.
The growing focus on using light materials in electric and fuel-efficient vehicles is expected to boost the adoption of enhanced engine parts, battery enclosures, and high-performance nylon-66 plastics, such as plates and sheets. In addition, the American textile sector is gradually increasing its usage of nylon-6 in sportswear and functional apparel to meet consumers' demand for durable, moisture-wicking fabric.
The nylon-6 industry is also benefiting from the 3D printing industry, with companies in that sector using nylon-6 for additive manufacturing applications. Increased domestic production and sustainability initiatives will pay dividends in terms of providing long-term stability and growth in the industry.
The UK nylon-6 and nylon-66 industry is projected to grow during 2025 to 2035 at a CAGR of 3.9% on account of sustainability norms and advancements in electrical mobility. Both the target of carbon neutrality by 2050 and the UK REACH program are forcing companies to switch to reusable and bioplastics-based nylon materials.
The automotive industry, especially parts for EV batteries and lightweight thermoplastics, is a key driver for demand. In the UK, the fashion and textile industry is also changing to circular economy thinking, with more recycled nylon entering clothing and accessories.
Although Brexit and trade policy remain uncertain, government incentives for sustainable production methods (especially with regards to climate change) and a rise in collaboration and investment in innovative ideas through R&D mean the UK industry for sustainably sourced nylon is set to grow.
Throughout the next ten years, the industry for nylon-6 and nylon-66 in France is projected to grow steadily at a CAGR of 3.8%. Strict environmental policies in France, particularly Extended Producer Responsibility (EPR) legislation, are pushing for recycling initiatives and bio-based alternatives for nylon production.
Due to its lightweight nature and superior thermal stability, the French car industry heavily relies on this fabric for the production of electric and hybrid cars. In addition, the fashion and textile luxury industry of the country is pushing sustainable material sources, which is increasing the demand for recyclable nylon cloth.
However, issues associated with raw material pricing and stringent EU regulations for chemicals may impact the growth of the industry. It will be expected to build the trend-breaking competitiveness of France on the world industry as continuing investments in clean technologies enable it to streamline expertise for production.
During 2025 to 2035, the Germany nylon-6 & nylon-66 industry would record substantial growth at a CAGR of 4.1%, due to demand for automotive & industrial manufacturing and textiles. Germany remains Europe’s largest automotive industry, with increasing demand for lightweight, high-performance materials such as nylon-66 in EV battery housings, engine compartments, and structural components.
The Nation’s Packaging Act (VerpackG) and Blauer Engel (Blue Angel) environmental label encourage recycling and sustainability in the industry. Also driving nylon demand in Germany is the industry for industrial automation, particularly when it comes to high-precision mechanical components. Investments in innovation in polymer technologies and local recycling projects will sustain growth, despite the industry facing regulatory challenges and the volatility of raw materials.
The Italian nylon-6 and nylon-66 demand is anticipated to grow at a CAGR of 3.7% over the foreseen years, on account of textile, automotive, and packaging industries. Italy’s textile industry is a major consumer of recycled and bio-based nylon at a time when the demand for high-performance textiles that are sustainable is increasing.
Low-carbon nylon manufacturing processes are favoured by the EU Green Deal and circular economy initiatives. The Italian automotive sector, particularly luxury and sports car manufacturing, utilizes nylon-66 for lightweight, high-strength components. The industry is driven by factors such as green manufacturing investments and new polymer blends.
Meanwhile, South Korea's nylon-6 and nylon-66 industry will achieve sales growth at a compound annual growth rate (CAGR) of 4.3% during the assessment timeframe, with help from the electronics, automotive, and industrial sectors. K-REACH regulations mirror EU standards, pushing businesses to make more sustainable and safer nylons.
One significant driver for high-performance nylon materials is the automotive industry, especially the manufacture of electric vehicles. Nylon-66 is also key to the electronics industry, particularly for insulation, connectors, and structural parts. With solid government backing for R&D, South Korea is also emerging as a front runner in high-tech polymer applications.
Demand from the automotive, industrial robot, and textile industries is expected to drive the Japan nylon-6 and nylon-66 industry at a CAGR of 4.0% through 2034. The CSCL ushers in strict chemical safety requirements that affect production and imports.
Japan's automotive industry employs nylon-66 for EV battery casings, lightweight automotive parts, and under-the-hood components. Precision engineering uses nylon components, which further stimulates industry growth in the robotics and automation sector. But the limitations of the supply chain remain a challenge, and investment in progressive recycling and sustainable production supports industry growth.
China's industry for nylon-6 and nylon-66 is expected to register the highest CAGR of 5.2% among major economies, owing to fast industrialization, rising EV production, and favorable textile demand. These systems include the China REACH system and the Plastic Pollution Control Plan (2020 to 2025), which promote recycling and green nylon initiatives.
China has the largest automotive industry in the world, with increasing demand for lighter materials such as nylon in EV manufacturing. The textile industry, especially industrial and sportswear, is another major consumer of nylon-6 fibers. While the country has stringent regulations in place for the environment, continuing government support for local output and circular economy efforts will drive the long-term growth of the industry.
The nylon-6 and nylon-66 industry across Australia and New Zealand is slated to grow at a CAGR of 3.6%, with textiles, automotive, and industrial sectors at the forefront. AICIS has stringent environmental standards and regulates the imports of chemicals.
Regulations aimed at sustainability, including waste-reducing programs and the use of green packaging, are further pushing companies toward recycled nylon. While high-performance engineered plastics dominate demand, the mining and automotive sectors are also fuelling it.
The nylon-6 and nylon-66 segments in India are forecast to register respective CAGRs of 5.0% and are dominated by textiles, automotive, and electronics. The government's Make in India policy is enhancing domestic production in nylon through BIS approvals and EPR regulation, while addressing sustainability and quality concerns.
The demand is driven by rising industrialization and a growing middle class. Despite constraints in infrastructure and raw materials, recycling investment and green production will drive long-term growth.
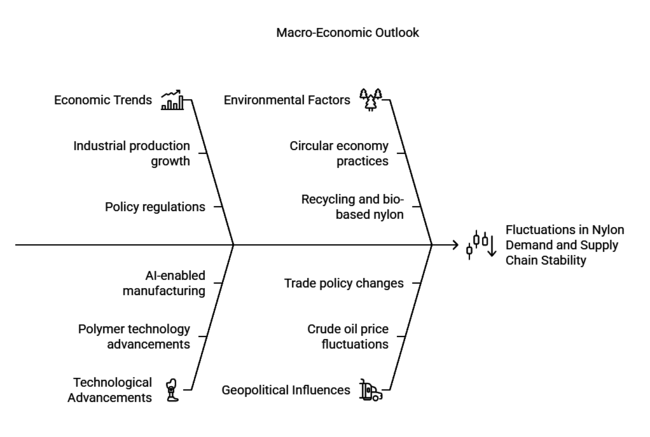
Manufacturing, including engineering plastics and high-performance materials in other applications of Nylon 6 and Nylon 66, accounts for about one-quarter of total demand. It is expected to be grow better due to trends in industrial production, policy regulations, and sustainability programs. One of its biggest consumers, the automotive industry, is turning to lightweight nylon composites to hit emission targets.
This further drives the demand for high-performance insulation products from the growing consumer electronics and electrical applications sectors. However, fluctuations in crude oil prices, international trade policies, and disruptions in the supply chain have altered industry trends and influenced the costs of raw materials and production efficiency.

Growth from 2025 to 2035 will be driven by the increasing adoption of EVs, sustainable raw materials, and advancements in polymer technology. Upstream movement toward a circular economy will push to increase recycling and bio-based nylon penetration, led by regulation in Europe and North America. Owing to industrialization and infrastructure development in China and India, the Asia-Pacific region will have high demand.
Such investment would reduce reliance on raw materials derived from petroleum. Supply chain stability, local production, and AI-enabled manufacturing will improve efficiency and reduce costs. With a strong commitment to sustainability and innovation, nylon-based materials will be integral to the next generation of applications across all industries.
The global nylon market is witnessing intensifying competition as demand grows for high-performance and eco-conscious materials. Industry players are increasingly adopting technological integration and process innovation to enhance efficiency and secure feedstock sources. Significant investments in the production of caprolactam and adipic acid are supporting expanded capacities for nylon-6 and nylon-66.
The drive toward a circular economy is encouraging the development of recycled and bio-based nylon variants, aligning with regulatory and sustainability goals. Meanwhile, rising performance expectations across automotive, electronics, and industrial applications are accelerating the adoption of advanced nylon formulations. These market forces are set to fuel consistent, innovation-led growth through 2035.
The industry is segmented into nylon 6 (PA6) (fiber grade & resin grade) and nylon 66 (PA66) (fiber grade & resin grade)
It is segmented into engineering plastics (automotive, industrial/machinery, electrical and electronics, consumer goods and appliances, packaging/films, wires and cables & others) and fiber (textiles, industrial, carpet, staples and others)
It is fragmented into North America, Latin America, Western Europe, Eastern Europe, Russia and Belarus, Balkan and Baltic Countries, Central Asia, East Asia, South Asia and the Pacific, Middle East and Africa
Increased application in the automotive, electronics, and renewable materials sectors is driving demand.
Companies are investing in bio-based and recycled versions to meet regulatory and consumer demands.
Automotive, EVs, consumer electronics, and industrial use are expanding rapidly.
Regulation, supply chain disruptions, and going from volatile raw material prices to regulation are creating challenges.
Innovations are focused on emerging trends such as 3D printing, AI-based manufacturing, and high-performance composites.


Our Research Products

The "Full Research Suite" delivers actionable market intel, deep dives on markets or technologies, so clients act faster, cut risk, and unlock growth.

The Leaderboard benchmarks and ranks top vendors, classifying them as Established Leaders, Leading Challengers, or Disruptors & Challengers.

Locates where complements amplify value and substitutes erode it, forecasting net impact by horizon

We deliver granular, decision-grade intel: market sizing, 5-year forecasts, pricing, adoption, usage, revenue, and operational KPIs—plus competitor tracking, regulation, and value chains—across 60 countries broadly.

Spot the shifts before they hit your P&L. We track inflection points, adoption curves, pricing moves, and ecosystem plays to show where demand is heading, why it is changing, and what to do next across high-growth markets and disruptive tech

Real-time reads of user behavior. We track shifting priorities, perceptions of today’s and next-gen services, and provider experience, then pace how fast tech moves from trial to adoption, blending buyer, consumer, and channel inputs with social signals (#WhySwitch, #UX).

Partner with our analyst team to build a custom report designed around your business priorities. From analysing market trends to assessing competitors or crafting bespoke datasets, we tailor insights to your needs.
Supplier Intelligence
Discovery & Profiling
Capacity & Footprint
Performance & Risk
Compliance & Governance
Commercial Readiness
Who Supplies Whom
Scorecards & Shortlists
Playbooks & Docs
Category Intelligence
Definition & Scope
Demand & Use Cases
Cost Drivers
Market Structure
Supply Chain Map
Trade & Policy
Operating Norms
Deliverables
Buyer Intelligence
Account Basics
Spend & Scope
Procurement Model
Vendor Requirements
Terms & Policies
Entry Strategy
Pain Points & Triggers
Outputs
Pricing Analysis
Benchmarks
Trends
Should-Cost
Indexation
Landed Cost
Commercial Terms
Deliverables
Brand Analysis
Positioning & Value Prop
Share & Presence
Customer Evidence
Go-to-Market
Digital & Reputation
Compliance & Trust
KPIs & Gaps
Outputs
Full Research Suite comprises of:
Market outlook & trends analysis
Interviews & case studies
Strategic recommendations
Vendor profiles & capabilities analysis
5-year forecasts
8 regions and 60+ country-level data splits
Market segment data splits
12 months of continuous data updates
DELIVERED AS:
PDF EXCEL ONLINE
Android Automotive OS (AAOS) Market Size and Share Forecast Outlook 2025 to 2035
Anderson Cascade Impactor Market Size and Share Forecast Outlook 2025 to 2035
Andersen-Tawil Syndrome Treatment Market Trends - Growth & Future Prospects 2025 to 2035
Andro Supplements Market
Candle Filter Cartridges Market Size and Share Forecast Outlook 2025 to 2035
Handheld Electrostatic Meter Market Size and Share Forecast Outlook 2025 to 2035
Hand Towel Automatic Folding Machine Market Size and Share Forecast Outlook 2025 to 2035
Handheld Ultrasound Scanner Market Size and Share Forecast Outlook 2025 to 2035
Handheld Tagging Gun Market Forecast and Outlook 2025 to 2035
Handheld Imaging Systems Market Size and Share Forecast Outlook 2025 to 2035
Sandwich Panel System Market Size and Share Forecast Outlook 2025 to 2035
Hand Tools Market Size and Share Forecast Outlook 2025 to 2035
Land Survey Equipment Market Size and Share Forecast Outlook 2025 to 2035
Handloom Product Market Size and Share Forecast Outlook 2025 to 2035
Band File Sander Belts Market Size and Share Forecast Outlook 2025 to 2035
Handheld XRF Analyzers Market Size and Share Forecast Outlook 2025 to 2035
Sand Abrasion Tester Market Size and Share Forecast Outlook 2025 to 2035
Sand Testing Equipments Market Size and Share Forecast Outlook 2025 to 2035
Landscape Lighting Market Size and Share Forecast Outlook 2025 to 2035
Handheld Police Radar Guns Market Size and Share Forecast Outlook 2025 to 2035

Thank you!
You will receive an email from our Business Development Manager. Please be sure to check your SPAM/JUNK folder too.
Chat With
MaRIA