Class 4 Truck Market Size, Share, and Forecast Outlook 2025 to 2035

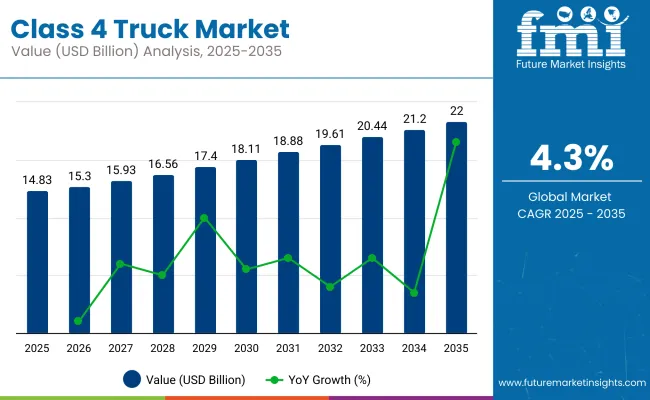
In 2025, the class 4 truck market was valued at USD 14.83 billion and is likely to reach USD 22.54 billion by 2035, registering a CAGR of 4.3%.The rolling CAGR assessment indicates a stable expansion path, influenced by replacement cycles, operational cost efficiency, and compliance with tightening emission norms. From 2025 to 2028, moderate gains are anticipated as logistics operators and municipal service providers invest in newer fleets with enhanced payload capacity and improved fuel efficiency. This period also benefits from early-stage adoption of electric and hybrid Class 4 trucks in high-density commercial routes.

From 2028 to 2031, growth momentum is supported by expanding e-commerce deliveries, regional distribution needs, and the use of Class 4 platforms in last-mile freight operations. The transition to advanced propulsion systems and integration of connected telematics strengthen market positioning. Between 2031 and 2035, steady replacement demand combines with innovations in driver assistance, route optimization, and load management to sustain the rolling CAGR.

The analysis suggests that this market will maintain resilience through operational diversification and technology-driven upgrades, ensuring a consistent role for Class 4 trucks across logistics, retail distribution, and public service applications.
Quick Stats of Class 4 Truck Market

  • Class 4 Truck Market Size (2025): USD 14.83 billion
  • Projected Class 4 Truck Market Size (2035): USD 22.54 billion
  • Forecast CAGR of Class 4 Truck Market (2025 to 2035): 4.3%
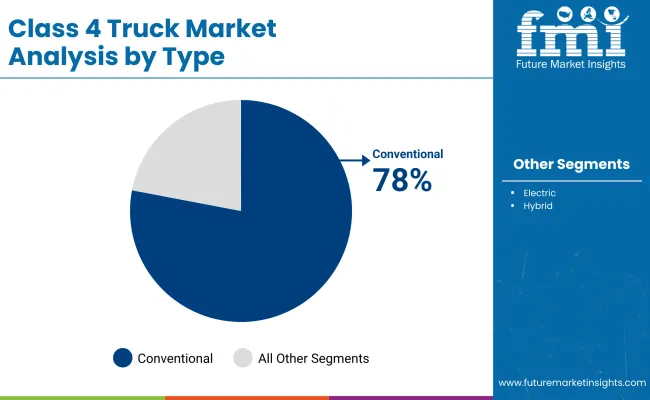
  • Leading Segment of Class 4 Truck Market (2025): Conventional Trucks (78% market share)
  • Key Growth Regions of Class 4 Truck Market: Asia Pacific, North America, Europe
  • Top Key Players of Class 4 Truck Market: Isuzu, Ford, Hino Motors, Freightliner, Mitsubishi Fuso, JAC Motors, Great Wall Motors

Class 4 Truck Market

Metric Value
Industry Size (2025E) USD 14.83 billion
Industry Value (2035F) USD 22.54 billion
CAGR (2025 to 2035) 4.3%

The class 4 truck market accounted for around 33% share within the broader class 4-8 truck category in 2024, driven by demand for mid-range payload capabilities and maneuverability in urban delivery. Diesel-powered variants represented nearly 83% of sales due to fuel availability and operational efficiency, while electric models began gaining share, crossing 5% in select fleets. Freight delivery accounted for about 33% of Class 4 truck usage, supported by e-commerce and regional distribution hubs. Asia Pacific led the market with approximately 46% share, followed by North America with 35%, driven by logistics network expansion and fleet renewal programs.

Electrification and hybrid integration trends have been accelerating due to stricter emissions regulations and urban low-emission zones. Fleet operators have been adopting telematics and AI-enabled route optimization to improve asset utilization and reduce operating costs. OEMs have expanded electric Class 4 offerings, targeting last-mile logistics in dense city areas.

Demand in Asia Pacific has been reinforced by infrastructure investments and cross-border trade routes. North America’s market has been influenced by replacement cycles and advanced driver-assistance system integration. A steady CAGR through 2035 is expected as vehicle technology, powertrain diversity, and fleet automation enhance operational efficiency across industries.

Top Class 4 Truck Market Dynamics

The class 4 truck market has been influenced by procurement patterns within logistics, municipal, and industrial sectors. Trucks in this category, weighing between 14,001 and 16,000 pounds’ gross vehicle weight rating, have been preferred for medium-distance cargo transport due to flexibility and cost efficiency.

Diesel powertrains dominate the market, though hybrid and electric options are increasingly included in public fleet renewals. Regulatory updates in OECD countries have affected vehicle replacement timing, while industrial expansion and infrastructure investments in ASEAN countries have driven market penetration. The rise of e-commerce has also expanded use in last-mile delivery services.

Factors Driving Growth in The Class 4 Truck Segment

The market expansion for class 4 trucks has been supported by investments in infrastructure and efforts to update commercial fleets. In OECD regions, updated safety and emission regulations have encouraged the adoption of trucks that meet newer standards. ASEAN economies have seen demand grow due to new industrial zones and improved freight corridors.

Fleet managers have focused on vehicles that offer better fuel efficiency, improved suspension, and torque optimized for various terrains. Technology integration, including GPS and predictive maintenance, has enhanced route efficiency and fleet utilization. Increased competition in logistics has led to shorter replacement cycles, providing steady demand for class 4 trucks suited to diverse transport needs.

Challenges Affecting the Adoption of Class 4 Trucks

The class 4 truck market has faced challenges related to regulatory compliance and cost management. Advanced safety and emission requirements in OECD countries have increased upfront costs for fleet acquisition. ASEAN markets have been affected by tariffs and uneven access to financing, which have limited purchases by smaller operators. Higher initial investments are required for electric and hybrid trucks, influencing procurement decisions, particularly among budget-constrained buyers.

Maintenance costs for these vehicles have also been higher in regions lacking specialized services. Fuel price volatility impacts diesel fleets’ operational budgets, while insurance costs have risen in certain transport sectors, constraining profit margins and slowing rapid fleet turnover.

Emerging Areas Presenting Potential for Class 4 Trucks

The growth of e-commerce has created new demand channels for class 4 trucks in both OECD and ASEAN countries. These trucks’ size allows for efficient urban deliveries while accommodating adequate payloads for bulk shipments. Retail and distribution centers have implemented dedicated class 4 fleets to improve delivery speed and accuracy. Route optimization technologies have increased efficiency in dense urban networks.

Regulations targeting urban emissions have encouraged hybrid truck adoption. Increased cross-border trade within ASEAN has created opportunities for short-haul international freight. Seasonal variations and just-in-time logistics have supported steady fleet utilization, positioning class 4 trucks as vital to modern logistics chains.

Notable Developments in Truck Technology and Operations

Electrification has progressed steadily in the class 4 truck market due to reduced battery costs and improved charging infrastructure. Public and utility fleets have increased allocation for electric vehicles to meet emission targets. Hybrid trucks remain an alternative for operators seeking fuel savings without range limitations. Telematics use has expanded significantly, enabling real-time monitoring of vehicles and drivers.

Analytics platforms help optimize asset usage and reduce downtime. Collaboration between manufacturers and technology providers has accelerated innovation in connected vehicle systems. Retrofitting older trucks with partial electrification and telematics has become common. These developments have enhanced the adaptability of class 4 trucks in urban and regional freight operations.

Analyzing Class 4 Truck Market by Top Investment Segments

The class 4 truck market in 2025 is shaped by conventional types and diesel powertrains dominating their respective segments. General delivery applications constitute the largest share, driven by urban logistics and last-mile delivery growth. Payload capacity between 12,501 and 14,500 lbs is preferred for operational flexibility. Box trucks lead the body type segment due to their versatility in cargo protection. While electric and hybrid options remain smaller shares, their presence is expanding gradually supported by emission regulations and cost efficiency improvements in key markets.
Conventional Trucks Dominate Class 4 Market with 78% Share

Class 4 Truck Market By Type

Conventional Class 4 trucks hold a dominant 78% market share, favored for reliability and established fueling infrastructure. Leading manufacturers such as Ford, Freightliner, and Isuzu have focused on improving fuel efficiency, driver comfort, and safety systems for these models. Conventional trucks are widely used in urban and regional logistics where durability and maintenance network coverage are priorities. Incremental advances in engine technology and lightweight materials have also extended their market presence despite rising interest in electric alternatives. Fleet operators value the total cost of ownership advantages offered by these conventional powertrains.
  • Ford’s E-Series trucks maintain a strong foothold with over 35% share of Class 4 conventional sales
  • Freightliner expanded its M2 106 model with enhanced aerodynamics reducing fuel consumption by 4%
  • Isuzu’s NPR conventional trucks are among top choices in US and Canadian delivery fleets

General Delivery is the Leading Application with 46% Market Share

Class 4 Truck Market By Application

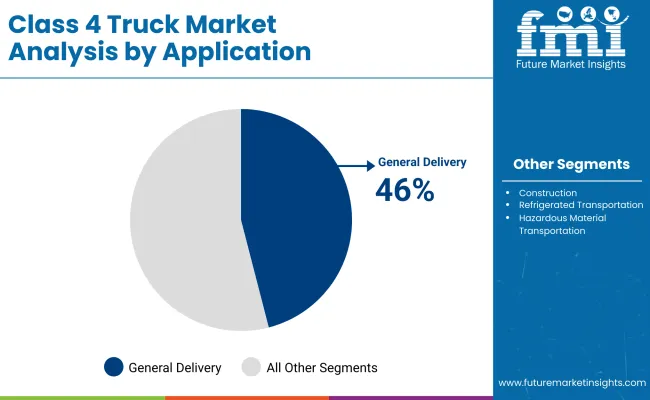
General delivery applications capture 46% of the class 4 truck market, driven by growth in e-commerce, food delivery, and local courier services. OEMs including Hino Motors, Chevrolet, and Ram Trucks provide models optimized for urban maneuverability, cargo space, and fuel efficiency. Demand is concentrated in densely populated regions where last-mile delivery challenges require reliable and versatile trucks. Expansion of regional warehouses and omni-channel retail strategies have further increased requirements for this segment. Regulatory policies encouraging lower emissions in cities are gradually influencing fleet upgrades towards cleaner powertrains.

  • Hino’s 195h hybrid model targets urban delivery fleets seeking fuel savings and emission reductions
  • Chevrolet’s Class 4 trucks registered 9% sales growth in metropolitan areas during 2024
  • Ram Trucks introduced new connectivity features for delivery route optimization in 2025

Payload Capacity of 12,501 - 14,500 lbs Leads with 34% Market Share

Payload capacity between 12,501 and 14,500 lbs holds 34% market share, preferred for balancing cargo volume and vehicle maneuverability. Manufacturers such as Freightliner, Ford, and International Trucks offer multiple configurations within this range to meet varied operational needs. This capacity suits general delivery, construction material transport, and refrigerated goods movement efficiently. Fleet operators benefit from improved fuel economy relative to higher payload trucks and greater load flexibility compared to smaller classes. This segment has seen steady growth driven by last-mile delivery and construction sector demands in North America and Europe.

  • Freightliner’s M2 106 offers customizable payload options within this capacity range
  • Ford’s F-650 is popular for payload capacities up to 14,000 lbs with enhanced chassis durability
  • International Trucks expanded 12,501 - 14,500 lbs configurations for refrigerated and dry van bodies

Box Trucks Lead Body Type Segment at 33% Share

Box trucks command 33% of the Class 4 truck body type segment due to their cargo protection and loading efficiency. Key players like Isuzu, Mitsubishi Fuso, and Ford supply box trucks tailored for urban delivery, retail logistics, and moving services. These trucks are preferred where security and weather protection are critical for transported goods. Innovations in lightweight composite materials and aerodynamic designs have improved fuel efficiency and payload capacity. Box trucks also support modular cargo systems facilitating diverse commercial uses from parcel delivery to foodservice distribution.

  • Isuzu NPR box trucks are widely used in commercial delivery fleets across the US and Asia
  • Mitsubishi Fuso expanded its eCanter electric box truck lineup to urban logistics customers in 2025
  • Ford’s Transit box truck models offer advanced telematics for fleet management and route planning

Diesel Powertrain Retains 64% Market Share in Class 4 Segment

Diesel remains the dominant class 4 powertrain at 64% share due to its torque, range, and refueling speed advantages. Manufacturers including Freightliner, International Trucks, and Hino continue to enhance diesel engine emissions technology to meet tightening environmental regulations. Diesel trucks serve diverse applications requiring dependable performance and lower total operating costs in heavy-use fleets. Though gasoline and electric alternatives are growing, diesel’s widespread fueling infrastructure and established service networks sustain its leadership. Fleet owners value the combination of performance and operational efficiency that diesel powertrains provide.
  • Freightliner’s M2 diesel trucks improved emissions compliance with selective catalytic reduction (SCR) systems
  • International Trucks reported 7% year-on-year growth in diesel Class 4 sales during 2024
  • Hino Motors introduced diesel engines with 10% improved fuel efficiency and lower NOx emissions

Top Countries Driving Growth in The Class 4 Truck Market

Class 4 Truck Market By Country

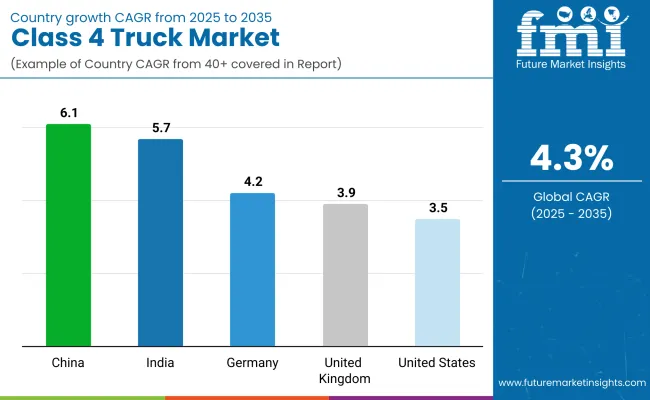
The global market is expected to grow at a CAGR of 4.3% over the forecast period, below the broader global CAGR benchmark of 6%. Among key markets analyzed, China leads with a CAGR of 6.1%, closely aligning with the higher growth rates seen in BRICS economies. India follows at 5.7%, reflecting strong demand from the expanding ASEAN region. Germany posts a moderate CAGR of 4.2%, slightly below the global market average, while the United Kingdom and United States lag further behind at 3.9% and 3.5%, respectively.

These figures demonstrate a 42% premium for China relative to the global class 4 truck CAGR, whereas India shows a 32% premium. In contrast, Germany, the UK, and the USA display slower growth by 2%, 10%, and 19%, respectively, consistent with trends in mature OECD markets. Growth in emerging markets is driven by rising infrastructure investments and urbanization, while developed countries face saturation and stricter regulations limiting expansion.

Analysis of Class 4 Truck Market in China

The class 4 Truck Market in China is expanding at a CAGR of 6.1% due to ongoing improvements in logistics infrastructure and supportive regulations favoring medium-duty commercial vehicles. Increased demand from manufacturing and e-commerce sectors is driving the need for trucks that combine cargo capacity with enhanced fuel efficiency and reduced emissions.

Technological upgrades such as telematics and advanced safety systems are becoming standard in new models. Regional governments are promoting cleaner transport to improve logistics efficiency, which supports market expansion. These factors are expected to sustain the upward growth trend throughout the forecast period.

  • The logistics sector is projected to increase Class 4 truck use by over 12% by 2030.
  • Integration of telematics technology is expected in 40% of new Class 4 trucks by 2028.
  • Incentives for medium-duty electric trucks have raised their market share to 8% in 2024.

Demand Forecast for Class 4 Truck Market in India

The class 4 truck market in India is growing at a CAGR of 5.7%, supported by rising demand for medium-duty trucks in intra-city transport and commercial distribution. Industrial growth and expansion of logistics centers require versatile and fuel-efficient vehicles capable of navigating congested roads. Fleet replacement initiatives focusing on newer emission-compliant trucks add momentum. Demand also stems from logistics companies optimizing delivery routes within urban and semi-urban areas. Infrastructure improvements are facilitating smoother supply chains, encouraging adoption of Class 4 trucks over the forecast period.

  • Fleet modernization is expected to replace 25% of older trucks with Class 4 models by 2027.
  • Diesel-powered Class 4 trucks account for over 70% of demand due to fuel efficiency on long urban routes.
  • Sales of medium-duty trucks in Tier 2 and Tier 3 cities are forecasted to grow by 15% annually through 2029.

Growth Analysis of Class 4 Truck Market in Germany

The class 4 truck market in Germany is projected to grow at a CAGR of 4.2%, driven by strong industrial manufacturing and efficient regional logistics. Strict emission standards encourage adoption of advanced, fuel-efficient trucks with higher payloads. Increasing demand for electric and hybrid medium-duty trucks is supported by government incentives. Germany’s well-developed road infrastructure enables efficient freight transport, benefiting the market. The industry is moving toward vehicles equipped with advanced driver assistance and telematics systems, enhancing operational efficiency and compliance.

  • Electric and hybrid Class 4 trucks are projected to represent 15% of sales by 2030.
  • Advanced driver assistance systems are fitted in 35% of newly registered Class 4 trucks as of 2024.
  • The regional logistics sector is expected to grow Class 4 truck demand by 6% annually through 2035.

Future Outlook for Class 4 Truck Market in United Kingdom

The class 4 truck market is expected to expand at a CAGR of 3.9%, influenced by evolving urban delivery demands and regulatory changes. Medium-duty trucks optimized for maneuverability and payload efficiency in congested areas are preferred. Emission regulations have shifted purchases toward cleaner fuel technologies, while diesel remains predominant due to existing infrastructure. Investment in electric class 4 trucks is increasing, driven by government funding and market adaptation. The sector is responding to the rising needs of last-mile delivery services, impacting truck specifications and sales trends.

  • Market share of electric Class 4 trucks is expected to increase from 5% in 2023 to 18% by 2032.
  • Demand for higher cargo capacity Class 4 trucks is growing by 4% annually, driven by e-commerce.
  • Government support includes £120 million allocated for zero-emission medium-duty truck adoption by 2027.

Class 4 Truck Market Growth Outlook in United States

The industry in United States is projected to grow at a CAGR of 3.5%, driven by expanding regional freight movement and commercial deliveries. Medium-duty trucks are valued for operational flexibility in urban and short-haul applications. Regulatory focus on emissions and fuel efficiency has led to increased adoption of hybrid and electric trucks. Fleet operators emphasize cost-effective, reliable vehicles for last-mile deliveries. Infrastructure improvements and telematics integration are supporting market growth by improving safety and fleet management capabilities.
  • Hybrid and electric Class 4 trucks are expected to make up 12% of new sales by 2030.
  • Last-mile delivery demand has increased medium-duty truck sales by 7% annually over recent years.
  • Telematics adoption in Class 4 trucks reached 50% penetration among fleet operators in 2024.

Leading Class 4 Truck Manufacturers, Suppliers, and Distributors

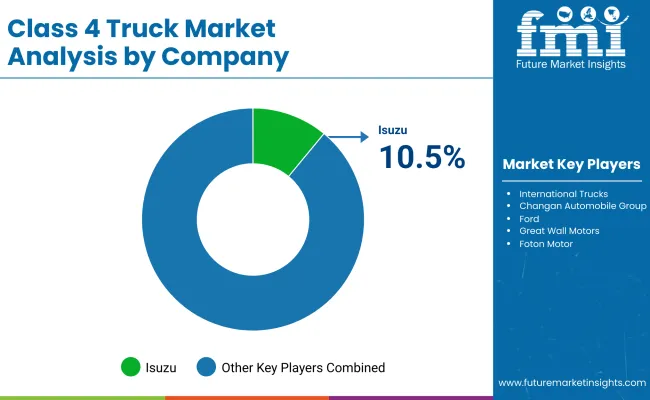
Class 4 Truck Market By Company

The market is dominated by established manufacturers such as Isuzu, Ford, and Hino Motors, alongside emerging players like JAC Motors and Great Wall Motors. Isuzu maintains a strong position with its N-Series trucks, known for reliability and fuel efficiency, while Ford competes aggressively with its F-650, targeting vocational and fleet buyers. Hino Motors, a Toyota subsidiary, emphasizes durability in its Class 4 lineup, catering to commercial and logistics applications.

The Chinese automakers like Foton and Dongfeng are expanding globally through competitive pricing and partnerships, particularly in emerging markets. These manufacturers drive growth through strategic product launches, such as Ford’s updated F-650 with enhanced powertrain options, and Isuzu’s introduction of cleaner diesel engines to meet evolving regulations.

Emerging players are gaining traction by focusing on cost-effective solutions and regional market needs. JAC Motors, for example, has entered Latin America and Africa with competitively priced Class 4 trucks, while Great Wall Motors is investing in R&D to improve vehicle performance and durability. Mitsubishi Fuso and UD Trucks leverage their parent companies’ resources (Daimler Truck and Volvo Group, respectively) to enhance technology and dealer networks.

Distributors and suppliers play a key role by expanding aftermarket support and financing options, helping fleets adopt newer models. As competition intensifies, manufacturers are prioritizing localized production, fleet customization, and stronger dealer networks to secure market share.

Recent Developments The class 4 truck market is expanding with new electric models targeting North America. In December 2024, The Shyft Group launched the Blue Arc Class 4 EV to improve logistics operations. Earlier, in August 2024, Bollinger introduced a Class 4 electric truck with a 158-kWh battery for extended range. Rizon also entered the segment in April 2024 with a new Class 4 electric truck lineup designed for Canadian customers.

Established players like Isuzu, Ford, and Hino continue leading with diesel models, while Chinese automakers like JAC Motors and Foton compete with cost-effective solutions in emerging markets. Manufacturers are focusing on product launches, regional adaptations, and fleet customization to strengthen their positions.

Leading Players

  • JAC Motors
  • Nissan
  • Mitsubishi Fuso
  • Isuzu
  • Dongfeng
  • Hino Motors
  • UD Trucks
  • Foton
  • International Trucks
  • Changan Automobile Group
  • Ford
  • Great Wall Motors
  • Foton Motor
  • SAIC Motor
  • BeiqiFoton Motor
  • Chevrolet
  • GMC
  • and some others

Report Scope

Report Attributes Details
Market Size (2025) USD 14.83 billion
Projected Market Size (2035) USD 22.54 billion
CAGR (2025 to 2035) 4.3%
Base Year for Estimation 2024
Historical Period 2020 to 2024
Projections Period 2025 to 2035
Quantitative Units USD billion for value and volume units as applicable
Type Segments (Segment 1) Conventional, Electric, Hybrid
Application Segments (Segment 2) General Delivery, Construction, Hazardous Material Transportation, Refrigerated Transportation
Payload Capacity Segments (Segment 3) 10,001 - 12,500 lbs, 12,501 - 14,500 lbs, 14,501 - 16,500 lbs, 16,501 - 18,500 lbs
Body Type Segments (Segment 4) Dry Van, Flatbed, Refrigerated Van, Dump Truck, Box Truck
Powertrain Segments (Segment 5) Diesel, Gasoline, Electric
Regions Covered North America; Latin America; Western Europe; Eastern Europe; Asia Pacific; Middle East and Africa
Countries Covered United States, Canada, Brazil, Mexico, Germany, United Kingdom, France, Italy, China, Japan, India, UAE, South Africa
Key Players JAC Motors, Nissan, Mitsubishi Fuso, Isuzu, Dongfeng, Hino Motors, UD Trucks, Foton, International Trucks, Changan Automobile Group, Ford, Great Wall Motors, SAIC Motor, Beiqi Foton Motor, Chevrolet, GMC
Additional Attributes Dollar sales by vehicle type (cargo, delivery vans), end-use across logistics and retail, demand driven by last-mile delivery growth, regional expansion in North America, innovation in electric drivetrains and telematics, environmental gains via reduced emissions, and emerging use in urban logistics and e-commerce.

Class 4 Truck Market Analyzed by Key Investment Segments

By Type:

  • Conventional
  • Electric
  • Hybrid

By Application:

  • General Delivery
  • Construction
  • Hazardous Material Transportation
  • Refrigerated Transportation

By Payload Capacity:

  • 10,001 - 12,500 lbs
  • 12,501 - 14,500 lbs
  • 14,501 - 16,500 lbs
  • 16,501 - 18,500 lbs

By Body Type:

  • Dry Van
  • Flatbed
  • Refrigerated Van
  • Dump Truck
  • Box Truck

By Powertrain:

  • Diesel
  • Gasoline
  • Electric

By Region:

  • North America
  • Latin America
  • Western Europe
  • Eastern Europe
  • Asia Pacific
  • The Middle East and Africa

Table of Content

  1. Executive Summary
    • Global Market Outlook
    • Demand-side Trends
    • Supply-side Trends
    • Technology Roadmap Analysis
    • Analysis and Recommendations
  2. Market Overview
    • Market Coverage / Taxonomy
    • Market Definition / Scope / Limitations
  3. Market Background
    • Market Dynamics
      • Drivers
      • Restraints
      • Opportunity
      • Trends
    • Scenario Forecast
      • Demand in Optimistic Scenario
      • Demand in Likely Scenario
      • Demand in Conservative Scenario
    • Opportunity Map Analysis
    • Product Life Cycle Analysis
    • Supply Chain Analysis
      • Supply Side Participants and their Roles
        • Producers
        • Mid-Level Participants (Traders/ Agents/ Brokers)
        • Wholesalers and Distributors
      • Value Added and Value Created at Node in the Supply Chain
      • List of Raw Material Suppliers
      • List of Existing and Potential Buyer’s
    • Investment Feasibility Matrix
    • Value Chain Analysis
      • Profit Margin Analysis
      • Wholesalers and Distributors
      • Retailers
    • PESTLE and Porter’s Analysis
    • Regulatory Landscape
      • By Key Regions
      • By Key Countries
    • Regional Parent Market Outlook
    • Production and Consumption Statistics
    • Import and Export Statistics
  4. Global Market Analysis 2020 to 2024 and Forecast, 2025 to 2035
    • Historical Market Size Value (USD Billion) & Volume (Units) Analysis, 2020 to 2024
    • Current and Future Market Size Value (USD Billion) & Volume (Units) Projections, 2025 to 2035
      • Y-o-Y Growth Trend Analysis
      • Absolute $ Opportunity Analysis
  5. Global Market Pricing Analysis 2020 to 2024 and Forecast 2025 to 2035
  6. Global Market Analysis 2020 to 2024 and Forecast 2025 to 2035, By Type
    • Introduction / Key Findings
    • Historical Market Size Value (USD Billion) & Volume (Units) Analysis By Type, 2020 to 2024
    • Current and Future Market Size Value (USD Billion) & Volume (Units) Analysis and Forecast By Type, 2025 to 2035
      • Conventional
      • Electric
      • Hybrid
    • Y-o-Y Growth Trend Analysis By Type, 2020 to 2024
    • Absolute $ Opportunity Analysis By Type, 2025 to 2035
  7. Global Market Analysis 2020 to 2024 and Forecast 2025 to 2035, By Application
    • Introduction / Key Findings
    • Historical Market Size Value (USD Billion) & Volume (Units) Analysis By Application, 2020 to 2024
    • Current and Future Market Size Value (USD Billion) & Volume (Units) Analysis and Forecast By Application, 2025 to 2035
      • General Delivery
      • Construction
      • Hazardous Material Transportation
      • Refrigerated Transportation
    • Y-o-Y Growth Trend Analysis By Application, 2020 to 2024
    • Absolute $ Opportunity Analysis By Application, 2025 to 2035
  8. Global Market Analysis 2020 to 2024 and Forecast 2025 to 2035, By Payload Capacity
    • Introduction / Key Findings
    • Historical Market Size Value (USD Billion) & Volume (Units) Analysis By Payload Capacity, 2020 to 2024
    • Current and Future Market Size Value (USD Billion) & Volume (Units) Analysis and Forecast By Payload Capacity, 2025 to 2035
      • 10,001 - 12,500 lbs
      • 12,501 - 14,500 lbs
      • 14,501 - 16,500 lbs
      • 16,501 - 18,500 lbs
    • Y-o-Y Growth Trend Analysis By Payload Capacity, 2020 to 2024
    • Absolute $ Opportunity Analysis By Payload Capacity, 2025 to 2035
  9. Global Market Analysis 2020 to 2024 and Forecast 2025 to 2035, By Body Type
    • Introduction / Key Findings
    • Historical Market Size Value (USD Billion) & Volume (Units) Analysis By Body Type, 2020 to 2024
    • Current and Future Market Size Value (USD Billion) & Volume (Units) Analysis and Forecast By Body Type, 2025 to 2035
      • Dry Van
      • Flatbed
      • Refrigerated Van
      • Dump Truck
      • Box Truck
    • Y-o-Y Growth Trend Analysis By Body Type, 2020 to 2024
    • Absolute $ Opportunity Analysis By Body Type, 2025 to 2035
  10. Global Market Analysis 2020 to 2024 and Forecast 2025 to 2035, By Powertrain
    • Introduction / Key Findings
    • Historical Market Size Value (USD Billion) & Volume (Units) Analysis By Powertrain, 2020 to 2024
    • Current and Future Market Size Value (USD Billion) & Volume (Units) Analysis and Forecast By Powertrain, 2025 to 2035
      • Diesel
      • Gasoline
      • Electric
    • Y-o-Y Growth Trend Analysis By Powertrain, 2020 to 2024
    • Absolute $ Opportunity Analysis By Powertrain, 2025 to 2035
  11. Global Market Analysis 2020 to 2024 and Forecast 2025 to 2035, By Region
    • Introduction
    • Historical Market Size Value (USD Billion) & Volume (Units) Analysis By Region, 2020 to 2024
    • Current Market Size Value (USD Billion) & Volume (Units) Analysis and Forecast By Region, 2025 to 2035
      • North America
      • Latin America
      • Western Europe
      • Eastern Europe
      • East Asia
      • South Asia & Pacific
      • Middle East and Africa
    • Market Attractiveness Analysis By Region
  12. North America Market Analysis 2020 to 2024 and Forecast 2025 to 2035, By Country
    • Historical Market Size Value (USD Billion) & Volume (Units) Trend Analysis By Market Taxonomy, 2020 to 2024
    • Market Size Value (USD Billion) & Volume (Units) Forecast By Market Taxonomy, 2025 to 2035
      • By Country
        • USA
        • Canada
        • Mexico
      • By Type
      • By Application
      • By Payload Capacity
      • By Body Type
      • By Powertrain
    • Market Attractiveness Analysis
      • By Country
      • By Type
      • By Application
      • By Payload Capacity
      • By Body Type
      • By Powertrain
    • Key Takeaways
  13. Latin America Market Analysis 2020 to 2024 and Forecast 2025 to 2035, By Country
    • Historical Market Size Value (USD Billion) & Volume (Units) Trend Analysis By Market Taxonomy, 2020 to 2024
    • Market Size Value (USD Billion) & Volume (Units) Forecast By Market Taxonomy, 2025 to 2035
      • By Country
        • Brazil
        • Argentina
        • Rest of LATAM
      • By Type
      • By Application
      • By Payload Capacity
      • By Body Type
      • By Powertrain
    • Market Attractiveness Analysis
      • By Country
      • By Type
      • By Application
      • By Payload Capacity
      • By Body Type
      • By Powertrain
    • Key Takeaways
  14. Western Europe Market Analysis 2020 to 2024 and Forecast 2025 to 2035, By Country
    • Historical Market Size Value (USD Billion) & Volume (Units) Trend Analysis By Market Taxonomy, 2020 to 2024
    • Market Size Value (USD Billion) & Volume (Units) Forecast By Market Taxonomy, 2025 to 2035
      • By Country
        • Germany
        • Italy
        • France
        • UK
        • Spain
        • BENELUX
        • Nordic
        • Rest of W.Europe
      • By Type
      • By Application
      • By Payload Capacity
      • By Body Type
      • By Powertrain
    • Market Attractiveness Analysis
      • By Country
      • By Type
      • By Application
      • By Payload Capacity
      • By Body Type
      • By Powertrain
    • Key Takeaways
  15. Eastern Europe Market Analysis 2020 to 2024 and Forecast 2025 to 2035, By Country
    • Historical Market Size Value (USD Billion) & Volume (Units) Trend Analysis By Market Taxonomy, 2020 to 2024
    • Market Size Value (USD Billion) & Volume (Units) Forecast By Market Taxonomy, 2025 to 2035
      • By Country
        • Russia
        • Hungary
        • Poland
        • Balkan & Baltics
        • Rest of E. Europe
      • By Type
      • By Application
      • By Payload Capacity
      • By Body Type
      • By Powertrain
    • Market Attractiveness Analysis
      • By Country
      • By Type
      • By Application
      • By Payload Capacity
      • By Body Type
      • By Powertrain
    • Key Takeaways
  16. East Asia Market Analysis 2020 to 2024 and Forecast 2025 to 2035, By Country
    • Historical Market Size Value (USD Billion) & Volume (Units) Trend Analysis By Market Taxonomy, 2020 to 2024
    • Market Size Value (USD Billion) & Volume (Units) Forecast By Market Taxonomy, 2025 to 2035
      • By Country
        • China
        • Japan
        • South Korea
      • By Type
      • By Application
      • By Payload Capacity
      • By Body Type
      • By Powertrain
    • Market Attractiveness Analysis
      • By Country
      • By Type
      • By Application
      • By Payload Capacity
      • By Body Type
      • By Powertrain
    • Key Takeaways
  17. South Asia & Pacific Market Analysis 2020 to 2024 and Forecast 2025 to 2035, By Country
    • Historical Market Size Value (USD Billion) & Volume (Units) Trend Analysis By Market Taxonomy, 2020 to 2024
    • Market Size Value (USD Billion) & Volume (Units) Forecast By Market Taxonomy, 2025 to 2035
      • By Country
        • India
        • Australia & New Zealand
        • ASEAN
        • Rest of SAP
      • By Type
      • By Application
      • By Payload Capacity
      • By Body Type
      • By Powertrain
    • Market Attractiveness Analysis
      • By Country
      • By Type
      • By Application
      • By Payload Capacity
      • By Body Type
      • By Powertrain
    • Key Takeaways
  18. Middle East and Africa Market Analysis 2020 to 2024 and Forecast 2025 to 2035, By Country
    • Historical Market Size Value (USD Billion) & Volume (Units) Trend Analysis By Market Taxonomy, 2020 to 2024
    • Market Size Value (USD Billion) & Volume (Units) Forecast By Market Taxonomy, 2025 to 2035
      • By Country
        • GCC Countries
        • Northern Africa
        • South Africa
        • Turkiye
        • Rest of MEA
      • By Type
      • By Application
      • By Payload Capacity
      • By Body Type
      • By Powertrain
    • Market Attractiveness Analysis
      • By Country
      • By Type
      • By Application
      • By Payload Capacity
      • By Body Type
      • By Powertrain
    • Key Takeaways
  19. Key Countries Market Analysis
    • USA
      • Pricing Analysis
      • Market Share Analysis, 2024
        • By Type
        • By Application
        • By Payload Capacity
        • By Body Type
        • By Powertrain
    • Canada
      • Pricing Analysis
      • Market Share Analysis, 2024
        • By Type
        • By Application
        • By Payload Capacity
        • By Body Type
        • By Powertrain
    • Brazil
      • Pricing Analysis
      • Market Share Analysis, 2024
        • By Type
        • By Application
        • By Payload Capacity
        • By Body Type
        • By Powertrain
    • Mexico
      • Pricing Analysis
      • Market Share Analysis, 2024
        • By Type
        • By Application
        • By Payload Capacity
        • By Body Type
        • By Powertrain
    • Argentina
      • Pricing Analysis
      • Market Share Analysis, 2024
        • By Type
        • By Application
        • By Payload Capacity
        • By Body Type
        • By Powertrain
  20. Market Structure Analysis
    • Competition Dashboard
    • Competition Benchmarking
    • Market Share Analysis of Top Players
      • By Regional
      • By Type
      • By Application
      • By Payload Capacity
      • By Body Type
      • By Powertrain
  21. Competition Analysis
    • Competition Deep Dive
      • JAC Motors
        • Overview
        • Product Portfolio
        • Profitability by Market Segments (Product/Age /Sales Channel/Region)
        • Sales Footprint
        • Strategy Overview
          • Marketing Strategy
          • Product Strategy
          • Channel Strategy
      • Nissan
        • Overview
        • Product Portfolio
        • Profitability by Market Segments (Product/Age /Sales Channel/Region)
        • Sales Footprint
        • Strategy Overview
          • Marketing Strategy
          • Product Strategy
          • Channel Strategy
      • Mitsubishi Fuso
        • Overview
        • Product Portfolio
        • Profitability by Market Segments (Product/Age /Sales Channel/Region)
        • Sales Footprint
        • Strategy Overview
          • Marketing Strategy
          • Product Strategy
          • Channel Strategy
      • Isuzu
        • Overview
        • Product Portfolio
        • Profitability by Market Segments (Product/Age /Sales Channel/Region)
        • Sales Footprint
        • Strategy Overview
          • Marketing Strategy
          • Product Strategy
          • Channel Strategy
      • Dongfeng
        • Overview
        • Product Portfolio
        • Profitability by Market Segments (Product/Age /Sales Channel/Region)
        • Sales Footprint
        • Strategy Overview
          • Marketing Strategy
          • Product Strategy
          • Channel Strategy
      • Hino Motors
        • Overview
        • Product Portfolio
        • Profitability by Market Segments (Product/Age /Sales Channel/Region)
        • Sales Footprint
        • Strategy Overview
          • Marketing Strategy
          • Product Strategy
          • Channel Strategy
      • UD Trucks
        • Overview
        • Product Portfolio
        • Profitability by Market Segments (Product/Age /Sales Channel/Region)
        • Sales Footprint
        • Strategy Overview
          • Marketing Strategy
          • Product Strategy
          • Channel Strategy
      • Foton
        • Overview
        • Product Portfolio
        • Profitability by Market Segments (Product/Age /Sales Channel/Region)
        • Sales Footprint
        • Strategy Overview
          • Marketing Strategy
          • Product Strategy
          • Channel Strategy
      • International Trucks
        • Overview
        • Product Portfolio
        • Profitability by Market Segments (Product/Age /Sales Channel/Region)
        • Sales Footprint
        • Strategy Overview
          • Marketing Strategy
          • Product Strategy
          • Channel Strategy
      • Changan Automobile Group
        • Overview
        • Product Portfolio
        • Profitability by Market Segments (Product/Age /Sales Channel/Region)
        • Sales Footprint
        • Strategy Overview
          • Marketing Strategy
          • Product Strategy
          • Channel Strategy
      • Ford
        • Overview
        • Product Portfolio
        • Profitability by Market Segments (Product/Age /Sales Channel/Region)
        • Sales Footprint
        • Strategy Overview
          • Marketing Strategy
          • Product Strategy
          • Channel Strategy
      • Great Wall Motors
        • Overview
        • Product Portfolio
        • Profitability by Market Segments (Product/Age /Sales Channel/Region)
        • Sales Footprint
        • Strategy Overview
          • Marketing Strategy
          • Product Strategy
          • Channel Strategy
      • Foton Motor
        • Overview
        • Product Portfolio
        • Profitability by Market Segments (Product/Age /Sales Channel/Region)
        • Sales Footprint
        • Strategy Overview
          • Marketing Strategy
          • Product Strategy
          • Channel Strategy
      • SAIC Motor
        • Overview
        • Product Portfolio
        • Profitability by Market Segments (Product/Age /Sales Channel/Region)
        • Sales Footprint
        • Strategy Overview
          • Marketing Strategy
          • Product Strategy
          • Channel Strategy
      • Beiqi Foton Motor
        • Overview
        • Product Portfolio
        • Profitability by Market Segments (Product/Age /Sales Channel/Region)
        • Sales Footprint
        • Strategy Overview
          • Marketing Strategy
          • Product Strategy
          • Channel Strategy
      • Chevrolet
        • Overview
        • Product Portfolio
        • Profitability by Market Segments (Product/Age /Sales Channel/Region)
        • Sales Footprint
        • Strategy Overview
          • Marketing Strategy
          • Product Strategy
          • Channel Strategy
      • GMC
        • Overview
        • Product Portfolio
        • Profitability by Market Segments (Product/Age /Sales Channel/Region)
        • Sales Footprint
        • Strategy Overview
          • Marketing Strategy
          • Product Strategy
          • Channel Strategy
  22. Assumptions & Acronyms Used
  23. Research Methodology

List of Tables

  • Table 1: Global Market Value (USD Billion) Forecast by Region, 2020-2035
  • Table 2: Global Market Volume (Units) Forecast by Region, 2020-2035
  • Table 3: Global Market Value (USD Billion) Forecast by Type, 2020-2035
  • Table 4: Global Market Volume (Units) Forecast by Type, 2020-2035
  • Table 5: Global Market Value (USD Billion) Forecast by Application, 2020-2035
  • Table 6: Global Market Volume (Units) Forecast by Application, 2020-2035
  • Table 7: Global Market Value (USD Billion) Forecast by Payload Capacity, 2020-2035
  • Table 8: Global Market Volume (Units) Forecast by Payload Capacity, 2020-2035
  • Table 9: Global Market Value (USD Billion) Forecast by Body Type, 2020-2035
  • Table 10: Global Market Volume (Units) Forecast by Body Type, 2020-2035
  • Table 11: Global Market Value (USD Billion) Forecast by Powertrain, 2020-2035
  • Table 12: Global Market Volume (Units) Forecast by Powertrain, 2020-2035
  • Table 13: North America Market Value (USD Billion) Forecast by Country, 2020-2035
  • Table 14: North America Market Volume (Units) Forecast by Country, 2020-2035
  • Table 15: North America Market Value (USD Billion) Forecast by Type, 2020-2035
  • Table 16: North America Market Volume (Units) Forecast by Type, 2020-2035
  • Table 17: North America Market Value (USD Billion) Forecast by Application, 2020-2035
  • Table 18: North America Market Volume (Units) Forecast by Application, 2020-2035
  • Table 19: North America Market Value (USD Billion) Forecast by Payload Capacity, 2020-2035
  • Table 20: North America Market Volume (Units) Forecast by Payload Capacity, 2020-2035
  • Table 21: North America Market Value (USD Billion) Forecast by Body Type, 2020-2035
  • Table 22: North America Market Volume (Units) Forecast by Body Type, 2020-2035
  • Table 23: North America Market Value (USD Billion) Forecast by Powertrain, 2020-2035
  • Table 24: North America Market Volume (Units) Forecast by Powertrain, 2020-2035
  • Table 25: Latin America Market Value (USD Billion) Forecast by Country, 2020-2035
  • Table 26: Latin America Market Volume (Units) Forecast by Country, 2020-2035
  • Table 27: Latin America Market Value (USD Billion) Forecast by Type, 2020-2035
  • Table 28: Latin America Market Volume (Units) Forecast by Type, 2020-2035
  • Table 29: Latin America Market Value (USD Billion) Forecast by Application, 2020-2035
  • Table 30: Latin America Market Volume (Units) Forecast by Application, 2020-2035
  • Table 31: Latin America Market Value (USD Billion) Forecast by Payload Capacity, 2020-2035
  • Table 32: Latin America Market Volume (Units) Forecast by Payload Capacity, 2020-2035
  • Table 33: Latin America Market Value (USD Billion) Forecast by Body Type, 2020-2035
  • Table 34: Latin America Market Volume (Units) Forecast by Body Type, 2020-2035
  • Table 35: Latin America Market Value (USD Billion) Forecast by Powertrain, 2020-2035
  • Table 36: Latin America Market Volume (Units) Forecast by Powertrain, 2020-2035
  • Table 37: Western Europe Market Value (USD Billion) Forecast by Country, 2020-2035
  • Table 38: Western Europe Market Volume (Units) Forecast by Country, 2020-2035
  • Table 39: Western Europe Market Value (USD Billion) Forecast by Type, 2020-2035
  • Table 40: Western Europe Market Volume (Units) Forecast by Type, 2020-2035
  • Table 41: Western Europe Market Value (USD Billion) Forecast by Application, 2020-2035
  • Table 42: Western Europe Market Volume (Units) Forecast by Application, 2020-2035
  • Table 43: Western Europe Market Value (USD Billion) Forecast by Payload Capacity, 2020-2035
  • Table 44: Western Europe Market Volume (Units) Forecast by Payload Capacity, 2020-2035
  • Table 45: Western Europe Market Value (USD Billion) Forecast by Body Type, 2020-2035
  • Table 46: Western Europe Market Volume (Units) Forecast by Body Type, 2020-2035
  • Table 47: Western Europe Market Value (USD Billion) Forecast by Powertrain, 2020-2035
  • Table 48: Western Europe Market Volume (Units) Forecast by Powertrain, 2020-2035
  • Table 49: Eastern Europe Market Value (USD Billion) Forecast by Country, 2020-2035
  • Table 50: Eastern Europe Market Volume (Units) Forecast by Country, 2020-2035
  • Table 51: Eastern Europe Market Value (USD Billion) Forecast by Type, 2020-2035
  • Table 52: Eastern Europe Market Volume (Units) Forecast by Type, 2020-2035
  • Table 53: Eastern Europe Market Value (USD Billion) Forecast by Application, 2020-2035
  • Table 54: Eastern Europe Market Volume (Units) Forecast by Application, 2020-2035
  • Table 55: Eastern Europe Market Value (USD Billion) Forecast by Payload Capacity, 2020-2035
  • Table 56: Eastern Europe Market Volume (Units) Forecast by Payload Capacity, 2020-2035
  • Table 57: Eastern Europe Market Value (USD Billion) Forecast by Body Type, 2020-2035
  • Table 58: Eastern Europe Market Volume (Units) Forecast by Body Type, 2020-2035
  • Table 59: Eastern Europe Market Value (USD Billion) Forecast by Powertrain, 2020-2035
  • Table 60: Eastern Europe Market Volume (Units) Forecast by Powertrain, 2020-2035
  • Table 61: East Asia Market Value (USD Billion) Forecast by Country, 2020-2035
  • Table 62: East Asia Market Volume (Units) Forecast by Country, 2020-2035
  • Table 63: East Asia Market Value (USD Billion) Forecast by Type, 2020-2035
  • Table 64: East Asia Market Volume (Units) Forecast by Type, 2020-2035
  • Table 65: East Asia Market Value (USD Billion) Forecast by Application, 2020-2035
  • Table 66: East Asia Market Volume (Units) Forecast by Application, 2020-2035
  • Table 67: East Asia Market Value (USD Billion) Forecast by Payload Capacity, 2020-2035
  • Table 68: East Asia Market Volume (Units) Forecast by Payload Capacity, 2020-2035
  • Table 69: East Asia Market Value (USD Billion) Forecast by Body Type, 2020-2035
  • Table 70: East Asia Market Volume (Units) Forecast by Body Type, 2020-2035
  • Table 71: East Asia Market Value (USD Billion) Forecast by Powertrain, 2020-2035
  • Table 72: East Asia Market Volume (Units) Forecast by Powertrain, 2020-2035
  • Table 73: South Asia & Pacific Market Value (USD Billion) Forecast by Country, 2020-2035
  • Table 74: South Asia & Pacific Market Volume (Units) Forecast by Country, 2020-2035
  • Table 75: South Asia & Pacific Market Value (USD Billion) Forecast by Type, 2020-2035
  • Table 76: South Asia & Pacific Market Volume (Units) Forecast by Type, 2020-2035
  • Table 77: South Asia & Pacific Market Value (USD Billion) Forecast by Application, 2020-2035
  • Table 78: South Asia & Pacific Market Volume (Units) Forecast by Application, 2020-2035
  • Table 79: South Asia & Pacific Market Value (USD Billion) Forecast by Payload Capacity, 2020-2035
  • Table 80: South Asia & Pacific Market Volume (Units) Forecast by Payload Capacity, 2020-2035
  • Table 81: South Asia & Pacific Market Value (USD Billion) Forecast by Body Type, 2020-2035
  • Table 82: South Asia & Pacific Market Volume (Units) Forecast by Body Type, 2020-2035
  • Table 83: South Asia & Pacific Market Value (USD Billion) Forecast by Powertrain, 2020-2035
  • Table 84: South Asia & Pacific Market Volume (Units) Forecast by Powertrain, 2020-2035
  • Table 85: Middle East and Africa Market Value (USD Billion) Forecast by Country, 2020-2035
  • Table 86: Middle East and Africa Market Volume (Units) Forecast by Country, 2020-2035
  • Table 87: Middle East and Africa Market Value (USD Billion) Forecast by Type, 2020-2035
  • Table 88: Middle East and Africa Market Volume (Units) Forecast by Type, 2020-2035
  • Table 89: Middle East and Africa Market Value (USD Billion) Forecast by Application, 2020-2035
  • Table 90: Middle East and Africa Market Volume (Units) Forecast by Application, 2020-2035
  • Table 91: Middle East and Africa Market Value (USD Billion) Forecast by Payload Capacity, 2020-2035
  • Table 92: Middle East and Africa Market Volume (Units) Forecast by Payload Capacity, 2020-2035
  • Table 93: Middle East and Africa Market Value (USD Billion) Forecast by Body Type, 2020-2035
  • Table 94: Middle East and Africa Market Volume (Units) Forecast by Body Type, 2020-2035
  • Table 95: Middle East and Africa Market Value (USD Billion) Forecast by Powertrain, 2020-2035
  • Table 96: Middle East and Africa Market Volume (Units) Forecast by Powertrain, 2020-2035

List of Figures

  • Figure 1: Global Market Volume (Units) Forecast 2020-2035
  • Figure 2: Global Market Pricing Analysis
  • Figure 3: Global Market Value (USD Billion) Forecast 2020-2035
  • Figure 4: Global Market Value Share and BPS Analysis by Type, 2025 and 2035
  • Figure 5: Global Market Y-o-Y Growth Comparison by Type, 2025-2035
  • Figure 6: Global Market Attractiveness Analysis by Type
  • Figure 7: Global Market Value Share and BPS Analysis by Application, 2025 and 2035
  • Figure 8: Global Market Y-o-Y Growth Comparison by Application, 2025-2035
  • Figure 9: Global Market Attractiveness Analysis by Application
  • Figure 10: Global Market Value Share and BPS Analysis by Payload Capacity, 2025 and 2035
  • Figure 11: Global Market Y-o-Y Growth Comparison by Payload Capacity, 2025-2035
  • Figure 12: Global Market Attractiveness Analysis by Payload Capacity
  • Figure 13: Global Market Value Share and BPS Analysis by Body Type, 2025 and 2035
  • Figure 14: Global Market Y-o-Y Growth Comparison by Body Type, 2025-2035
  • Figure 15: Global Market Attractiveness Analysis by Body Type
  • Figure 16: Global Market Value Share and BPS Analysis by Powertrain, 2025 and 2035
  • Figure 17: Global Market Y-o-Y Growth Comparison by Powertrain, 2025-2035
  • Figure 18: Global Market Attractiveness Analysis by Powertrain
  • Figure 19: Global Market Value (USD Billion) Share and BPS Analysis by Region, 2025 and 2035
  • Figure 20: Global Market Y-o-Y Growth Comparison by Region, 2025-2035
  • Figure 21: Global Market Attractiveness Analysis by Region
  • Figure 22: North America Market Incremental $ Opportunity, 2025-2035
  • Figure 23: Latin America Market Incremental $ Opportunity, 2025-2035
  • Figure 24: Western Europe Market Incremental $ Opportunity, 2025-2035
  • Figure 25: Eastern Europe Market Incremental $ Opportunity, 2025-2035
  • Figure 26: East Asia Market Incremental $ Opportunity, 2025-2035
  • Figure 27: South Asia & Pacific Market Incremental $ Opportunity, 2025-2035
  • Figure 28: Middle East and Africa Market Incremental $ Opportunity, 2025-2035
  • Figure 29: North America Market Value Share and BPS Analysis by Country, 2025 and 2035
  • Figure 30: North America Market Value Share and BPS Analysis by Type, 2025 and 2035
  • Figure 31: North America Market Y-o-Y Growth Comparison by Type, 2025-2035
  • Figure 32: North America Market Attractiveness Analysis by Type
  • Figure 33: North America Market Value Share and BPS Analysis by Application, 2025 and 2035
  • Figure 34: North America Market Y-o-Y Growth Comparison by Application, 2025-2035
  • Figure 35: North America Market Attractiveness Analysis by Application
  • Figure 36: North America Market Value Share and BPS Analysis by Payload Capacity, 2025 and 2035
  • Figure 37: North America Market Y-o-Y Growth Comparison by Payload Capacity, 2025-2035
  • Figure 38: North America Market Attractiveness Analysis by Payload Capacity
  • Figure 39: North America Market Value Share and BPS Analysis by Body Type, 2025 and 2035
  • Figure 40: North America Market Y-o-Y Growth Comparison by Body Type, 2025-2035
  • Figure 41: North America Market Attractiveness Analysis by Body Type
  • Figure 42: North America Market Value Share and BPS Analysis by Powertrain, 2025 and 2035
  • Figure 43: North America Market Y-o-Y Growth Comparison by Powertrain, 2025-2035
  • Figure 44: North America Market Attractiveness Analysis by Powertrain
  • Figure 45: Latin America Market Value Share and BPS Analysis by Country, 2025 and 2035
  • Figure 46: Latin America Market Value Share and BPS Analysis by Type, 2025 and 2035
  • Figure 47: Latin America Market Y-o-Y Growth Comparison by Type, 2025-2035
  • Figure 48: Latin America Market Attractiveness Analysis by Type
  • Figure 49: Latin America Market Value Share and BPS Analysis by Application, 2025 and 2035
  • Figure 50: Latin America Market Y-o-Y Growth Comparison by Application, 2025-2035
  • Figure 51: Latin America Market Attractiveness Analysis by Application
  • Figure 52: Latin America Market Value Share and BPS Analysis by Payload Capacity, 2025 and 2035
  • Figure 53: Latin America Market Y-o-Y Growth Comparison by Payload Capacity, 2025-2035
  • Figure 54: Latin America Market Attractiveness Analysis by Payload Capacity
  • Figure 55: Latin America Market Value Share and BPS Analysis by Body Type, 2025 and 2035
  • Figure 56: Latin America Market Y-o-Y Growth Comparison by Body Type, 2025-2035
  • Figure 57: Latin America Market Attractiveness Analysis by Body Type
  • Figure 58: Latin America Market Value Share and BPS Analysis by Powertrain, 2025 and 2035
  • Figure 59: Latin America Market Y-o-Y Growth Comparison by Powertrain, 2025-2035
  • Figure 60: Latin America Market Attractiveness Analysis by Powertrain
  • Figure 61: Western Europe Market Value Share and BPS Analysis by Country, 2025 and 2035
  • Figure 62: Western Europe Market Value Share and BPS Analysis by Type, 2025 and 2035
  • Figure 63: Western Europe Market Y-o-Y Growth Comparison by Type, 2025-2035
  • Figure 64: Western Europe Market Attractiveness Analysis by Type
  • Figure 65: Western Europe Market Value Share and BPS Analysis by Application, 2025 and 2035
  • Figure 66: Western Europe Market Y-o-Y Growth Comparison by Application, 2025-2035
  • Figure 67: Western Europe Market Attractiveness Analysis by Application
  • Figure 68: Western Europe Market Value Share and BPS Analysis by Payload Capacity, 2025 and 2035
  • Figure 69: Western Europe Market Y-o-Y Growth Comparison by Payload Capacity, 2025-2035
  • Figure 70: Western Europe Market Attractiveness Analysis by Payload Capacity
  • Figure 71: Western Europe Market Value Share and BPS Analysis by Body Type, 2025 and 2035
  • Figure 72: Western Europe Market Y-o-Y Growth Comparison by Body Type, 2025-2035
  • Figure 73: Western Europe Market Attractiveness Analysis by Body Type
  • Figure 74: Western Europe Market Value Share and BPS Analysis by Powertrain, 2025 and 2035
  • Figure 75: Western Europe Market Y-o-Y Growth Comparison by Powertrain, 2025-2035
  • Figure 76: Western Europe Market Attractiveness Analysis by Powertrain
  • Figure 77: Eastern Europe Market Value Share and BPS Analysis by Country, 2025 and 2035
  • Figure 78: Eastern Europe Market Value Share and BPS Analysis by Type, 2025 and 2035
  • Figure 79: Eastern Europe Market Y-o-Y Growth Comparison by Type, 2025-2035
  • Figure 80: Eastern Europe Market Attractiveness Analysis by Type
  • Figure 81: Eastern Europe Market Value Share and BPS Analysis by Application, 2025 and 2035
  • Figure 82: Eastern Europe Market Y-o-Y Growth Comparison by Application, 2025-2035
  • Figure 83: Eastern Europe Market Attractiveness Analysis by Application
  • Figure 84: Eastern Europe Market Value Share and BPS Analysis by Payload Capacity, 2025 and 2035
  • Figure 85: Eastern Europe Market Y-o-Y Growth Comparison by Payload Capacity, 2025-2035
  • Figure 86: Eastern Europe Market Attractiveness Analysis by Payload Capacity
  • Figure 87: Eastern Europe Market Value Share and BPS Analysis by Body Type, 2025 and 2035
  • Figure 88: Eastern Europe Market Y-o-Y Growth Comparison by Body Type, 2025-2035
  • Figure 89: Eastern Europe Market Attractiveness Analysis by Body Type
  • Figure 90: Eastern Europe Market Value Share and BPS Analysis by Powertrain, 2025 and 2035
  • Figure 91: Eastern Europe Market Y-o-Y Growth Comparison by Powertrain, 2025-2035
  • Figure 92: Eastern Europe Market Attractiveness Analysis by Powertrain
  • Figure 93: East Asia Market Value Share and BPS Analysis by Country, 2025 and 2035
  • Figure 94: East Asia Market Value Share and BPS Analysis by Type, 2025 and 2035
  • Figure 95: East Asia Market Y-o-Y Growth Comparison by Type, 2025-2035
  • Figure 96: East Asia Market Attractiveness Analysis by Type
  • Figure 97: East Asia Market Value Share and BPS Analysis by Application, 2025 and 2035
  • Figure 98: East Asia Market Y-o-Y Growth Comparison by Application, 2025-2035
  • Figure 99: East Asia Market Attractiveness Analysis by Application
  • Figure 100: East Asia Market Value Share and BPS Analysis by Payload Capacity, 2025 and 2035
  • Figure 101: East Asia Market Y-o-Y Growth Comparison by Payload Capacity, 2025-2035
  • Figure 102: East Asia Market Attractiveness Analysis by Payload Capacity
  • Figure 103: East Asia Market Value Share and BPS Analysis by Body Type, 2025 and 2035
  • Figure 104: East Asia Market Y-o-Y Growth Comparison by Body Type, 2025-2035
  • Figure 105: East Asia Market Attractiveness Analysis by Body Type
  • Figure 106: East Asia Market Value Share and BPS Analysis by Powertrain, 2025 and 2035
  • Figure 107: East Asia Market Y-o-Y Growth Comparison by Powertrain, 2025-2035
  • Figure 108: East Asia Market Attractiveness Analysis by Powertrain
  • Figure 109: South Asia & Pacific Market Value Share and BPS Analysis by Country, 2025 and 2035
  • Figure 110: South Asia & Pacific Market Value Share and BPS Analysis by Type, 2025 and 2035
  • Figure 111: South Asia & Pacific Market Y-o-Y Growth Comparison by Type, 2025-2035
  • Figure 112: South Asia & Pacific Market Attractiveness Analysis by Type
  • Figure 113: South Asia & Pacific Market Value Share and BPS Analysis by Application, 2025 and 2035
  • Figure 114: South Asia & Pacific Market Y-o-Y Growth Comparison by Application, 2025-2035
  • Figure 115: South Asia & Pacific Market Attractiveness Analysis by Application
  • Figure 116: South Asia & Pacific Market Value Share and BPS Analysis by Payload Capacity, 2025 and 2035
  • Figure 117: South Asia & Pacific Market Y-o-Y Growth Comparison by Payload Capacity, 2025-2035
  • Figure 118: South Asia & Pacific Market Attractiveness Analysis by Payload Capacity
  • Figure 119: South Asia & Pacific Market Value Share and BPS Analysis by Body Type, 2025 and 2035
  • Figure 120: South Asia & Pacific Market Y-o-Y Growth Comparison by Body Type, 2025-2035
  • Figure 121: South Asia & Pacific Market Attractiveness Analysis by Body Type
  • Figure 122: South Asia & Pacific Market Value Share and BPS Analysis by Powertrain, 2025 and 2035
  • Figure 123: South Asia & Pacific Market Y-o-Y Growth Comparison by Powertrain, 2025-2035
  • Figure 124: South Asia & Pacific Market Attractiveness Analysis by Powertrain
  • Figure 125: Middle East and Africa Market Value Share and BPS Analysis by Country, 2025 and 2035
  • Figure 126: Middle East and Africa Market Value Share and BPS Analysis by Type, 2025 and 2035
  • Figure 127: Middle East and Africa Market Y-o-Y Growth Comparison by Type, 2025-2035
  • Figure 128: Middle East and Africa Market Attractiveness Analysis by Type
  • Figure 129: Middle East and Africa Market Value Share and BPS Analysis by Application, 2025 and 2035
  • Figure 130: Middle East and Africa Market Y-o-Y Growth Comparison by Application, 2025-2035
  • Figure 131: Middle East and Africa Market Attractiveness Analysis by Application
  • Figure 132: Middle East and Africa Market Value Share and BPS Analysis by Payload Capacity, 2025 and 2035
  • Figure 133: Middle East and Africa Market Y-o-Y Growth Comparison by Payload Capacity, 2025-2035
  • Figure 134: Middle East and Africa Market Attractiveness Analysis by Payload Capacity
  • Figure 135: Middle East and Africa Market Value Share and BPS Analysis by Body Type, 2025 and 2035
  • Figure 136: Middle East and Africa Market Y-o-Y Growth Comparison by Body Type, 2025-2035
  • Figure 137: Middle East and Africa Market Attractiveness Analysis by Body Type
  • Figure 138: Middle East and Africa Market Value Share and BPS Analysis by Powertrain, 2025 and 2035
  • Figure 139: Middle East and Africa Market Y-o-Y Growth Comparison by Powertrain, 2025-2035
  • Figure 140: Middle East and Africa Market Attractiveness Analysis by Powertrain
  • Figure 141: Global Market - Tier Structure Analysis
  • Figure 142: Global Market - Company Share Analysis

Frequently Asked Questions

What is the projected CAGR of the class 4 truck market from 2025 to 2035?

The market is expected to grow at a CAGR of 4.3% during 2025-2035.

What is the estimated market value of the class 4 truck market in 2025?

The market was valued at USD 14.83 billion in 2025.

Which segment holds the largest market share in the class 4 truck market in 2025?

Conventional trucks dominate with a 78% market share in 2025.

Which region holds the highest share of the class 4 truck market globally?

Asia Pacific leads with approximately 46% market share.

What market share does Isuzu hold among class 4 truck manufacturers?

Isuzu holds a 10.5% share of the class 4 truck market.

Explore Similar Insights

Future Market Insights

Class 4 Truck Market