Reports

- Global Locations -

Headquarters

Future Market Insights, Inc.

Christiana Corporate, 200
Continental Drive, Suite 401,
Newark, Delaware - 19713,
United States

T: +1-845-579-5705

Americas

Future Market Insights, Inc.

616 Corporate Way, Suite 2-9018,
Valley Cottage, NY 10989, United States

T: +1-347-918-3531

MEA

Future Market Insights

1602-6 Jumeirah Bay X2 Tower, Plot No: JLT-PH2-X2A,
Jumeirah Lakes Towers, Dubai,
United Arab Emirates

Europe

Future Market Insights

3rd Floor, 207 Regent Street,
W1B 3HH London
United Kingdom

T: + 44 (0) 20 8123 9659
D: +44 (0) 20 3287 4268

Asia Pacific

Future Market Insights

IndiaLand Global Tech Park, Unit UG-1, Behind Grand HighStreet, Phase 1, Hinjawadi, MH, Pune – 411057, India

Caprylic Capric Triglyceride Market Snapshot (2022 to 2032)

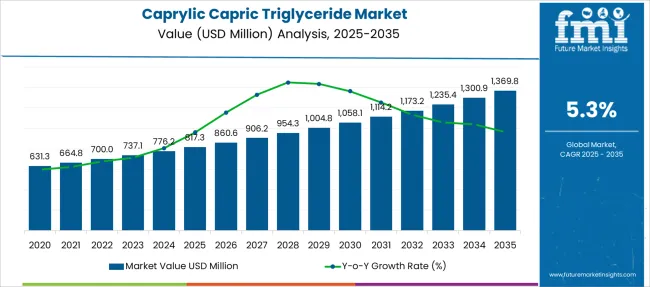
The global caprylic capric triglyceride market is expected to create an incremental opportunity of more than US$ 700 Million by the end of 2022. The demand for caprylic capric triglyceride is estimated to surpass US$ 1,230 Million by 2032, in comparison to the US$ 650 Million registered in the year 2021. The sales of caprylic capric triglyceride are anticipated to rise at a CAGR of around 5% to 6% during the forecast period 2022 to 2032.

Report Attribute Details
Caprylic Capric Triglyceride Market Registered Base Value (2021) US$ 650 Million
Caprylic Capric Triglyceride Market Expected Value (2022) US$ 700 Million
Caprylic Capric Triglyceride Market Anticipated Value (2032) US$ 1,230 Million
Caprylic Capric Triglyceride Market Projected Growth Rate (2022 to 2032) 5% to 6% CAGR

Caprylic capric triglyceride, commonly known as octanoic acid due to the presence of an eight-carbon chain of saturated fatty acid, is an oily liquid, formulated by combining glycerin and coconut oil. It is also naturally found in a minimal amount of palm kernel oil and in the milk of numerous mammals. It is a clear, non-viscous liquid with a rancid-like smell and contains a mix of fatty acids that is partially soluble in water.

Don't pay for what you don't need

Customize your report by selecting specific countries or regions and save 30%!

What are the Drivers Elevating the Sales in the Global Caprylic Capric Triglyceride Market

Caprylic capric triglyceride is gaining huge popularity across the personal care and cosmetics industries, on account of its favorable properties such as skin replenishment, emollient, antioxidant, moisturizing, and non-greasy feel among others. It is extensively being used in various personal care and cosmetics products such as face creams, perfumes, moisturizers, lipstick, foundations, eye makeup, sunscreens, and others.

Hence, accelerating sales of the aforementioned products, owing to the growing consumer spending on enhancing body and facial aesthetics across the world is projected to create high revenue generation opportunities for the caprylic capric triglyceride market.

What are the Key Factors Creating Difficult Roads for the Caprylic Capric Triglyceride Market Growth

There are some side effects associated with the use and consumption of caprylic capric triglycerides such as skin irritation, the development of rashes, gastric distress, nausea, and diarrhea among others. A growing instance of such ailments is impeding sales in the global market.

The high cost of caprylic capric triglyceride and the increasing availability of low-cost substitutes are some of the factors restraining the growth in the market.

Sneha Verghese
Sneha Verghese

Principal Consultant

Talk to Analyst

Find your sweet spots for generating winning opportunities in this market.

What is the Sales Prospect of Caprylic Capric Triglyceride Market in the South Asia Market

As per Future Market Insights, South Asia is estimated to emerge as a highly remunerative market for caprylic capric triglyceride between 2022 and 2032.

Over the last few years, a significant rise in the number of baby births is being witnessed across South Asia, creating strong demand for baby care products. For instance, according to United Nations International Children's Emergency Fund (UNICEF), nearly 67,385 babies are born across India every day.

Due to its high moisturizing, skin nourishing, and antioxidant properties, caprylic capric triglyceride is increasingly used for the production of baby care products such as soaps, massage oil, body lotions, and others. Hence, rising baby births are projected to bolster sales in the South Asia market.
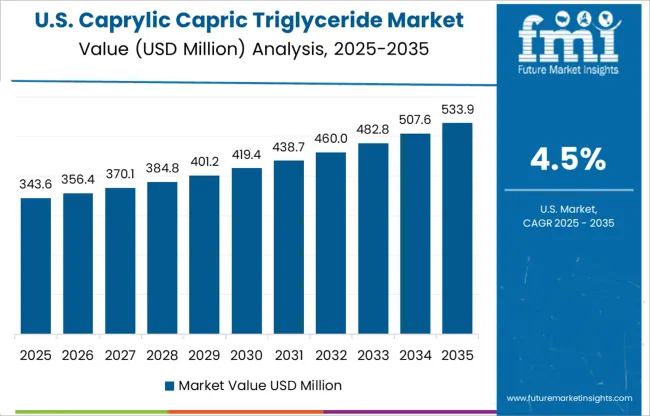
Why is the Demand for Caprylic Capric Triglyceride Augmenting in the North America Market

North America is anticipated to exhibit growth at a rapid CAGR in the global caprylic capric triglyceride market during the forecast period 2022 to 2032, states FMI.

As the trend of adopting clean-label products and inclination toward plant-based & organic personal care & cosmetics products continues to grow across North America, there is a rapid surge in demand for natural sources of essential ingredients such as caprylic capric triglyceride.

On account of the approval by the Food and Drug Administration regarding the use of caprylic capric triglyceride, leading players in the market are emphasizing expanding their production capacity to capitalize on surging demand. This is expected to drive growth in the North American market.
Get the data you need at a Fraction of the cost

Personalize your report by choosing insights you need
and save 40%!

Market Competition

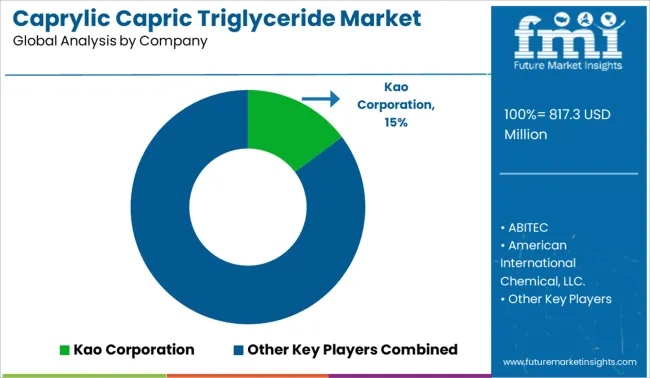
Some of the leading players in the caprylic capric triglyceride market are Kao Corporation, ABITEC, American International Chemical, LLC., Alzo International, Charkit Chemical, Vigon International, Jarchem Industries, Lonza Group, Lipo Chemicals, Penta International, and others.

The market for caprylic capric triglyceride is highly competitive, attributed to the adoption of strategies such as production capacity expansion, collaboration, merger, and acquisition by key companies.

Report Scope

Report Attribute Details
Growth Rate CAGR of 5% to 6% from 2022 to 2032
Base Year for Estimation 2021
Historical Data 2015 to 2020
Forecast Period 2022 to 2032
Quantitative Units Revenue in USD Million, Volume in Kilotons, and CAGR from 2022 to 2032
Report Coverage Revenue Forecast, Volume Forecast, Company Ranking, Competitive Landscape, Growth Factors, Trends, and Pricing Analysis
Segments Covered
  • Form
  • Source
  • Application
  • End Use
  • Region
Countries Covered
  • North America
  • Latin America
  • Europe
  • East Asia
  • South Asia
  • Oceania
  • Middle East and Africa
Key Companies Profiled
  • Kao Corporation
  • ABITEC
  • American International Chemical, LLC.
  • Alzo International
  • Charkit Chemical
  • Vigon International
  • Jarchem Industries
  • Lonza Group
  • Lipo Chemicals
  • Penta International
  • Others
Customization Available Upon Request

Key Segments Profiled in the Caprylic Capric Triglyceride Market Survey

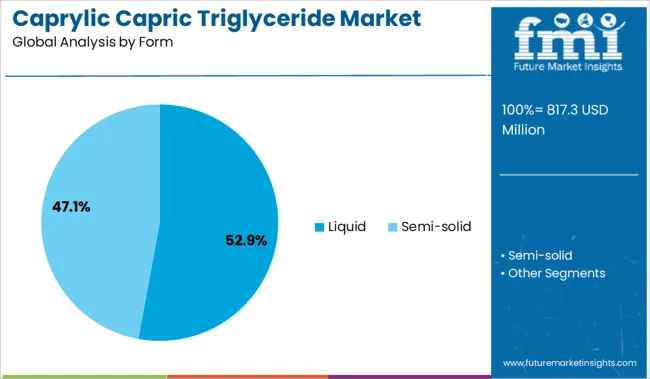
By Form:

  • Liquid
  • Semi-solid

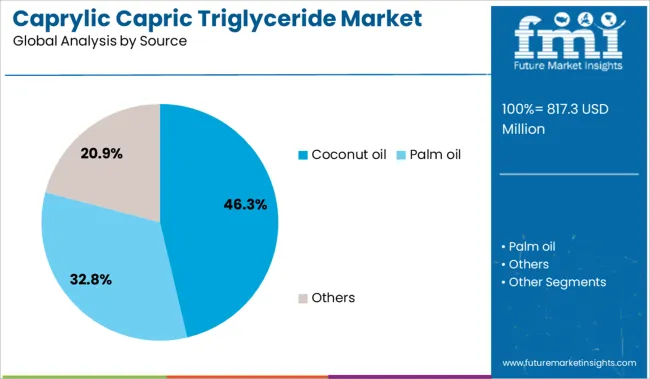
By Source:

  • Coconut oil
  • Palm oil
  • Others

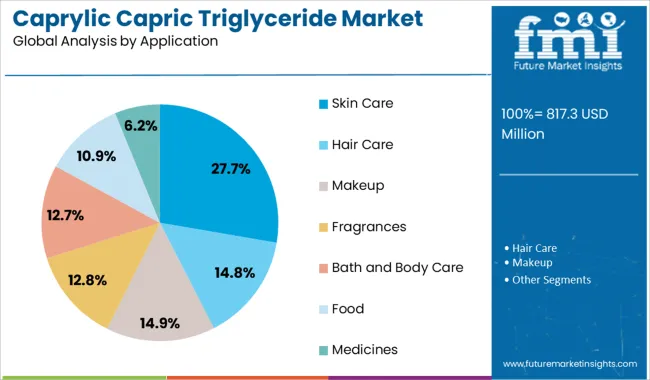
By Application:

  • Skin Care
  • Hair Care
  • Makeup
  • Fragrances
  • Bath and Body Care
  • Food
  • Medicines

By End Use:

  • Cosmetic and Personal Care Industry
  • Pharmaceutical Industry
  • Food and Beverage Industry
  • Health and Wellness Industry
  • Others

By Region:

  • North America
  • Latin America
  • Europe
  • East Asia
  • South Asia
  • Oceania
  • Middle East and Africa

Frequently Asked Questions

What is the sales forecast for caprylic capric triglyceride in the global market until 2032?

FMI projects the sales of caprylic capric triglyceride in the market are expected to rise at 5% to 6% value CAGR by 2032

Which region is forecast to be the most lucrative for caprylic capric triglyceride market growth?

The global caprylic capric triglyceride market is expected to be dominated by South Asia over the forecast period 2022 to 2032.

Which are some leading caprylic capric triglyceride manufacturers?

Kao Corporation, ABITEC, American International Chemical, LLC., Alzo International, Charkit Chemical, Vigon International, Jarchem Industries, Lonza Group, Lipo Chemicals, Penta International, and others are some of the leading players in the prominent caprylic capric triglyceride market.

Table of Content

1. Executive Summary | Caprylic Capric Triglyceride Market

    1.1. Global Market Outlook

    1.2. Demand-side Trends

    1.3. Supply-side Trends

    1.4. Technology Roadmap Analysis

    1.5. Analysis and Recommendations

2. Market Overview

    2.1. Market Coverage / Taxonomy

    2.2. Market Definition / Scope / Limitations

3. Market Background

    3.1. Market Dynamics

        3.1.1. Drivers

        3.1.2. Restraints

        3.1.3. Opportunity

        3.1.4. Trends

    3.2. Scenario Forecast

        3.2.1. Demand in Optimistic Scenario

        3.2.2. Demand in Likely Scenario

        3.2.3. Demand in Conservative Scenario

    3.3. Opportunity Map Analysis

    3.4. Investment Feasibility Matrix

    3.5. PESTLE and Porter’s Analysis

    3.6. Regulatory Landscape

        3.6.1. By Key Regions

        3.6.2. By Key Countries

4. Global Market Analysis 2017 to 2021 and Forecast, 2022 to 2032

    4.1. Historical Market Size Value (US$ Million) & VolumeAnalysis, 2017 to 2021

    4.2. Current and Future Market Size Value (US$ Million) & VolumeProjections, 2022 to 2032

        4.2.1. Y-o-Y Growth Trend Analysis

        4.2.2. Absolute $ Opportunity Analysis

5. Global Market Analysis 2017 to 2021 and Forecast 2022 to 2032, By By Form

    5.1. Introduction / Key Findings

    5.2. Historical Market Size Value (US$ Million) & VolumeAnalysis By By Form, 2017 to 2021

    5.3. Current and Future Market Size Value (US$ Million) & VolumeAnalysis and Forecast By By Form, 2022 to 2032

        5.3.1. Liquid

        5.3.2. Semi-solid

    5.4. Y-o-Y Growth Trend Analysis By By Form, 2017 to 2021

    5.5. Absolute $ Opportunity Analysis By By Form, 2022 to 2032

6. Global Market Analysis 2017 to 2021 and Forecast 2022 to 2032, By By Source

    6.1. Introduction / Key Findings

    6.2. Historical Market Size Value (US$ Million) & VolumeAnalysis By By Source, 2017 to 2021

    6.3. Current and Future Market Size Value (US$ Million) & VolumeAnalysis and Forecast By By Source, 2022 to 2032

        6.3.1. Coconut oil

        6.3.2. Palm oil

        6.3.3. Others

    6.4. Y-o-Y Growth Trend Analysis By By Source, 2017 to 2021

    6.5. Absolute $ Opportunity Analysis By By Source, 2022 to 2032

7. Global Market Analysis 2017 to 2021 and Forecast 2022 to 2032, By Application

    7.1. Introduction / Key Findings

    7.2. Historical Market Size Value (US$ Million) & VolumeAnalysis By Application, 2017 to 2021

    7.3. Current and Future Market Size Value (US$ Million) & VolumeAnalysis and Forecast By Application, 2022 to 2032

        7.3.1. Skin Care

        7.3.2. Hair Care

        7.3.3. Makeup

        7.3.4. Fragrances

        7.3.5. Bath and Body Care

        7.3.6. Food

        7.3.7. Medicines

    7.4. Y-o-Y Growth Trend Analysis By Application, 2017 to 2021

    7.5. Absolute $ Opportunity Analysis By Application, 2022 to 2032

8. Global Market Analysis 2017 to 2021 and Forecast 2022 to 2032, ByEnd Use

    8.1. Introduction / Key Findings

    8.2. Historical Market Size Value (US$ Million) & VolumeAnalysis ByEnd Use, 2017 to 2021

    8.3. Current and Future Market Size Value (US$ Million) & VolumeAnalysis and Forecast ByEnd Use, 2022 to 2032

        8.3.1. Cosmetic and Personal Care Industry

        8.3.2. Pharmaceutical Industry

        8.3.3. Food and Beverage Industry

        8.3.4. Health and Wellness Industry

        8.3.5. Others

    8.4. Y-o-Y Growth Trend Analysis ByEnd Use, 2017 to 2021

    8.5. Absolute $ Opportunity Analysis ByEnd Use, 2022 to 2032

9. Global Market Analysis 2017 to 2021 and Forecast 2022 to 2032, By Region

    9.1. Introduction

    9.2. Historical Market Size Value (US$ Million) & VolumeAnalysis By Region, 2017 to 2021

    9.3. Current Market Size Value (US$ Million) & VolumeAnalysis and Forecast By Region, 2022 to 2032

        9.3.1. North America

        9.3.2. Latin America

        9.3.3. Europe

        9.3.4. East Asia

        9.3.5. South Asia

        9.3.6. Oceania

        9.3.7. Middle East and Africa

    9.4. Market Attractiveness Analysis By Region

10. North America Market Analysis 2017 to 2021 and Forecast 2022 to 2032, By Country

    10.1. Historical Market Size Value (US$ Million) & VolumeTrend Analysis By Market Taxonomy, 2017 to 2021

    10.2. Market Size Value (US$ Million) & VolumeForecast By Market Taxonomy, 2022 to 2032

        10.2.1. By Country

            10.2.1.1. USA

            10.2.1.2. Canada

        10.2.2. By By Form

        10.2.3. By By Source

        10.2.4. By Application

        10.2.5. ByEnd Use

    10.3. Market Attractiveness Analysis

        10.3.1. By Country

        10.3.2. By By Form

        10.3.3. By By Source

        10.3.4. By Application

        10.3.5. ByEnd Use

    10.4. Key Takeaways

11. Latin America Market Analysis 2017 to 2021 and Forecast 2022 to 2032, By Country

    11.1. Historical Market Size Value (US$ Million) & VolumeTrend Analysis By Market Taxonomy, 2017 to 2021

    11.2. Market Size Value (US$ Million) & VolumeForecast By Market Taxonomy, 2022 to 2032

        11.2.1. By Country

            11.2.1.1. Brazil

            11.2.1.2. Mexico

            11.2.1.3. Rest of Latin America

        11.2.2. By By Form

        11.2.3. By By Source

        11.2.4. By Application

        11.2.5. ByEnd Use

    11.3. Market Attractiveness Analysis

        11.3.1. By Country

        11.3.2. By By Form

        11.3.3. By By Source

        11.3.4. By Application

        11.3.5. ByEnd Use

    11.4. Key Takeaways

12. Europe Market Analysis 2017 to 2021 and Forecast 2022 to 2032, By Country

    12.1. Historical Market Size Value (US$ Million) & VolumeTrend Analysis By Market Taxonomy, 2017 to 2021

    12.2. Market Size Value (US$ Million) & VolumeForecast By Market Taxonomy, 2022 to 2032

        12.2.1. By Country

            12.2.1.1. Germany

            12.2.1.2. Italy

            12.2.1.3. France

            12.2.1.4. United Kingdom

            12.2.1.5. Spain

            12.2.1.6. Russia

            12.2.1.7. BENELUX

            12.2.1.8. Rest of Europe

        12.2.2. By By Form

        12.2.3. By By Source

        12.2.4. By Application

        12.2.5. ByEnd Use

    12.3. Market Attractiveness Analysis

        12.3.1. By Country

        12.3.2. By By Form

        12.3.3. By By Source

        12.3.4. By Application

        12.3.5. ByEnd Use

    12.4. Key Takeaways

13. East Asia Market Analysis 2017 to 2021 and Forecast 2022 to 2032, By Country

    13.1. Historical Market Size Value (US$ Million) & VolumeTrend Analysis By Market Taxonomy, 2017 to 2021

    13.2. Market Size Value (US$ Million) & VolumeForecast By Market Taxonomy, 2022 to 2032

        13.2.1. By Country

            13.2.1.1. China

            13.2.1.2. Japan

            13.2.1.3. South Korea

        13.2.2. By By Form

        13.2.3. By By Source

        13.2.4. By Application

        13.2.5. ByEnd Use

    13.3. Market Attractiveness Analysis

        13.3.1. By Country

        13.3.2. By By Form

        13.3.3. By By Source

        13.3.4. By Application

        13.3.5. ByEnd Use

    13.4. Key Takeaways

14. South Asia Market Analysis 2017 to 2021 and Forecast 2022 to 2032, By Country

    14.1. Historical Market Size Value (US$ Million) & VolumeTrend Analysis By Market Taxonomy, 2017 to 2021

    14.2. Market Size Value (US$ Million) & VolumeForecast By Market Taxonomy, 2022 to 2032

        14.2.1. By Country

            14.2.1.1. India

            14.2.1.2. Thailand

            14.2.1.3. Malaysia

            14.2.1.4. Indonesia

            14.2.1.5. Rest of South Asia

        14.2.2. By By Form

        14.2.3. By By Source

        14.2.4. By Application

        14.2.5. ByEnd Use

    14.3. Market Attractiveness Analysis

        14.3.1. By Country

        14.3.2. By By Form

        14.3.3. By By Source

        14.3.4. By Application

        14.3.5. ByEnd Use

    14.4. Key Takeaways

15. Oceania Market Analysis 2017 to 2021 and Forecast 2022 to 2032, By Country

    15.1. Historical Market Size Value (US$ Million) & VolumeTrend Analysis By Market Taxonomy, 2017 to 2021

    15.2. Market Size Value (US$ Million) & VolumeForecast By Market Taxonomy, 2022 to 2032

        15.2.1. By Country

            15.2.1.1. Australia

            15.2.1.2. New Zealand

        15.2.2. By By Form

        15.2.3. By By Source

        15.2.4. By Application

        15.2.5. ByEnd Use

    15.3. Market Attractiveness Analysis

        15.3.1. By Country

        15.3.2. By By Form

        15.3.3. By By Source

        15.3.4. By Application

        15.3.5. ByEnd Use

    15.4. Key Takeaways

16. Middle East and Africa Market Analysis 2017 to 2021 and Forecast 2022 to 2032, By Country

    16.1. Historical Market Size Value (US$ Million) & VolumeTrend Analysis By Market Taxonomy, 2017 to 2021

    16.2. Market Size Value (US$ Million) & VolumeForecast By Market Taxonomy, 2022 to 2032

        16.2.1. By Country

            16.2.1.1. GCC Countries

            16.2.1.2. Turkey

            16.2.1.3. Israel

            16.2.1.4. South Africa

            16.2.1.5. Egypt

            16.2.1.6. Rest of Middle East and Africa

        16.2.2. By By Form

        16.2.3. By By Source

        16.2.4. By Application

        16.2.5. ByEnd Use

    16.3. Market Attractiveness Analysis

        16.3.1. By Country

        16.3.2. By By Form

        16.3.3. By By Source

        16.3.4. By Application

        16.3.5. ByEnd Use

    16.4. Key Takeaways

17. Key Countries Market Analysis

    17.1. USA

        17.1.1. Pricing Analysis

        17.1.2. Market Share Analysis, 2021

            17.1.2.1. By By Form

            17.1.2.2. By By Source

            17.1.2.3. By Application

            17.1.2.4. ByEnd Use

    17.2. Canada

        17.2.1. Pricing Analysis

        17.2.2. Market Share Analysis, 2021

            17.2.2.1. By By Form

            17.2.2.2. By By Source

            17.2.2.3. By Application

            17.2.2.4. ByEnd Use

    17.3. Brazil

        17.3.1. Pricing Analysis

        17.3.2. Market Share Analysis, 2021

            17.3.2.1. By By Form

            17.3.2.2. By By Source

            17.3.2.3. By Application

            17.3.2.4. ByEnd Use

    17.4. Mexico

        17.4.1. Pricing Analysis

        17.4.2. Market Share Analysis, 2021

            17.4.2.1. By By Form

            17.4.2.2. By By Source

            17.4.2.3. By Application

            17.4.2.4. ByEnd Use

    17.5. Argentina

        17.5.1. Pricing Analysis

        17.5.2. Market Share Analysis, 2021

            17.5.2.1. By By Form

            17.5.2.2. By By Source

            17.5.2.3. By Application

            17.5.2.4. ByEnd Use

    17.6. Germany

        17.6.1. Pricing Analysis

        17.6.2. Market Share Analysis, 2021

            17.6.2.1. By By Form

            17.6.2.2. By By Source

            17.6.2.3. By Application

            17.6.2.4. ByEnd Use

    17.7. Italy

        17.7.1. Pricing Analysis

        17.7.2. Market Share Analysis, 2021

            17.7.2.1. By By Form

            17.7.2.2. By By Source

            17.7.2.3. By Application

            17.7.2.4. ByEnd Use

    17.8. France

        17.8.1. Pricing Analysis

        17.8.2. Market Share Analysis, 2021

            17.8.2.1. By By Form

            17.8.2.2. By By Source

            17.8.2.3. By Application

            17.8.2.4. ByEnd Use

    17.9. United Kingdom

        17.9.1. Pricing Analysis

        17.9.2. Market Share Analysis, 2021

            17.9.2.1. By By Form

            17.9.2.2. By By Source

            17.9.2.3. By Application

            17.9.2.4. ByEnd Use

    17.10. Spain

        17.10.1. Pricing Analysis

        17.10.2. Market Share Analysis, 2021

            17.10.2.1. By By Form

            17.10.2.2. By By Source

            17.10.2.3. By Application

            17.10.2.4. ByEnd Use

    17.11. Russia

        17.11.1. Pricing Analysis

        17.11.2. Market Share Analysis, 2021

            17.11.2.1. By By Form

            17.11.2.2. By By Source

            17.11.2.3. By Application

            17.11.2.4. ByEnd Use

    17.12. BENELUX

        17.12.1. Pricing Analysis

        17.12.2. Market Share Analysis, 2021

            17.12.2.1. By By Form

            17.12.2.2. By By Source

            17.12.2.3. By Application

            17.12.2.4. ByEnd Use

    17.13. China

        17.13.1. Pricing Analysis

        17.13.2. Market Share Analysis, 2021

            17.13.2.1. By By Form

            17.13.2.2. By By Source

            17.13.2.3. By Application

            17.13.2.4. ByEnd Use

    17.14. Japan

        17.14.1. Pricing Analysis

        17.14.2. Market Share Analysis, 2021

            17.14.2.1. By By Form

            17.14.2.2. By By Source

            17.14.2.3. By Application

            17.14.2.4. ByEnd Use

    17.15. South Korea

        17.15.1. Pricing Analysis

        17.15.2. Market Share Analysis, 2021

            17.15.2.1. By By Form

            17.15.2.2. By By Source

            17.15.2.3. By Application

            17.15.2.4. ByEnd Use

    17.16. India

        17.16.1. Pricing Analysis

        17.16.2. Market Share Analysis, 2021

            17.16.2.1. By By Form

            17.16.2.2. By By Source

            17.16.2.3. By Application

            17.16.2.4. ByEnd Use

    17.17. GCC Countries

        17.17.1. Pricing Analysis

        17.17.2. Market Share Analysis, 2021

            17.17.2.1. By By Form

            17.17.2.2. By By Source

            17.17.2.3. By Application

            17.17.2.4. ByEnd Use

    17.18. Turkey

        17.18.1. Pricing Analysis

        17.18.2. Market Share Analysis, 2021

            17.18.2.1. By By Form

            17.18.2.2. By By Source

            17.18.2.3. By Application

            17.18.2.4. ByEnd Use

    17.19. Israel

        17.19.1. Pricing Analysis

        17.19.2. Market Share Analysis, 2021

            17.19.2.1. By By Form

            17.19.2.2. By By Source

            17.19.2.3. By Application

            17.19.2.4. ByEnd Use

    17.20. South Africa

        17.20.1. Pricing Analysis

        17.20.2. Market Share Analysis, 2021

            17.20.2.1. By By Form

            17.20.2.2. By By Source

            17.20.2.3. By Application

            17.20.2.4. ByEnd Use

    17.21. Egypt

        17.21.1. Pricing Analysis

        17.21.2. Market Share Analysis, 2021

            17.21.2.1. By By Form

            17.21.2.2. By By Source

            17.21.2.3. By Application

            17.21.2.4. ByEnd Use

18. Market Structure Analysis

    18.1. Competition Dashboard

    18.2. Competition Benchmarking

    18.3. Market Share Analysis of Top Players

        18.3.1. By Regional

        18.3.2. By By Form

        18.3.3. By By Source

        18.3.4. By Application

        18.3.5. ByEnd Use

19. Competition Analysis

    19.1. Competition Deep Dive

        19.1.1. Kao Corporation

            19.1.1.1. Overview

            19.1.1.2. Product Portfolio

            19.1.1.3. Profitability by Market Segment

            19.1.1.4. Sales Footprint

            19.1.1.5. Strategy Overview

                19.1.1.5.1. Marketing Strategy

                19.1.1.5.2. Product Strategy

        19.1.2. ABITEC

            19.1.2.1. Overview

            19.1.2.2. Product Portfolio

            19.1.2.3. Profitability by Market Segment

            19.1.2.4. Sales Footprint

            19.1.2.5. Strategy Overview

                19.1.2.5.1. Marketing Strategy

                19.1.2.5.2. Product Strategy

        19.1.3. American International Chemical, LLC.

            19.1.3.1. Overview

            19.1.3.2. Product Portfolio

            19.1.3.3. Profitability by Market Segment

            19.1.3.4. Sales Footprint

            19.1.3.5. Strategy Overview

                19.1.3.5.1. Marketing Strategy

                19.1.3.5.2. Product Strategy

        19.1.4. Alzo International

            19.1.4.1. Overview

            19.1.4.2. Product Portfolio

            19.1.4.3. Profitability by Market Segment

            19.1.4.4. Sales Footprint

            19.1.4.5. Strategy Overview

                19.1.4.5.1. Marketing Strategy

                19.1.4.5.2. Product Strategy

        19.1.5. Charkit Chemical

            19.1.5.1. Overview

            19.1.5.2. Product Portfolio

            19.1.5.3. Profitability by Market Segment

            19.1.5.4. Sales Footprint

            19.1.5.5. Strategy Overview

                19.1.5.5.1. Marketing Strategy

                19.1.5.5.2. Product Strategy

        19.1.6. Vigon International

            19.1.6.1. Overview

            19.1.6.2. Product Portfolio

            19.1.6.3. Profitability by Market Segment

            19.1.6.4. Sales Footprint

            19.1.6.5. Strategy Overview

                19.1.6.5.1. Marketing Strategy

                19.1.6.5.2. Product Strategy

        19.1.7. Jarchem Industries

            19.1.7.1. Overview

            19.1.7.2. Product Portfolio

            19.1.7.3. Profitability by Market Segment

            19.1.7.4. Sales Footprint

            19.1.7.5. Strategy Overview

                19.1.7.5.1. Marketing Strategy

                19.1.7.5.2. Product Strategy

        19.1.8. Lonza Group

            19.1.8.1. Overview

            19.1.8.2. Product Portfolio

            19.1.8.3. Profitability by Market Segment

            19.1.8.4. Sales Footprint

            19.1.8.5. Strategy Overview

                19.1.8.5.1. Marketing Strategy

                19.1.8.5.2. Product Strategy

        19.1.9. Lipo Chemicals

            19.1.9.1. Overview

            19.1.9.2. Product Portfolio

            19.1.9.3. Profitability by Market Segment

            19.1.9.4. Sales Footprint

            19.1.9.5. Strategy Overview

                19.1.9.5.1. Marketing Strategy

                19.1.9.5.2. Product Strategy

        19.1.10. Penta International

            19.1.10.1. Overview

            19.1.10.2. Product Portfolio

            19.1.10.3. Profitability by Market Segment

            19.1.10.4. Sales Footprint

            19.1.10.5. Strategy Overview

                19.1.10.5.1. Marketing Strategy

                19.1.10.5.2. Product Strategy

        19.1.11. Croda International plc

            19.1.11.1. Overview

            19.1.11.2. Product Portfolio

            19.1.11.3. Profitability by Market Segment

            19.1.11.4. Sales Footprint

            19.1.11.5. Strategy Overview

                19.1.11.5.1. Marketing Strategy

                19.1.11.5.2. Product Strategy

        19.1.12. Oleon NV

            19.1.12.1. Overview

            19.1.12.2. Product Portfolio

            19.1.12.3. Profitability by Market Segment

            19.1.12.4. Sales Footprint

            19.1.12.5. Strategy Overview

                19.1.12.5.1. Marketing Strategy

                19.1.12.5.2. Product Strategy

        19.1.13. Ecogreen Oleochemicals

            19.1.13.1. Overview

            19.1.13.2. Product Portfolio

            19.1.13.3. Profitability by Market Segment

            19.1.13.4. Sales Footprint

            19.1.13.5. Strategy Overview

                19.1.13.5.1. Marketing Strategy

                19.1.13.5.2. Product Strategy

        19.1.14. Peter Cremer North America

            19.1.14.1. Overview

            19.1.14.2. Product Portfolio

            19.1.14.3. Profitability by Market Segment

            19.1.14.4. Sales Footprint

            19.1.14.5. Strategy Overview

                19.1.14.5.1. Marketing Strategy

                19.1.14.5.2. Product Strategy

        19.1.15. IOI Oleo GmbH

            19.1.15.1. Overview

            19.1.15.2. Product Portfolio

            19.1.15.3. Profitability by Market Segment

            19.1.15.4. Sales Footprint

            19.1.15.5. Strategy Overview

                19.1.15.5.1. Marketing Strategy

                19.1.15.5.2. Product Strategy

        19.1.16. KLK Oleo

            19.1.16.1. Overview

            19.1.16.2. Product Portfolio

            19.1.16.3. Profitability by Market Segment

            19.1.16.4. Sales Footprint

            19.1.16.5. Strategy Overview

                19.1.16.5.1. Marketing Strategy

                19.1.16.5.2. Product Strategy

        19.1.17. Oxiteno

            19.1.17.1. Overview

            19.1.17.2. Product Portfolio

            19.1.17.3. Profitability by Market Segment

            19.1.17.4. Sales Footprint

            19.1.17.5. Strategy Overview

                19.1.17.5.1. Marketing Strategy

                19.1.17.5.2. Product Strategy

        19.1.18. BERG + SCHMIDT GmbH & CO.

            19.1.18.1. Overview

            19.1.18.2. Product Portfolio

            19.1.18.3. Profitability by Market Segment

            19.1.18.4. Sales Footprint

            19.1.18.5. Strategy Overview

                19.1.18.5.1. Marketing Strategy

                19.1.18.5.2. Product Strategy

20. Assumptions & Acronyms Used

21. Research Methodology

Don't pay for what you don't need

Customize your report by selecting specific countries or regions and save 30%!

List of Tables

Table 1: Global Market Value (US$ Million) Forecast by Region, 2017 to 2032

Table 2: Global Market Volume Forecast by Region, 2017 to 2032

Table 3: Global Market Value (US$ Million) Forecast by By Form, 2017 to 2032

Table 4: Global Market Volume Forecast by By Form, 2017 to 2032

Table 5: Global Market Value (US$ Million) Forecast by By Source, 2017 to 2032

Table 6: Global Market Volume Forecast by By Source, 2017 to 2032

Table 7: Global Market Value (US$ Million) Forecast by Application, 2017 to 2032

Table 8: Global Market Volume Forecast by Application, 2017 to 2032

Table 9: Global Market Value (US$ Million) Forecast by End Use, 2017 to 2032

Table 10: Global Market Volume Forecast by End Use, 2017 to 2032

Table 11: North America Market Value (US$ Million) Forecast by Country, 2017 to 2032

Table 12: North America Market Volume Forecast by Country, 2017 to 2032

Table 13: North America Market Value (US$ Million) Forecast by By Form, 2017 to 2032

Table 14: North America Market Volume Forecast by By Form, 2017 to 2032

Table 15: North America Market Value (US$ Million) Forecast by By Source, 2017 to 2032

Table 16: North America Market Volume Forecast by By Source, 2017 to 2032

Table 17: North America Market Value (US$ Million) Forecast by Application, 2017 to 2032

Table 18: North America Market Volume Forecast by Application, 2017 to 2032

Table 19: North America Market Value (US$ Million) Forecast by End Use, 2017 to 2032

Table 20: North America Market Volume Forecast by End Use, 2017 to 2032

Table 21: Latin America Market Value (US$ Million) Forecast by Country, 2017 to 2032

Table 22: Latin America Market Volume Forecast by Country, 2017 to 2032

Table 23: Latin America Market Value (US$ Million) Forecast by By Form, 2017 to 2032

Table 24: Latin America Market Volume Forecast by By Form, 2017 to 2032

Table 25: Latin America Market Value (US$ Million) Forecast by By Source, 2017 to 2032

Table 26: Latin America Market Volume Forecast by By Source, 2017 to 2032

Table 27: Latin America Market Value (US$ Million) Forecast by Application, 2017 to 2032

Table 28: Latin America Market Volume Forecast by Application, 2017 to 2032

Table 29: Latin America Market Value (US$ Million) Forecast by End Use, 2017 to 2032

Table 30: Latin America Market Volume Forecast by End Use, 2017 to 2032

Table 31: Europe Market Value (US$ Million) Forecast by Country, 2017 to 2032

Table 32: Europe Market Volume Forecast by Country, 2017 to 2032

Table 33: Europe Market Value (US$ Million) Forecast by By Form, 2017 to 2032

Table 34: Europe Market Volume Forecast by By Form, 2017 to 2032

Table 35: Europe Market Value (US$ Million) Forecast by By Source, 2017 to 2032

Table 36: Europe Market Volume Forecast by By Source, 2017 to 2032

Table 37: Europe Market Value (US$ Million) Forecast by Application, 2017 to 2032

Table 38: Europe Market Volume Forecast by Application, 2017 to 2032

Table 39: Europe Market Value (US$ Million) Forecast by End Use, 2017 to 2032

Table 40: Europe Market Volume Forecast by End Use, 2017 to 2032

Table 41: East Asia Market Value (US$ Million) Forecast by Country, 2017 to 2032

Table 42: East Asia Market Volume Forecast by Country, 2017 to 2032

Table 43: East Asia Market Value (US$ Million) Forecast by By Form, 2017 to 2032

Table 44: East Asia Market Volume Forecast by By Form, 2017 to 2032

Table 45: East Asia Market Value (US$ Million) Forecast by By Source, 2017 to 2032

Table 46: East Asia Market Volume Forecast by By Source, 2017 to 2032

Table 47: East Asia Market Value (US$ Million) Forecast by Application, 2017 to 2032

Table 48: East Asia Market Volume Forecast by Application, 2017 to 2032

Table 49: East Asia Market Value (US$ Million) Forecast by End Use, 2017 to 2032

Table 50: East Asia Market Volume Forecast by End Use, 2017 to 2032

Table 51: South Asia Market Value (US$ Million) Forecast by Country, 2017 to 2032

Table 52: South Asia Market Volume Forecast by Country, 2017 to 2032

Table 53: South Asia Market Value (US$ Million) Forecast by By Form, 2017 to 2032

Table 54: South Asia Market Volume Forecast by By Form, 2017 to 2032

Table 55: South Asia Market Value (US$ Million) Forecast by By Source, 2017 to 2032

Table 56: South Asia Market Volume Forecast by By Source, 2017 to 2032

Table 57: South Asia Market Value (US$ Million) Forecast by Application, 2017 to 2032

Table 58: South Asia Market Volume Forecast by Application, 2017 to 2032

Table 59: South Asia Market Value (US$ Million) Forecast by End Use, 2017 to 2032

Table 60: South Asia Market Volume Forecast by End Use, 2017 to 2032

Table 61: Oceania Market Value (US$ Million) Forecast by Country, 2017 to 2032

Table 62: Oceania Market Volume Forecast by Country, 2017 to 2032

Table 63: Oceania Market Value (US$ Million) Forecast by By Form, 2017 to 2032

Table 64: Oceania Market Volume Forecast by By Form, 2017 to 2032

Table 65: Oceania Market Value (US$ Million) Forecast by By Source, 2017 to 2032

Table 66: Oceania Market Volume Forecast by By Source, 2017 to 2032

Table 67: Oceania Market Value (US$ Million) Forecast by Application, 2017 to 2032

Table 68: Oceania Market Volume Forecast by Application, 2017 to 2032

Table 69: Oceania Market Value (US$ Million) Forecast by End Use, 2017 to 2032

Table 70: Oceania Market Volume Forecast by End Use, 2017 to 2032

Table 71: MEA Market Value (US$ Million) Forecast by Country, 2017 to 2032

Table 72: MEA Market Volume Forecast by Country, 2017 to 2032

Table 73: MEA Market Value (US$ Million) Forecast by By Form, 2017 to 2032

Table 74: MEA Market Volume Forecast by By Form, 2017 to 2032

Table 75: MEA Market Value (US$ Million) Forecast by By Source, 2017 to 2032

Table 76: MEA Market Volume Forecast by By Source, 2017 to 2032

Table 77: MEA Market Value (US$ Million) Forecast by Application, 2017 to 2032

Table 78: MEA Market Volume Forecast by Application, 2017 to 2032

Table 79: MEA Market Value (US$ Million) Forecast by End Use, 2017 to 2032
Sneha Verghese
Sneha Verghese

Principal Consultant

Talk to Analyst

Find your sweet spots for generating winning opportunities in this market.

List of Charts

Figure 1: Global Market Value (US$ Million) by By Form, 2022 to 2032

Figure 2: Global Market Value (US$ Million) by By Source, 2022 to 2032

Figure 3: Global Market Value (US$ Million) by Application, 2022 to 2032

Figure 4: Global Market Value (US$ Million) by End Use, 2022 to 2032

Figure 5: Global Market Value (US$ Million) by Region, 2022 to 2032

Figure 6: Global Market Value (US$ Million) Analysis by Region, 2017 to 2032

Figure 7: Global Market Volume Analysis by Region, 2017 to 2032

Figure 8: Global Market Value Share (%) and BPS Analysis by Region, 2022 to 2032

Figure 9: Global Market Y-o-Y Growth (%) Projections by Region, 2022 to 2032

Figure 10: Global Market Value (US$ Million) Analysis by By Form, 2017 to 2032

Figure 11: Global Market Volume Analysis by By Form, 2017 to 2032

Figure 12: Global Market Value Share (%) and BPS Analysis by By Form, 2022 to 2032

Figure 13: Global Market Y-o-Y Growth (%) Projections by By Form, 2022 to 2032

Figure 14: Global Market Value (US$ Million) Analysis by By Source, 2017 to 2032

Figure 15: Global Market Volume Analysis by By Source, 2017 to 2032

Figure 16: Global Market Value Share (%) and BPS Analysis by By Source, 2022 to 2032

Figure 17: Global Market Y-o-Y Growth (%) Projections by By Source, 2022 to 2032

Figure 18: Global Market Value (US$ Million) Analysis by Application, 2017 to 2032

Figure 19: Global Market Volume Analysis by Application, 2017 to 2032

Figure 20: Global Market Value Share (%) and BPS Analysis by Application, 2022 to 2032

Figure 21: Global Market Y-o-Y Growth (%) Projections by Application, 2022 to 2032

Figure 22: Global Market Value (US$ Million) Analysis by End Use, 2017 to 2032

Figure 23: Global Market Volume Analysis by End Use, 2017 to 2032

Figure 24: Global Market Value Share (%) and BPS Analysis by End Use, 2022 to 2032

Figure 25: Global Market Y-o-Y Growth (%) Projections by End Use, 2022 to 2032

Figure 26: Global Market Attractiveness by By Form, 2022 to 2032

Figure 27: Global Market Attractiveness By Source, 2022 to 2032

Figure 28: Global Market Attractiveness by Application, 2022 to 2032

Figure 29: Global Market Attractiveness by End Use, 2022 to 2032

Figure 30: Global Market Attractiveness by Region, 2022 to 2032

Figure 31: North America Market Value (US$ Million) by By Form, 2022 to 2032

Figure 32: North America Market Value (US$ Million) by By Source, 2022 to 2032

Figure 33: North America Market Value (US$ Million) by Application, 2022 to 2032

Figure 34: North America Market Value (US$ Million) by End Use, 2022 to 2032

Figure 35: North America Market Value (US$ Million) by Country, 2022 to 2032

Figure 36: North America Market Value (US$ Million) Analysis by Country, 2017 to 2032

Figure 37: North America Market Volume Analysis by Country, 2017 to 2032

Figure 38: North America Market Value Share (%) and BPS Analysis by Country, 2022 to 2032

Figure 39: North America Market Y-o-Y Growth (%) Projections by Country, 2022 to 2032

Figure 40: North America Market Value (US$ Million) Analysis by By Form, 2017 to 2032

Figure 41: North America Market Volume Analysis by By Form, 2017 to 2032

Figure 42: North America Market Value Share (%) and BPS Analysis by By Form, 2022 to 2032

Figure 43: North America Market Y-o-Y Growth (%) Projections by By Form, 2022 to 2032

Figure 44: North America Market Value (US$ Million) Analysis by By Source, 2017 to 2032

Figure 45: North America Market Volume Analysis by By Source, 2017 to 2032

Figure 46: North America Market Value Share (%) and BPS Analysis by By Source, 2022 to 2032

Figure 47: North America Market Y-o-Y Growth (%) Projections by By Source, 2022 to 2032

Figure 48: North America Market Value (US$ Million) Analysis by Application, 2017 to 2032

Figure 49: North America Market Volume Analysis by Application, 2017 to 2032

Figure 50: North America Market Value Share (%) and BPS Analysis by Application, 2022 to 2032

Figure 51: North America Market Y-o-Y Growth (%) Projections by Application, 2022 to 2032

Figure 52: North America Market Value (US$ Million) Analysis by End Use, 2017 to 2032

Figure 53: North America Market Volume Analysis by End Use, 2017 to 2032

Figure 54: North America Market Value Share (%) and BPS Analysis by End Use, 2022 to 2032

Figure 55: North America Market Y-o-Y Growth (%) Projections by End Use, 2022 to 2032

Figure 56: North America Market Attractiveness by By Form, 2022 to 2032

Figure 57: North America Market Attractiveness by By Source, 2022 to 2032

Figure 58: North America Market Attractiveness by Application, 2022 to 2032

Figure 59: North America Market Attractiveness by End Use, 2022 to 2032

Figure 60: North America Market Attractiveness by Country, 2022 to 2032

Figure 61: Latin America Market Value (US$ Million) by By Form, 2022 to 2032

Figure 62: Latin America Market Value (US$ Million) by By Source, 2022 to 2032

Figure 63: Latin America Market Value (US$ Million) by Application, 2022 to 2032

Figure 64: Latin America Market Value (US$ Million) by End Use, 2022 to 2032

Figure 65: Latin America Market Value (US$ Million) by Country, 2022 to 2032

Figure 66: Latin America Market Value (US$ Million) Analysis by Country, 2017 to 2032

Figure 67: Latin America Market Volume Analysis by Country, 2017 to 2032

Figure 68: Latin America Market Value Share (%) and BPS Analysis by Country, 2022 to 2032

Figure 69: Latin America Market Y-o-Y Growth (%) Projections by Country, 2022 to 2032

Figure 70: Latin America Market Value (US$ Million) Analysis by By Form, 2017 to 2032

Figure 71: Latin America Market Volume Analysis by By Form, 2017 to 2032

Figure 72: Latin America Market Value Share (%) and BPS Analysis by By Form, 2022 to 2032

Figure 73: Latin America Market Y-o-Y Growth (%) Projections by By Form, 2022 to 2032

Figure 74: Latin America Market Value (US$ Million) Analysis by By Source, 2017 to 2032

Figure 75: Latin America Market Volume Analysis by By Source, 2017 to 2032

Figure 76: Latin America Market Value Share (%) and BPS Analysis by By Source, 2022 to 2032

Figure 77: Latin America Market Y-o-Y Growth (%) Projections by By Source, 2022 to 2032

Figure 78: Latin America Market Value (US$ Million) Analysis by Application, 2017 to 2032

Figure 79: Latin America Market Volume Analysis by Application, 2017 to 2032

Figure 80: Latin America Market Value Share (%) and BPS Analysis by Application, 2022 to 2032

Figure 81: Latin America Market Y-o-Y Growth (%) Projections by Application, 2022 to 2032

Figure 82: Latin America Market Value (US$ Million) Analysis by End Use, 2017 to 2032

Figure 83: Latin America Market Volume Analysis by End Use, 2017 to 2032

Figure 84: Latin America Market Value Share (%) and BPS Analysis by End Use, 2022 to 2032

Figure 85: Latin America Market Y-o-Y Growth (%) Projections by End Use, 2022 to 2032

Figure 86: Latin America Market Attractiveness by By Form, 2022 to 2032

Figure 87: Latin America Market Attractiveness by By Source, 2022 to 2032

Figure 88: Latin America Market Attractiveness by Application, 2022 to 2032

Figure 89: Latin America Market Attractiveness by End Use, 2022 to 2032

Figure 90: Latin America Market Attractiveness by Country, 2022 to 2032

Figure 91: Europe Market Value (US$ Million) by By Form, 2022 to 2032

Figure 92: Europe Market Value (US$ Million) by By Source, 2022 to 2032

Figure 93: Europe Market Value (US$ Million) by Application, 2022 to 2032

Figure 94: Europe Market Value (US$ Million) by End Use, 2022 to 2032

Figure 95: Europe Market Value (US$ Million) by Country, 2022 to 2032

Figure 96: Europe Market Value (US$ Million) Analysis by Country, 2017 to 2032

Figure 97: Europe Market Volume Analysis by Country, 2017 to 2032

Figure 98: Europe Market Value Share (%) and BPS Analysis by Country, 2022 to 2032

Figure 99: Europe Market Y-o-Y Growth (%) Projections by Country, 2022 to 2032

Figure 100: Europe Market Value (US$ Million) Analysis by By Form, 2017 to 2032

Figure 101: Europe Market Volume Analysis by By Form, 2017 to 2032

Figure 102: Europe Market Value Share (%) and BPS Analysis by By Form, 2022 to 2032

Figure 103: Europe Market Y-o-Y Growth (%) Projections by By Form, 2022 to 2032

Figure 104: Europe Market Value (US$ Million) Analysis by By Source, 2017 to 2032

Figure 105: Europe Market Volume Analysis by By Source, 2017 to 2032

Figure 106: Europe Market Value Share (%) and BPS Analysis by By Source, 2022 to 2032

Figure 107: Europe Market Y-o-Y Growth (%) Projections by By Source, 2022 to 2032

Figure 108: Europe Market Value (US$ Million) Analysis by Application, 2017 to 2032

Figure 109: Europe Market Volume Analysis by Application, 2017 to 2032

Figure 110: Europe Market Value Share (%) and BPS Analysis by Application, 2022 to 2032

Figure 111: Europe Market Y-o-Y Growth (%) Projections by Application, 2022 to 2032

Figure 112: Europe Market Value (US$ Million) Analysis by End Use, 2017 to 2032

Figure 113: Europe Market Volume Analysis by End Use, 2017 to 2032

Figure 114: Europe Market Value Share (%) and BPS Analysis by End Use, 2022 to 2032

Figure 115: Europe Market Y-o-Y Growth (%) Projections by End Use, 2022 to 2032

Figure 116: Europe Market Attractiveness by By Form, 2022 to 2032

Figure 117: Europe Market Attractiveness by By Source, 2022 to 2032

Figure 118: Europe Market Attractiveness by Application, 2022 to 2032

Figure 119: Europe Market Attractiveness by End Use, 2022 to 2032

Figure 120: Europe Market Attractiveness by Country, 2022 to 2032

Figure 121: East Asia Market Value (US$ Million) by By Form, 2022 to 2032

Figure 122: East Asia Market Value (US$ Million) by By Source, 2022 to 2032

Figure 123: East Asia Market Value (US$ Million) by Application, 2022 to 2032

Figure 124: East Asia Market Value (US$ Million) by End Use, 2022 to 2032

Figure 125: East Asia Market Value (US$ Million) by Country, 2022 to 2032

Figure 126: East Asia Market Value (US$ Million) Analysis by Country, 2017 to 2032

Figure 127: East Asia Market Volume Analysis by Country, 2017 to 2032

Figure 128: East Asia Market Value Share (%) and BPS Analysis by Country, 2022 to 2032

Figure 129: East Asia Market Y-o-Y Growth (%) Projections by Country, 2022 to 2032

Figure 130: East Asia Market Value (US$ Million) Analysis by By Form, 2017 to 2032

Figure 131: East Asia Market Volume Analysis by By Form, 2017 to 2032

Figure 132: East Asia Market Value Share (%) and BPS Analysis by By Form, 2022 to 2032

Figure 133: East Asia Market Y-o-Y Growth (%) Projections by By Form, 2022 to 2032

Figure 134: East Asia Market Value (US$ Million) Analysis by By Source, 2017 to 2032

Figure 135: East Asia Market Volume Analysis by By Source, 2017 to 2032

Figure 136: East Asia Market Value Share (%) and BPS Analysis by By Source, 2022 to 2032

Figure 137: East Asia Market Y-o-Y Growth (%) Projections by By Source, 2022 to 2032

Figure 138: East Asia Market Value (US$ Million) Analysis by Application, 2017 to 2032

Figure 139: East Asia Market Volume Analysis by Application, 2017 to 2032

Figure 140: East Asia Market Value Share (%) and BPS Analysis by Application, 2022 to 2032

Figure 141: East Asia Market Y-o-Y Growth (%) Projections by Application, 2022 to 2032

Figure 142: East Asia Market Value (US$ Million) Analysis by End Use, 2017 to 2032

Figure 143: East Asia Market Volume Analysis by End Use, 2017 to 2032

Figure 144: East Asia Market Value Share (%) and BPS Analysis by End Use, 2022 to 2032

Figure 145: East Asia Market Y-o-Y Growth (%) Projections by End Use, 2022 to 2032

Figure 146: East Asia Market Attractiveness by By Form, 2022 to 2032

Figure 147: East Asia Market Attractiveness by By Source, 2022 to 2032

Figure 148: East Asia Market Attractiveness by Application, 2022 to 2032

Figure 149: East Asia Market Attractiveness by End Use, 2022 to 2032

Figure 150: East Asia Market Attractiveness by Country, 2022 to 2032

Figure 151: South Asia Market Value (US$ Million) by By Form, 2022 to 2032

Figure 152: South Asia Market Value (US$ Million) by By Source, 2022 to 2032

Figure 153: South Asia Market Value (US$ Million) by Application, 2022 to 2032

Figure 154: South Asia Market Value (US$ Million) by End Use, 2022 to 2032

Figure 155: South Asia Market Value (US$ Million) by Country, 2022 to 2032

Figure 156: South Asia Market Value (US$ Million) Analysis by Country, 2017 to 2032

Figure 157: South Asia Market Volume Analysis by Country, 2017 to 2032

Figure 158: South Asia Market Value Share (%) and BPS Analysis by Country, 2022 to 2032

Figure 159: South Asia Market Y-o-Y Growth (%) Projections by Country, 2022 to 2032

Figure 160: South Asia Market Value (US$ Million) Analysis by By Form, 2017 to 2032

Figure 161: South Asia Market Volume Analysis by By Form, 2017 to 2032

Figure 162: South Asia Market Value Share (%) and BPS Analysis by By Form, 2022 to 2032

Figure 163: South Asia Market Y-o-Y Growth (%) Projections by By Form, 2022 to 2032

Figure 164: South Asia Market Value (US$ Million) Analysis by By Source, 2017 to 2032

Figure 165: South Asia Market Volume Analysis by By Source, 2017 to 2032

Figure 166: South Asia Market Value Share (%) and BPS Analysis by By Source, 2022 to 2032

Figure 167: South Asia Market Y-o-Y Growth (%) Projections by By Source, 2022 to 2032

Figure 168: South Asia Market Value (US$ Million) Analysis by Application, 2017 to 2032

Figure 169: South Asia Market Volume Analysis by Application, 2017 to 2032

Figure 170: South Asia Market Value Share (%) and BPS Analysis by Application, 2022 to 2032

Figure 171: South Asia Market Y-o-Y Growth (%) Projections by Application, 2022 to 2032

Figure 172: South Asia Market Value (US$ Million) Analysis by End Use, 2017 to 2032

Figure 173: South Asia Market Volume Analysis by End Use, 2017 to 2032

Figure 174: South Asia Market Value Share (%) and BPS Analysis by End Use, 2022 to 2032

Figure 175: South Asia Market Y-o-Y Growth (%) Projections by End Use, 2022 to 2032

Figure 176: South Asia Market Attractiveness by By Form, 2022 to 2032

Figure 177: South Asia Market Attractiveness by By Source, 2022 to 2032

Figure 178: South Asia Market Attractiveness by Application, 2022 to 2032

Figure 179: South Asia Market Attractiveness by End Use, 2022 to 2032

Figure 180: South Asia Market Attractiveness by Country, 2022 to 2032

Figure 181: Oceania Market Value (US$ Million) by By Form, 2022 to 2032

Figure 182: Oceania Market Value (US$ Million) by By Source, 2022 to 2032

Figure 183: Oceania Market Value (US$ Million) by Application, 2022 to 2032

Figure 184: Oceania Market Value (US$ Million) by End Use, 2022 to 2032

Figure 185: Oceania Market Value (US$ Million) by Country, 2022 to 2032

Figure 186: Oceania Market Value (US$ Million) Analysis by Country, 2017 to 2032

Figure 187: Oceania Market Volume Analysis by Country, 2017 to 2032

Figure 188: Oceania Market Value Share (%) and BPS Analysis by Country, 2022 to 2032

Figure 189: Oceania Market Y-o-Y Growth (%) Projections by Country, 2022 to 2032

Figure 190: Oceania Market Value (US$ Million) Analysis by By Form, 2017 to 2032

Figure 191: Oceania Market Volume Analysis by By Form, 2017 to 2032

Figure 192: Oceania Market Value Share (%) and BPS Analysis by By Form, 2022 to 2032

Figure 193: Oceania Market Y-o-Y Growth (%) Projections by By Form, 2022 to 2032

Figure 194: Oceania Market Value (US$ Million) Analysis by By Source, 2017 to 2032

Figure 195: Oceania Market Volume Analysis by By Source, 2017 to 2032

Figure 196: Oceania Market Value Share (%) and BPS Analysis by By Source, 2022 to 2032

Figure 197: Oceania Market Y-o-Y Growth (%) Projections by By Source, 2022 to 2032

Figure 198: Oceania Market Value (US$ Million) Analysis by Application, 2017 to 2032

Figure 199: Oceania Market Volume Analysis by Application, 2017 to 2032

Figure 200: Oceania Market Value Share (%) and BPS Analysis by Application, 2022 to 2032

Figure 201: Oceania Market Y-o-Y Growth (%) Projections by Application, 2022 to 2032

Figure 202: Oceania Market Value (US$ Million) Analysis by End Use, 2017 to 2032

Figure 203: Oceania Market Volume Analysis by End Use, 2017 to 2032

Figure 204: Oceania Market Value Share (%) and BPS Analysis by End Use, 2022 to 2032

Figure 205: Oceania Market Y-o-Y Growth (%) Projections by End Use, 2022 to 2032

Figure 206: Oceania Market Attractiveness by By Form, 2022 to 2032

Figure 207: Oceania Market Attractiveness by By Source, 2022 to 2032

Figure 208: Oceania Market Attractiveness by Application, 2022 to 2032

Figure 209: Oceania Market Attractiveness by End Use, 2022 to 2032

Figure 210: Oceania Market Attractiveness by Country, 2022 to 2032

Figure 211: MEA Market Value (US$ Million) by By Form, 2022 to 2032

Figure 212: MEA Market Value (US$ Million) by By Source, 2022 to 2032

Figure 213: MEA Market Value (US$ Million) by Application, 2022 to 2032

Figure 214: MEA Market Value (US$ Million) by End Use, 2022 to 2032

Figure 215: MEA Market Value (US$ Million) by Country, 2022 to 2032

Figure 216: MEA Market Value (US$ Million) Analysis by Country, 2017 to 2032

Figure 217: MEA Market Volume Analysis by Country, 2017 to 2032

Figure 218: MEA Market Value Share (%) and BPS Analysis by Country, 2022 to 2032

Figure 219: MEA Market Y-o-Y Growth (%) Projections by Country, 2022 to 2032

Figure 220: MEA Market Value (US$ Million) Analysis by By Form, 2017 to 2032

Figure 221: MEA Market Volume Analysis by By Form, 2017 to 2032

Figure 222: MEA Market Value Share (%) and BPS Analysis by By Form, 2022 to 2032

Figure 223: MEA Market Y-o-Y Growth (%) Projections by By Form, 2022 to 2032

Figure 224: MEA Market Value (US$ Million) Analysis by By Source, 2017 to 2032

Figure 225: MEA Market Volume Analysis by By Source, 2017 to 2032

Figure 226: MEA Market Value Share (%) and BPS Analysis by By Source, 2022 to 2032

Figure 227: MEA Market Y-o-Y Growth (%) Projections by By Source, 2022 to 2032

Figure 228: MEA Market Value (US$ Million) Analysis by Application, 2017 to 2032

Figure 229: MEA Market Volume Analysis by Application, 2017 to 2032

Figure 230: MEA Market Value Share (%) and BPS Analysis by Application, 2022 to 2032

Figure 231: MEA Market Y-o-Y Growth (%) Projections by Application, 2022 to 2032

Figure 232: MEA Market Value (US$ Million) Analysis by End Use, 2017 to 2032

Figure 233: MEA Market Volume Analysis by End Use, 2017 to 2032

Figure 234: MEA Market Value Share (%) and BPS Analysis by End Use, 2022 to 2032

Figure 235: MEA Market Y-o-Y Growth (%) Projections by End Use, 2022 to 2032

Figure 236: MEA Market Attractiveness by By Form, 2022 to 2032

Figure 237: MEA Market Attractiveness by By Source, 2022 to 2032

Figure 238: MEA Market Attractiveness by Application, 2022 to 2032

Figure 239: MEA Market Attractiveness by End Use, 2022 to 2032

Figure 240: MEA Market Attractiveness by Country, 2022 to 2032

Explore Consumer Product Insights

View Reports

Caprylic Capric Triglyceride Market