Reports

- Global Locations -

Headquarters

Future Market Insights, Inc.

Christiana Corporate, 200
Continental Drive, Suite 401,
Newark, Delaware - 19713,
United States

T: +1-845-579-5705

Americas

Future Market Insights, Inc.

616 Corporate Way, Suite 2-9018,
Valley Cottage, NY 10989, United States

T: +1-347-918-3531

MEA

Future Market Insights

1602-6 Jumeirah Bay X2 Tower, Plot No: JLT-PH2-X2A,
Jumeirah Lakes Towers, Dubai,
United Arab Emirates

Europe

Future Market Insights

3rd Floor, 207 Regent Street,
W1B 3HH London
United Kingdom

T: + 44 (0) 20 8123 9659
D: +44 (0) 20 3287 4268

Asia Pacific

Future Market Insights

IndiaLand Global Tech Park, Unit UG-1, Behind Grand HighStreet, Phase 1, Hinjawadi, MH, Pune – 411057, India

Carbon-negative Packaging Market Outlook

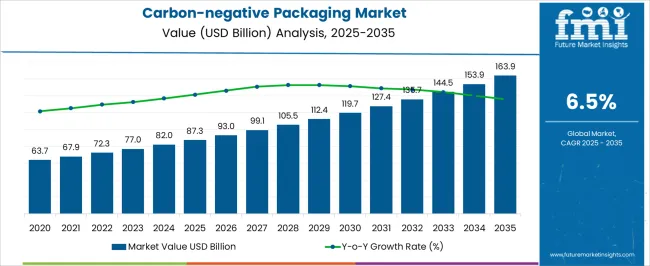
The carbon-negative packaging market size is projected to be valued at US$ 77.0 million in 2023 and is expected to rise to US$ 145.0 million by 2033. The sales of carbon-negative packaging are projected to expand at a significant CAGR of 6.5% during the forecast period.

The packaging industry has been facing significant challenges due to its detrimental environmental effects. Traditional packaging materials, such as plastics and metals, contribute to pollution, resource depletion, and climate change. The need for alternative packaging solutions that minimize these negative impacts has become increasingly urgent.

Carbon-negative packaging has emerged as a novel strategy that tries to reduce the environmental impact of standard packaging materials while also contributing to sustainability efforts.

What is Carbon-negative Packaging?

Carbon-negative packaging goes beyond simply reducing carbon emissions; it actively removes carbon from the atmosphere that it emits during its entire life cycle. This innovative approach involves using materials and processes that sequester carbon, resulting in a net reduction of greenhouse gas emissions.

Key Benefits of Carbon-negative Packaging?

  • Carbon Footprint Reduction: Packaging can efficiently minimize its carbon footprint by utilizing carbon-negative materials and techniques. This aids in the fight against climate change and contributes to worldwide efforts to achieve carbon neutrality.
  • Contribution to Climate Change: Carbon-negative packaging plays an important role in tackling climate change concerns by actively removing carbon dioxide from the atmosphere. This contributes to the stabilization and reduction of greenhouse gas concentrations, resulting in a healthy planet.
  • Positive Environmental and Social Impact: Carbon-negative packaging supports environmental stewardship and sustainability. It promotes the use of renewable resources, helps local communities by procuring locally, and decreases pollution and waste.

Carbon-Negative Packaging Technologies

Carbon Capture and Storage: Carbon emissions are captured and stored using advanced technology during the manufacturing and use of packaging materials. The trapped carbon is subsequently buried or repurposed for other uses, preventing it from escaping the atmosphere.

Life Cycle Assessment and Analysis: Comprehensive life cycle analyses assist in determining the environmental impact of packaging materials and processes. Packaging designers may make informed judgments to reduce carbon emissions by analyzing the full life cycle, from raw material extraction through disposal.

Sustainable Manufacturing and Distribution: Carbon-negative packaging entails optimizing manufacturing and distribution processes to reduce energy usage, waste generation, and transportation emissions. Implementing renewable energy and efficient logistics helps to achieve carbon negative.

Attribute Details
Carbon-negative Packaging Market Estimated Size (2023) US$ 77.0 million
Carbon-negative Packaging Market CAGR (2023 to 2033) 6.5%
Carbon-negative Packaging Market Forecasted Size (2033) US$ 145.0 million

Don't pay for what you don't need

Customize your report by selecting specific countries or regions and save 30%!

2018 and 2022 Carbon-negative Packaging Market Outlook in Comparison between 2023 and 2033 Growth Forecast

Historically, the growing awareness of environmental issues and the necessity for sustainable packaging solutions drove the need for carbon-negative packaging. Consumers, governments, and corporations began to recognize the negative environmental effects of traditional packaging materials, resulting in a shift in preferences toward eco-friendly alternatives.

In the future, the carbon-negative packaging market is predicted to increase significantly and boost sales prospects. Additionally, the need to address climate change and environmental challenges is projected to become pressing. As organizations and consumers seek solutions that actively decrease carbon emissions and contribute to sustainability, demand for carbon-negative packaging is likely to rise.

Governments around the world are going to impose strict restrictions and offer incentives to encourage the adoption of sustainable packaging practices. Businesses across various industries are increasingly integrating sustainability into their corporate strategies. Moreover, with sustainability becoming a key differentiator, companies invest in carbon-negative packaging to meet their sustainability goals, enhance their brand reputation, and capture consumer loyalty.

According to FMI, the market is likely to witness a growth rate of 6.5% between 2023 and 2033, in comparison to 3.7% from 2018 to 2022.

Investing in the carbon-negative packaging industry can help organizations gain a competitive advantage, increase supply chain efficiency, and satisfy sustainability goals.

Manufacturers and Service Providers in the Carbon-negative Packaging Market can Scale their Businesses by Adopting the following strategies

Here are several strategies that can facilitate business expansion and success:

  • Invest in Research and Development: Allocate resources to research and development activities aimed at enhancing existing carbon-negative packaging materials and technologies.
  • Expand Product Portfolio: Diversify the range of carbon-negative packaging solutions offered to cater to different industries and applications.
  • Forge Strategic Partnerships: Collaborate with material suppliers, technology providers, and other stakeholders in the packaging industry.
  • Engage with Customers: Understand customer requirements and preferences by actively engaging with them. Seek feedback, conduct surveys, and participate in industry events to gain insights into market needs and trends.
  • Promote Environmental Certifications: Obtain relevant environmental certifications and accreditations to showcase the sustainability credentials of carbon-negative packaging products.
  • Optimize Production Efficiency: Adopt lean manufacturing principles, invest in energy-efficient equipment, and explore renewable energy sources to reduce the carbon footprint associated with production.
  • Seek Industry Certifications: Obtain industry-specific certifications that validate the eco-friendly and carbon-negative attributes of packaging products.
Ismail Sutaria
Ismail Sutaria

Principal Consultant

Talk to Analyst

Find your sweet spots for generating winning opportunities in this market.

Comparative View of the Carbon-negative Packaging Market

Carbon-negative Packaging Market:

Attributes Carbon-negative Packaging Market
CAGR (2023 to 2033) 6.5%
Market Value (2026) US$ 145.0 million
Growth Factor Carbon-negative packaging has emerged as a novel strategy that tries to reduce the environmental impact of standard packaging materials while also contributing to sustainability efforts.
Opportunity Carbon-negative packaging supports environmental stewardship and sustainability. It promotes the use of renewable resources, helps local communities by procuring locally, and decreases pollution and waste.
Key Trends With sustainability becoming a key differentiator, companies invest in carbon-negative packaging to meet their sustainability goals, enhance their brand reputation, and capture consumer loyalty.

Nano-technology Packaging Market:

Attributes Nano-technology Packaging Market
CAGR (2023 to 2033) 17.6%
Market Value (2026) US$ 87,412.0 million
Growth Factor Growing demand from various end-user industries.
Opportunity Growing emphasis on sustainable solutions.
Key Trends Rising trend of customization and advancement in packaging techniques.

PET Bottles Market:

Attributes PET Bottles Market
CAGR (2023 to 2033) 4.46%
Market Value (2026) US$ 49.63 billion
Growth Factor To compete in the market, manufacturers are also collaborating with recognized logistics and transportation companies to deliver goods on time.
Opportunity The manufacture of pet jars or pet bottles is one of the most significant and effective manufacturing opportunities in the plastic and polymer business.
Key Trends The market outlook for PET bottles has improved as a result of technological developments.

Category-wise Insights of Carbon-negative Packaging

Packaging Type Insights

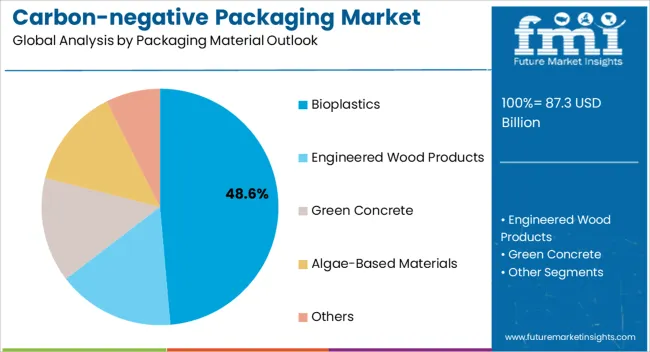
Bioplastics are one of the packaging materials that have a substantial market share in the carbon-negative packaging sector. Bioplastics are made from renewable resources such as corn flour, sugarcane, or cellulose, and they have various environmental advantages. Given their biodegradability, composability, and small carbon footprint, they have gained favor as a viable alternative to standard plastics.

Bioplastics have been widely used in a variety of industries, including food and beverage, personal care, and consumer product packaging. Their adaptability and compatibility with existing packaging methods have helped them gain market share. Furthermore, advances in bioplastic technology have resulted in great performance and increased adoption by businesses and consumers alike.

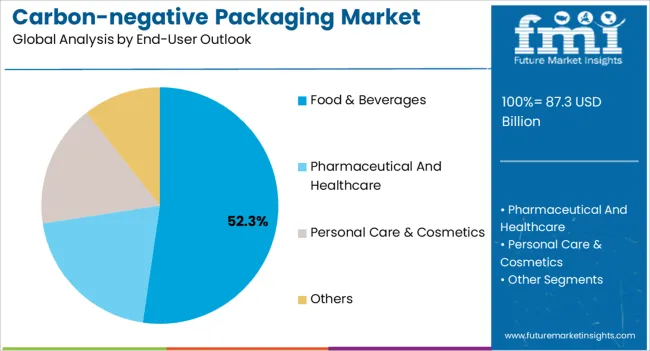
With a Key Share of the Carbon-negative Packaging Market, the Food and Beverage Industry has been one of the Leading End Consumers.

In the food and beverage business, carbon-negative packaging solutions frequently focus on materials such as bioplastics, compostable materials, and alternative packaging options. These materials offer biodegradability, low carbon emissions, and functional packaging qualities. These materials further help to maintain the freshness and quality of food and beverages while reducing their environmental impact.

The food and beverage industry has been aggressive in adopting sustainable practices and resolving packaging-related environmental concerns. Many organizations in this area have ambitious sustainability goals and are actively exploring carbon-negative packaging solutions to satisfy these goals and remain competitive.
Get the data you need at a Fraction of the cost

Personalize your report by choosing insights you need
and save 40%!

Regional Analysis of the Carbon-negative Packaging Market

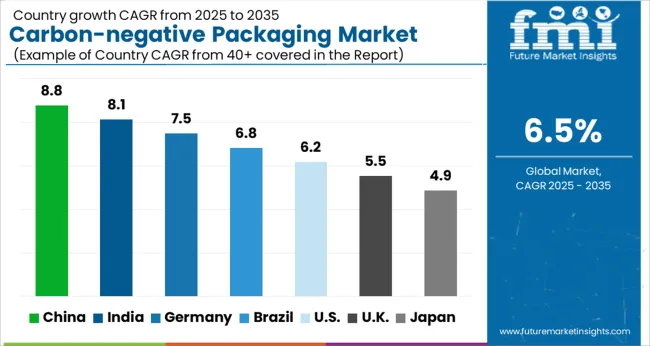
The Region's Commitment to Sustainability and Growing Consumer Awareness has Played a Role in the Region's Adoption of Carbon-negative Packaging Solutions.

The region's well-established food and beverage industry has played a critical role in encouraging carbon-negative packaging usage. Food manufacturers, retailers, and restaurants in North America have recognized the need for sustainable packaging practices in meeting consumer expectations while reducing their environmental imprint.

The legislative environment in North America has been favorable to sustainable packaging initiatives. Regulations and guidelines aiming at reducing carbon emissions and promoting sustainable practices have been adopted in both the United States and Canada. These restrictions have motivated enterprises to use carbon-negative packaging solutions, increasing the region's market share of such packaging materials.

Europe has long been at the Forefront of Sustainability Activities, Setting Ambitious Goals to Reduce Carbon Emissions and Encourage Circular Economy Practices.

In Europe, the food and beverage industry has been a significant driver of carbon-negative packaging usage. Consumers in the region place a premium on eco-friendly packaging and actively seek products with a low environmental impact.

Governments of Europe have enacted tough legislation and procedures for extended producer responsibility (EPR) to encourage sustainable packaging practices. These rules, such as the European Green Deal and the Circular Economy Action Plan, encourage businesses to use low-carbon packaging materials and technologies. The convergence of rules and consumer demand has increased the market share of carbon-negative packaging in Europe.

With its Enormous Population, and Developing Economies, Asia Pacific has seen a Significant Increase in the Adoption of Sustainable Packaging Solutions.

Many governments in Asia Pacific area have implemented environmental rules and legislation that support sustainable packaging practices. These initiatives encourage firms to use carbon-negative packaging and fund research and development in environment-friendly materials and technology.

The region's increasing middle class has purchasing power and strong expectations for environment-friendly products and packaging. This demographic transition has increased demand for carbon-neutral packaging solutions, particularly in the food and beverage industry.

There is a great demand for packaging materials that are both protective and environment-friendly with the advent of e-commerce in Asia Pacific.
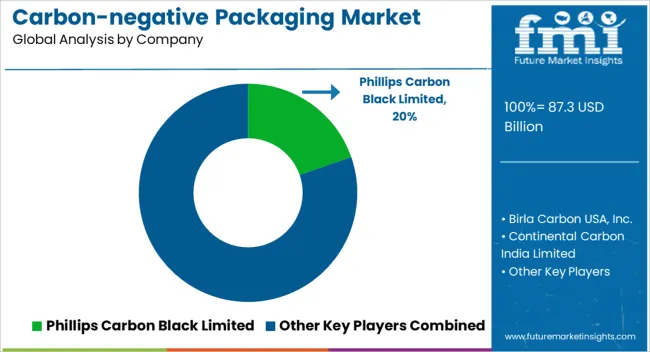
The Competitive Landscape in the Carbon-negative Packaging Market is Dynamic and Evolving, Driven by the Increasing Demand for Sustainable Packaging Solutions.

Several key players and emerging companies are actively involved in developing and providing carbon-negative packaging options. Many startups and innovative ventures have entered the carbon-negative packaging market, focusing specifically on developing sustainable packaging materials and technologies. These companies bring fresh ideas and disruptive solutions, often utilizing bioplastics, compostable materials, and other innovative approaches to reduce carbon emissions and environmental impact.

Competition is expected to intensify, leading to further innovations and improvements in carbon-negative packaging solutions as the market continues to grow. Market players that can differentiate themselves through product quality, sustainability credentials, cost-effectiveness, and responsive customer service are likely to thrive in this competitive landscape.

Latest Developments

  • PPG announced the official opening of its Packaging Coatings Innovation Centre, Europe in Bodelshausen, Germany, in November 2021. The greatly increased analytical and research and development capabilities of the plant improve and speed up the development of packaging coatings solutions across a wide variety of end markets.
  • Sealed Air Singapore offered creative and environmentally responsible packaging solutions in December 2021. Its TemPreserveTM Insulative Foam and QuikwrapTM Nano paper solutions were both honored at the 'Made in Singapore Awards' and the 'Designed in Singapore Awards,' respectively.

Scope of the Report

Attribute Details
Growth Rate CAGR of 6.5% from 2023 to 2033
Base Year of Estimation 2023
Historical Data 2018 to 2022
Forecast Period 2023 to 2033
Quantitative Units Revenue in US$ million and Volume in Units and F-CAGR from 2022 to 2032
Report Coverage Revenue Forecast, Volume Forecast, Company Ranking, Competitive Landscape, growth factors, Trends, and Pricing Analysis
Key Segments Covered
  • By Packaging Material
  • By End User Industry
  • By Region
Regions Covered
  • North America
  • Latin America
  • Europe
  • East Asia
  • South Asia
  • The Middle East & Africa
  • Oceania
Key Countries Profiled
  • The United States
  • Canada
  • Brazil
  • Mexico
  • Germany
  • Italy
  • France
  • The United Kingdom
  • Spain
  • Russia
  • China
  • Japan
  • India
  • GCC Countries
  • Australia
Key Companies Profiled
  • Phillips Carbon Black Limited
  • Birla Carbon USA, Inc.
  • Continental Carbon India Limited
  • Cabot Corporation
  • Tokai Carbon Group (Cancarb)
  • Sealed Air Corporation
  • Pregis Corporation
  • DS Smith Plc
  • Achilles Corporation
  • Delphon Industries, LLC
  • Smurfit Kappa Group
  • Storopack Hans Reichenecker GmbH
  • Desco Industries Inc.
  • Nefab Group
  • Teknis Limited, Elcom (United Kingdom) Ltd.
  • GWP Group Limited
  • International Plastics Inc.
  • AUER Packaging GmbH
  • Pure-Stat Engineered Technologies, Inc.
  • Protective Packaging Corporation
  • Key Segments
Customization & Pricing Available upon Request

Key Segments Covered in the Carbon-negative Packaging Market Report

Packaging Material Outlook:

  • Bioplastics
  • Engineered Wood Products
  • Green Concrete
  • Algae-Based Materials
  • Others

End-User Outlook:

  • Food & Beverages
  • Pharmaceutical and Healthcare
  • Personal Care & Cosmetics
  • Others

By Region:

  • North America
  • Latin America
  • Western Europe
  • Eastern Europe
  • Asia Pacific Excluding Japan (APEJ)
  • Japan
  • The Middle East & Africa (MEA)

Frequently Asked Questions

How Big is the Market Going to be by 2033?

The market is valued to hit US$ 145 million by 2033.

What is the Growth Forecast for Market?

The market is forecast to register a CAGR of 6.5% through 2033.

What is Current Market Valuation?

The market is estimated to secure a valuation of US$ 77 million in 2023.

How was the Historical Performance of The Market?

During 2018 to 2022, the market grew at a CAGR of 3.7%.

What Is the Key Trend Of The Carbon-negative Packaging Market?

Market expansion is fueled by emerging demand for sustainable alternatives.

Which Packaging Type Category Has a Significant Impact on the Market?

In the carbon-negative packaging business, bioplastics segment has a significant market share.

Which End User Segment to Lead in the Market?

The food and beverage segment to rule the market share in 2023.

Table of Content

1. Executive Summary

    1.1. Global Market Outlook

    1.2. Demand-side Trends

    1.3. Supply-side Trends

    1.4. Technology Roadmap Analysis

    1.5. Analysis and Recommendations

2. Market Overview

    2.1. Market Coverage / Taxonomy

    2.2. Market Definition / Scope / Limitations

3. Market Background

    3.1. Market Dynamics

        3.1.1. Drivers

        3.1.2. Restraints

        3.1.3. Opportunity

        3.1.4. Trends

    3.2. Scenario Forecast

        3.2.1. Demand in Optimistic Scenario

        3.2.2. Demand in Likely Scenario

        3.2.3. Demand in Conservative Scenario

    3.3. Product launches & Recent Developments

    3.4. Product Life Cycle Analysis

    3.5. Value Chain Analysis

        3.5.1. Supply Side Participants and their Roles

            3.5.1.1. Producers

            3.5.1.2. Mid-Level Participants (Traders/ Agents/ Brokers)

            3.5.1.3. Wholesalers and Distributors

        3.5.2. % of Operating Margin Analysis

        3.5.3. List of Existing and Potential Buyer’s

    3.6. Pricing Analysis

        3.6.1. Price Point Assessment by Region

        3.6.2. Price Point Assessment by production

        3.6.3. Price Forecast till 2033

        3.6.4. Factors affecting pricing

    3.7. Forecast Factors - Relevance & Impact

    3.8. Regulatory Landscape

    3.9. Regional Parent Market Outlook

    3.10. Production and Consumption Statistics

    3.11. Consumers Survey Analysis

    3.12. Macro-Economic Factors

4. Global Analysis 2018 to 2022 and Forecast, 2023 to 2033

    4.1. Historical Market Size Value (US$ Million) & Volume (Tonnes) Analysis, 2018 to 2022

    4.2. Current and Future Market Size Value (US$ Million) & Volume (Tonnes) Projections, 2023 to 2033

        4.2.1. Y-o-Y Growth Trend Analysis

        4.2.2. Absolute $ Opportunity Analysis

5. Global Analysis 2018 to 2022 and Forecast 2023 to 2033, By Material

    5.1. Introduction / Key Findings

    5.2. Historical Market Size Value (US$ Million) & Volume (Tonnes) Analysis By Material, 2018 to 2022

    5.3. Current and Future Market Size Value (US$ Million) & Volume (Tonnes) Analysis and Forecast By

        5.3.1. Material, 2023 to 2033

        5.3.2. Bioplastics

        5.3.3. Paper and Cardboard

        5.3.4. Bio-based Polymers

        5.3.5. Compostable Materials

        5.3.6. Others (Glass, Metal, Natural Fibers, etc.)

    5.4. Y-o-Y Growth Trend Analysis By Material, 2018 to 2022

    5.5. Absolute $ Opportunity Analysis By Material, 2023 to 2033

6. Global Analysis 2018 to 2022 and Forecast 2023 to 2033, By Packaging

    6.1. Formats

    6.2. Introduction / Key Findings

    6.3. Historical Market Size Value (US$ Million) & Volume (Tonnes) Analysis By Packaging Formats,

        6.3.1. 2018 to 2022

    6.4. Current and Future Market Size Value (US$ Million) & Volume (Tonnes) Analysis and Forecast By

        6.4.1. Packaging Formats, 2023 to 2033

        6.4.2. Bottles & Containers

        6.4.3. Bags & Pouches

        6.4.4. Cartons & Boxes

        6.4.5. Labels & Wraps

        6.4.6. Others (Tubes, Blister Packs, etc.)

    6.5. Y-o-Y Growth Trend Analysis By Packaging Formats, 2018 to 2022

    6.6. Absolute $ Opportunity Analysis By Packaging Formats, 2023 to 2033

7. Global Analysis 2018 to 2022 and Forecast 2023 to 2033, By End Use

    7.1. Introduction / Key Findings

    7.2. Historical Market Size Value (US$ Million) & Volume (Tonnes) Analysis By End Use, 2018 to 2022

    7.3. Current and Future Market Size Value (US$ Million) & Volume (Tonnes) Analysis and Forecast By

        7.3.1. End Use, 2023 to 2033

        7.3.2. Food & Beverage

        7.3.3. Personal Care and Cosmetics

        7.3.4. Healthcare and Pharmaceuticals

        7.3.5. E-commerce and Logistics

        7.3.6. Others (Electronics, Automotive, etc.)

    7.4. Y-o-Y Growth Trend Analysis By End Use, 2018 to 2022

    7.5. Absolute $ Opportunity Analysis By End Use, 2023 to 2033

8. Global Analysis 2018 to 2022 and Forecast 2023 to 2033, By Region

    8.1. Introduction

    8.2. Historical Market Size Value (US$ Million) & Volume (Tonnes) Analysis By Region, 2018 to 2022

    8.3. Current Market Size Value (US$ Million) & Volume (Tonnes) Analysis and Forecast By Region,

    8.4. 2023 to 2033

        8.4.1. North America

        8.4.2. Latin America

        8.4.3. Europe

        8.4.4. East Asia

        8.4.5. South Asia

        8.4.6. Oceania

        8.4.7. MEA

    8.5. Market Attractiveness Analysis By Region

9. North America Analysis 2018 to 2022 and Forecast 2023 to 2033, By Country

    9.1. Historical Market Size Value (US$ Million) & Volume (Tonnes) Trend Analysis By Market Taxonomy,

    9.2. 2018 to 2022

    9.3. Market Size Value (US$ Million) & Volume (Tonnes) Forecast By Market Taxonomy, 2023 to 2033

        9.3.1. By Country

            9.3.1.1. USA

            9.3.1.2. Canada

        9.3.2. By Material

        9.3.3. By Packaging Formats

        9.3.4. By End Use

    9.4. Market Attractiveness Analysis

        9.4.1. By Country

        9.4.2. By Material

        9.4.3. By Packaging Formats

        9.4.4. By End Use

    9.5. Key Takeaways

10. Latin America Analysis 2018 to 2022 and Forecast 2023 to 2033, By Country

    10.1. Historical Market Size Value (US$ Million) & Volume (Tonnes) Trend Analysis By Market Taxonomy,

        10.1.1. 2018 to 2022

    10.2. Market Size Value (US$ Million) & Volume (Tonnes) Forecast By Market Taxonomy, 2023 to 2033

        10.2.1. By Country

            10.2.1.1. Brazil

            10.2.1.2. Mexico

            10.2.1.3. Argentina

            10.2.1.4. Chile

            10.2.1.5. Peru

            10.2.1.6. Rest of Latin America

        10.2.2. By Material

        10.2.3. By Packaging Formats

        10.2.4. By End Use

    10.3. Market Attractiveness Analysis

        10.3.1. By Country

        10.3.2. By Material

        10.3.3. By Packaging Formats

        10.3.4. By End Use

    10.4. Key Takeaways

11. Europe Analysis 2018 to 2022 and Forecast 2023 to 2033, By Country

    11.1. Historical Market Size Value (US$ Million) & Volume (Tonnes) Trend Analysis By Market Taxonomy,

        11.1.1. 2018 to 2022

    11.2. Market Size Value (US$ Million) & Volume (Tonnes) Forecast By Market Taxonomy, 2023 to 2033

        11.2.1. By Country

            11.2.1.1. Germany

            11.2.1.2. Italy

            11.2.1.3. France

            11.2.1.4. UK

            11.2.1.5. Spain

            11.2.1.6. Russia

            11.2.1.7. BENELUX

            11.2.1.8. Poland

            11.2.1.9. Nordic Countries

            11.2.1.10. Rest of Europe

        11.2.2. By Material

        11.2.3. By Packaging Formats

        11.2.4. By End Use

    11.3. Market Attractiveness Analysis

        11.3.1. By Country

        11.3.2. By Material

        11.3.3. By Packaging Formats

        11.3.4. By End Use

    11.4. Key Takeaways

12. East Asia Analysis 2018 to 2022 and Forecast 2023 to 2033, By Country

    12.1. Historical Market Size Value (US$ Million) & Volume (Tonnes) Trend Analysis By Market Taxonomy,

        12.1.1. 2018 to 2022

    12.2. Market Size Value (US$ Million) & Volume (Tonnes) Forecast By Market Taxonomy, 2023 to 2033

        12.2.1. By Country

            12.2.1.1. China

            12.2.1.2. Japan

            12.2.1.3. South Korea

        12.2.2. By Material

        12.2.3. By Packaging Formats

        12.2.4. By End Use

    12.3. Market Attractiveness Analysis

        12.3.1. By Country

        12.3.2. By Material

        12.3.3. By Packaging Formats

        12.3.4. By End Use

    12.4. Key Takeaways

13. South Asia Analysis 2018 to 2022 and Forecast 2023 to 2033, By Country

    13.1. Historical Market Size Value (US$ Million) & Volume (Tonnes) Trend Analysis By Market Taxonomy,

        13.1.1. 2018 to 2022

    13.2. Market Size Value (US$ Million) & Volume (Tonnes) Forecast By Market Taxonomy, 2023 to 2033

        13.2.1. By Country

            13.2.1.1. India

            13.2.1.2. Thailand

            13.2.1.3. Malaysia

            13.2.1.4. Indonesia

            13.2.1.5. Singapore

            13.2.1.6. Rest of South Asia

        13.2.2. By Material

        13.2.3. By Packaging Formats

        13.2.4. By End Use

    13.3. Market Attractiveness Analysis

        13.3.1. By Country

        13.3.2. By Material

        13.3.3. By Packaging Formats

        13.3.4. By End Use

    13.4. Key Takeaways

14. Oceania Analysis 2018 to 2022 and Forecast 2023 to 2033, By Country

    14.1. Historical Market Size Value (US$ Million) & Volume (Tonnes) Trend Analysis By Market Taxonomy,

        14.1.1. 2018 to 2022

    14.2. Market Size Value (US$ Million) & Volume (Tonnes) Forecast By Market Taxonomy, 2023 to 2033

        14.2.1. By Country

            14.2.1.1. Australia

            14.2.1.2. New Zealand

        14.2.2. By Material

        14.2.3. By Packaging Formats

        14.2.4. By End Use

    14.3. Market Attractiveness Analysis

        14.3.1. By Country

        14.3.2. By Material

        14.3.3. By Packaging Formats

        14.3.4. By End Use

    14.4. Key Takeaways

15. MEA Analysis 2018 to 2022 and Forecast 2023 to 2033, By Country

    15.1. Historical Market Size Value (US$ Million) & Volume (Tonnes) Trend Analysis By Market Taxonomy,

        15.1.1. 2018 to 2022

    15.2. Market Size Value (US$ Million) & Volume (Tonnes) Forecast By Market Taxonomy, 2023 to 2033

        15.2.1. By Country

            15.2.1.1. GCC Countries

            15.2.1.2. South Africa

            15.2.1.3. Central Africa

            15.2.1.4. North Africa

        15.2.2. By Material

        15.2.3. By Packaging Formats

        15.2.4. By End Use

    15.3. Market Attractiveness Analysis

        15.3.1. By Country

        15.3.2. By Material

        15.3.3. By Packaging Formats

        15.3.4. By End Use

    15.4. Key Takeaways

16. Key Countries Analysis

    16.1. USA

        16.1.1. Pricing Analysis

        16.1.2. Market Share Analysis, 2023

            16.1.2.1. By Material

            16.1.2.2. By Packaging Formats

            16.1.2.3. By End Use

    16.2. Canada

        16.2.1. Pricing Analysis

        16.2.2. Market Share Analysis, 2023

            16.2.2.1. By Material

            16.2.2.2. By Packaging Formats

            16.2.2.3. By End Use

    16.3. Brazil

        16.3.1. Pricing Analysis

        16.3.2. Market Share Analysis, 2023

            16.3.2.1. By Material

            16.3.2.2. By Packaging Formats

            16.3.2.3. By End Use

    16.4. Mexico

        16.4.1. Pricing Analysis

        16.4.2. Market Share Analysis, 2023

            16.4.2.1. By Material

            16.4.2.2. By Packaging Formats

            16.4.2.3. By End Use

    16.5. Argentina

        16.5.1. Pricing Analysis

        16.5.2. Market Share Analysis, 2023

            16.5.2.1. By Material

            16.5.2.2. By Packaging Formats

            16.5.2.3. By End Use

    16.6. Chile

        16.6.1. Pricing Analysis

        16.6.2. Market Share Analysis, 2023

            16.6.2.1. By Material

            16.6.2.2. By Packaging Formats

            16.6.2.3. By End Use

    16.7. Peru

        16.7.1. Pricing Analysis

        16.7.2. Market Share Analysis, 2023

            16.7.2.1. By Material

            16.7.2.2. By Packaging Formats

            16.7.2.3. By End Use

    16.8. Germany

        16.8.1. Pricing Analysis

        16.8.2. Market Share Analysis, 2023

            16.8.2.1. By Material

            16.8.2.2. By Packaging Formats

            16.8.2.3. By End Use

    16.9. Italy

        16.9.1. Pricing Analysis

        16.9.2. Market Share Analysis, 2023

            16.9.2.1. By Material

            16.9.2.2. By Packaging Formats

            16.9.2.3. By End Use

    16.10. France

        16.10.1. Pricing Analysis

        16.10.2. Market Share Analysis, 2023

            16.10.2.1. By Material

            16.10.2.2. By Packaging Formats

            16.10.2.3. By End Use

    16.11. Spain

        16.11.1. Pricing Analysis

        16.11.2. Market Share Analysis, 2023

            16.11.2.1. By Material

            16.11.2.2. By Packaging Formats

            16.11.2.3. By End Use

    16.12. UK

        16.12.1. Pricing Analysis

        16.12.2. Market Share Analysis, 2023

            16.12.2.1. By Material

            16.12.2.2. By Packaging Formats

            16.12.2.3. By End Use

    16.13. Russia

        16.13.1. Pricing Analysis

        16.13.2. Market Share Analysis, 2023

            16.13.2.1. By Material

            16.13.2.2. By Packaging Formats

            16.13.2.3. By End Use

    16.14. Poland

        16.14.1. Pricing Analysis

        16.14.2. Market Share Analysis, 2023

            16.14.2.1. By Material

            16.14.2.2. By Packaging Formats

            16.14.2.3. By End Use

    16.15. BENELUX

        16.15.1. Pricing Analysis

        16.15.2. Market Share Analysis, 2023

            16.15.2.1. By Material

            16.15.2.2. By Packaging Formats

            16.15.2.3. By End Use

    16.16. Nordic Countries

        16.16.1. Pricing Analysis

        16.16.2. Market Share Analysis, 2023

            16.16.2.1. By Material

            16.16.2.2. By Packaging Formats

            16.16.2.3. By End Use

    16.17. China

        16.17.1. Pricing Analysis

        16.17.2. Market Share Analysis, 2023

            16.17.2.1. By Material

            16.17.2.2. By Packaging Formats

            16.17.2.3. By End Use

    16.18. Japan

        16.18.1. Pricing Analysis

        16.18.2. Market Share Analysis, 2023

            16.18.2.1. By Material

            16.18.2.2. By Packaging Formats

            16.18.2.3. By End Use

    16.19. South Korea

        16.19.1. Pricing Analysis

        16.19.2. Market Share Analysis, 2023

            16.19.2.1. By Material

            16.19.2.2. By Packaging Formats

            16.19.2.3. By End Use

    16.20. India

        16.20.1. Pricing Analysis

        16.20.2. Market Share Analysis, 2023

            16.20.2.1. By Material

            16.20.2.2. By Packaging Formats

            16.20.2.3. By End Use

    16.21. Thailand

        16.21.1. Pricing Analysis

        16.21.2. Market Share Analysis, 2023

            16.21.2.1. By Material

            16.21.2.2. By Packaging Formats

            16.21.2.3. By End Use

    16.22. Indonesia

        16.22.1. Pricing Analysis

        16.22.2. Market Share Analysis, 2023

            16.22.2.1. By Material

            16.22.2.2. By Packaging Formats

            16.22.2.3. By End Use

    16.23. Malaysia

        16.23.1. Pricing Analysis

        16.23.2. Market Share Analysis, 2023

            16.23.2.1. By Material

            16.23.2.2. By Packaging Formats

            16.23.2.3. By End Use

    16.24. Singapore

        16.24.1. Pricing Analysis

        16.24.2. Market Share Analysis, 2023

            16.24.2.1. By Material

            16.24.2.2. By Packaging Formats

            16.24.2.3. By End Use

    16.25. Australia

        16.25.1. Pricing Analysis

        16.25.2. Market Share Analysis, 2023

            16.25.2.1. By Material

            16.25.2.2. By Packaging Formats

            16.25.2.3. By End Use

    16.26. New Zealand

        16.26.1. Pricing Analysis

        16.26.2. Market Share Analysis, 2023

            16.26.2.1. By Material

            16.26.2.2. By Packaging Formats

            16.26.2.3. By End Use

    16.27. GCC Countries

        16.27.1. Pricing Analysis

        16.27.2. Market Share Analysis, 2023

            16.27.2.1. By Material

            16.27.2.2. By Packaging Formats

            16.27.2.3. By End Use

    16.28. South Africa

        16.28.1. Pricing Analysis

        16.28.2. Market Share Analysis, 2023

            16.28.2.1. By Material

            16.28.2.2. By Packaging Formats

            16.28.2.3. By End Use

    16.29. North Africa

        16.29.1. Pricing Analysis

        16.29.2. Market Share Analysis, 2023

            16.29.2.1. By Material

            16.29.2.2. By Packaging Formats

            16.29.2.3. By End Use

    16.30. Central Africa

        16.30.1. Pricing Analysis

        16.30.2. Market Share Analysis, 2023

            16.30.2.1. By Material

            16.30.2.2. By Packaging Formats

            16.30.2.3. By End Use

17. Market Structure Analysis

    17.1. Competition Dashboard

    17.2. Competition Benchmarking

    17.3. Market Share Analysis of Top Players

        17.3.1. By Regional

        17.3.2. By Material

        17.3.3. By Packaging Formats

        17.3.4. By End Use

18. Competition Analysis

    18.1. Competition Deep Dive

        18.1.1. Sulapac

            18.1.1.1. Overview

            18.1.1.2. Product Portfolio

            18.1.1.3. Profitability by Market Segments (Product/Age /Sales Channel/Region)

            18.1.1.4. Sales Footprint

            18.1.1.5. Strategy Overview

                18.1.1.5.1. Marketing Strategy

                18.1.1.5.2. Product Strategy

                18.1.1.5.3. Channel Strategy

        18.1.2. Elopak

            18.1.2.1. Overview

            18.1.2.2. Product Portfolio

            18.1.2.3. Profitability by Market Segments (Product/Age /Sales Channel/Region)

            18.1.2.4. Sales Footprint

            18.1.2.5. Strategy Overview

                18.1.2.5.1. Marketing Strategy

                18.1.2.5.2. Product Strategy

                18.1.2.5.3. Channel Strategy

        18.1.3. Stora Enso

            18.1.3.1. Overview

            18.1.3.2. Product Portfolio

            18.1.3.3. Profitability by Market Segments (Product/Age /Sales Channel/Region)

            18.1.3.4. Sales Footprint

            18.1.3.5. Strategy Overview

                18.1.3.5.1. Marketing Strategy

                18.1.3.5.2. Product Strategy

                18.1.3.5.3. Channel Strategy

        18.1.4. Woodly Oy

            18.1.4.1. Overview

            18.1.4.2. Product Portfolio

            18.1.4.3. Profitability by Market Segments (Product/Age /Sales Channel/Region)

            18.1.4.4. Sales Footprint

            18.1.4.5. Strategy Overview

                18.1.4.5.1. Marketing Strategy

                18.1.4.5.2. Product Strategy

                18.1.4.5.3. Channel Strategy

        18.1.5. Sandland Packaging Ltd.

            18.1.5.1. Overview

            18.1.5.2. Product Portfolio

            18.1.5.3. Profitability by Market Segments (Product/Age /Sales Channel/Region)

            18.1.5.4. Sales Footprint

            18.1.5.5. Strategy Overview

                18.1.5.5.1. Marketing Strategy

                18.1.5.5.2. Product Strategy

                18.1.5.5.3. Channel Strategy

        18.1.6. Hartmann

            18.1.6.1. Overview

            18.1.6.2. Product Portfolio

            18.1.6.3. Profitability by Market Segments (Product/Age /Sales Channel/Region)

            18.1.6.4. Sales Footprint

            18.1.6.5. Strategy Overview

                18.1.6.5.1. Marketing Strategy

                18.1.6.5.2. Product Strategy

                18.1.6.5.3. Channel Strategy

        18.1.7. Tetra Pak

            18.1.7.1. Overview

            18.1.7.2. Product Portfolio

            18.1.7.3. Profitability by Market Segments (Product/Age /Sales Channel/Region)

            18.1.7.4. Sales Footprint

            18.1.7.5. Strategy Overview

                18.1.7.5.1. Marketing Strategy

                18.1.7.5.2. Product Strategy

                18.1.7.5.3. Channel Strategy

        18.1.8. BioPak

            18.1.8.1. Overview

            18.1.8.2. Product Portfolio

            18.1.8.3. Profitability by Market Segments (Product/Age /Sales Channel/Region)

            18.1.8.4. Sales Footprint

            18.1.8.5. Strategy Overview

                18.1.8.5.1. Marketing Strategy

                18.1.8.5.2. Product Strategy

                18.1.8.5.3. Channel Strategy

19. Assumptions & Acronyms Used

20. Research Methodology

List of Tables

Table 1: Global Value (US$ Million) Forecast by Region, 2018 to 2033

Table 2: Global Volume (Tonnes) Forecast by Region, 2018 to 2033

Table 3: Global Value (US$ Million) Forecast by Material, 2018 to 2033

Table 4: Global Volume (Tonnes) Forecast by Material, 2018 to 2033

Table 5: Global Value (US$ Million) Forecast by Packaging Formats, 2018 to 2033

Table 6: Global Volume (Tonnes) Forecast by Packaging Formats, 2018 to 2033

Table 7: Global Value (US$ Million) Forecast by End Use, 2018 to 2033

Table 8: Global Volume (Tonnes) Forecast by End Use, 2018 to 2033

Table 9: North America Value (US$ Million) Forecast by Country, 2018 to 2033

Table 10: North America Volume (Tonnes) Forecast by Country, 2018 to 2033

Table 11: North America Value (US$ Million) Forecast by Material, 2018 to 2033

Table 12: North America Volume (Tonnes) Forecast by Material, 2018 to 2033

Table 13: North America Value (US$ Million) Forecast by Packaging Formats, 2018 to 2033

Table 14: North America Volume (Tonnes) Forecast by Packaging Formats, 2018 to 2033

Table 15: North America Value (US$ Million) Forecast by End Use, 2018 to 2033

Table 16: North America Volume (Tonnes) Forecast by End Use, 2018 to 2033

Table 17: Latin America Value (US$ Million) Forecast by Country, 2018 to 2033

Table 18: Latin America Volume (Tonnes) Forecast by Country, 2018 to 2033

Table 19: Latin America Value (US$ Million) Forecast by Material, 2018 to 2033

Table 20: Latin America Volume (Tonnes) Forecast by Material, 2018 to 2033

Table 21: Latin America Value (US$ Million) Forecast by Packaging Formats, 2018 to 2033

Table 22: Latin America Volume (Tonnes) Forecast by Packaging Formats, 2018 to 2033

Table 23: Latin America Value (US$ Million) Forecast by End Use, 2018 to 2033

Table 24: Latin America Volume (Tonnes) Forecast by End Use, 2018 to 2033

Table 25: Europe Value (US$ Million) Forecast by Country, 2018 to 2033

Table 26: Europe Volume (Tonnes) Forecast by Country, 2018 to 2033

Table 27: Europe Value (US$ Million) Forecast by Material, 2018 to 2033

Table 28: Europe Volume (Tonnes) Forecast by Material, 2018 to 2033

Table 29: Europe Value (US$ Million) Forecast by Packaging Formats, 2018 to 2033

Table 30: Europe Volume (Tonnes) Forecast by Packaging Formats, 2018 to 2033

Table 31: Europe Value (US$ Million) Forecast by End Use, 2018 to 2033

Table 32: Europe Volume (Tonnes) Forecast by End Use, 2018 to 2033

Table 33: East Asia Value (US$ Million) Forecast by Country, 2018 to 2033

Table 34: East Asia Volume (Tonnes) Forecast by Country, 2018 to 2033

Table 35: East Asia Value (US$ Million) Forecast by Material, 2018 to 2033

Table 36: East Asia Volume (Tonnes) Forecast by Material, 2018 to 2033

Table 37: East Asia Value (US$ Million) Forecast by Packaging Formats, 2018 to 2033

Table 38: East Asia Volume (Tonnes) Forecast by Packaging Formats, 2018 to 2033

Table 39: East Asia Value (US$ Million) Forecast by End Use, 2018 to 2033

Table 40: East Asia Volume (Tonnes) Forecast by End Use, 2018 to 2033

Table 41: South Asia Value (US$ Million) Forecast by Country, 2018 to 2033

Table 42: South Asia Volume (Tonnes) Forecast by Country, 2018 to 2033

Table 43: South Asia Value (US$ Million) Forecast by Material, 2018 to 2033

Table 44: South Asia Volume (Tonnes) Forecast by Material, 2018 to 2033

Table 45: South Asia Value (US$ Million) Forecast by Packaging Formats, 2018 to 2033

Table 46: South Asia Volume (Tonnes) Forecast by Packaging Formats, 2018 to 2033

Table 47: South Asia Value (US$ Million) Forecast by End Use, 2018 to 2033

Table 48: South Asia Volume (Tonnes) Forecast by End Use, 2018 to 2033

Table 49: Oceania Value (US$ Million) Forecast by Country, 2018 to 2033

Table 50: Oceania Volume (Tonnes) Forecast by Country, 2018 to 2033

Table 51: Oceania Value (US$ Million) Forecast by Material, 2018 to 2033

Table 52: Oceania Volume (Tonnes) Forecast by Material, 2018 to 2033

Table 53: Oceania Value (US$ Million) Forecast by Packaging Formats, 2018 to 2033

Table 54: Oceania Volume (Tonnes) Forecast by Packaging Formats, 2018 to 2033

Table 55: Oceania Value (US$ Million) Forecast by End Use, 2018 to 2033

Table 56: Oceania Volume (Tonnes) Forecast by End Use, 2018 to 2033

Table 57: MEA Value (US$ Million) Forecast by Country, 2018 to 2033

Table 58: MEA Volume (Tonnes) Forecast by Country, 2018 to 2033

Table 59: MEA Value (US$ Million) Forecast by Material, 2018 to 2033

Table 60: MEA Volume (Tonnes) Forecast by Material, 2018 to 2033

Table 61: MEA Value (US$ Million) Forecast by Packaging Formats, 2018 to 2033

Table 62: MEA Volume (Tonnes) Forecast by Packaging Formats, 2018 to 2033

Table 63: MEA Value (US$ Million) Forecast by End Use, 2018 to 2033

Table 64: MEA Volume (Tonnes) Forecast by End Use, 2018 to 2033

List of Charts

Figure 1: Global Value (US$ Million) by Material, 2023 to 2033

Figure 2: Global Value (US$ Million) by Packaging Formats, 2023 to 2033

Figure 3: Global Value (US$ Million) by End Use, 2023 to 2033

Figure 4: Global Value (US$ Million) by Region, 2023 to 2033

Figure 5: Global Value (US$ Million) Analysis by Region, 2018 to 2033

Figure 6: Global Volume (Tonnes) Analysis by Region, 2018 to 2033

Figure 7: Global Value Share (%) and BPS Analysis by Region, 2023 to 2033

Figure 8: Global Carbon-negative Packaging Y-o-Y Growth (%) Projections by Region, 2023 to 2033

Figure 9: Global Value (US$ Million) Analysis by Material, 2018 to 2033

Figure 10: Global Volume (Tonnes) Analysis by Material, 2018 to 2033

Figure 11: Global Value Share (%) and BPS Analysis by Material, 2023 to 2033

Figure 12: Global Carbon-negative Packaging Y-o-Y Growth (%) Projections by Material, 2023 to 2033

Figure 13: Global Value (US$ Million) Analysis by Packaging Formats, 2018 to 2033

Figure 14: Global Volume (Tonnes) Analysis by Packaging Formats, 2018 to 2033

Figure 15: Global Value Share (%) and BPS Analysis by Packaging Formats, 2023 to 2033

Figure 16: Global Carbon-negative Packaging Y-o-Y Growth (%) Projections by Packaging Formats, 2023 to 2033

Figure 17: Global Value (US$ Million) Analysis by End Use, 2018 to 2033

Figure 18: Global Volume (Tonnes) Analysis by End Use, 2018 to 2033

Figure 19: Global Value Share (%) and BPS Analysis by End Use, 2023 to 2033

Figure 20: Global Carbon-negative Packaging Y-o-Y Growth (%) Projections by End Use, 2023 to 2033

Figure 21: Global Attractiveness by Material, 2023 to 2033

Figure 22: Global Attractiveness by Packaging Formats, 2023 to 2033

Figure 23: Global Attractiveness by End Use, 2023 to 2033

Figure 24: Global Attractiveness by Region, 2023 to 2033

Figure 25: North America Value (US$ Million) by Material, 2023 to 2033

Figure 26: North America Value (US$ Million) by Packaging Formats, 2023 to 2033

Figure 27: North America Value (US$ Million) by End Use, 2023 to 2033

Figure 28: North America Value (US$ Million) by Country, 2023 to 2033

Figure 29: North America Value (US$ Million) Analysis by Country, 2018 to 2033

Figure 30: North America Volume (Tonnes) Analysis by Country, 2018 to 2033

Figure 31: North America Value Share (%) and BPS Analysis by Country, 2023 to 2033

Figure 32: North America Carbon-negative Packaging Y-o-Y Growth (%) Projections by Country, 2023 to 2033

Figure 33: North America Value (US$ Million) Analysis by Material, 2018 to 2033

Figure 34: North America Volume (Tonnes) Analysis by Material, 2018 to 2033

Figure 35: North America Value Share (%) and BPS Analysis by Material, 2023 to 2033

Figure 36: North America Carbon-negative Packaging Y-o-Y Growth (%) Projections by Material, 2023 to 2033

Figure 37: North America Value (US$ Million) Analysis by Packaging Formats, 2018 to 2033

Figure 38: North America Volume (Tonnes) Analysis by Packaging Formats, 2018 to 2033

Figure 39: North America Value Share (%) and BPS Analysis by Packaging Formats, 2023 to 2033

Figure 40: North America Carbon-negative Packaging Y-o-Y Growth (%) Projections by Packaging Formats, 2023 to 2033

Figure 41: North America Value (US$ Million) Analysis by End Use, 2018 to 2033

Figure 42: North America Volume (Tonnes) Analysis by End Use, 2018 to 2033

Figure 43: North America Value Share (%) and BPS Analysis by End Use, 2023 to 2033

Figure 44: North America Carbon-negative Packaging Y-o-Y Growth (%) Projections by End Use, 2023 to 2033

Figure 45: North America Attractiveness by Material, 2023 to 2033

Figure 46: North America Attractiveness by Packaging Formats, 2023 to 2033

Figure 47: North America Attractiveness by End Use, 2023 to 2033

Figure 48: North America Attractiveness by Country, 2023 to 2033

Figure 49: Latin America Value (US$ Million) by Material, 2023 to 2033

Figure 50: Latin America Value (US$ Million) by Packaging Formats, 2023 to 2033

Figure 51: Latin America Value (US$ Million) by End Use, 2023 to 2033

Figure 52: Latin America Value (US$ Million) by Country, 2023 to 2033

Figure 53: Latin America Value (US$ Million) Analysis by Country, 2018 to 2033

Figure 54: Latin America Volume (Tonnes) Analysis by Country, 2018 to 2033

Figure 55: Latin America Value Share (%) and BPS Analysis by Country, 2023 to 2033

Figure 56: Latin America Carbon-negative Packaging Y-o-Y Growth (%) Projections by Country, 2023 to 2033

Figure 57: Latin America Value (US$ Million) Analysis by Material, 2018 to 2033

Figure 58: Latin America Volume (Tonnes) Analysis by Material, 2018 to 2033

Figure 59: Latin America Value Share (%) and BPS Analysis by Material, 2023 to 2033

Figure 60: Latin America Carbon-negative Packaging Y-o-Y Growth (%) Projections by Material, 2023 to 2033

Figure 61: Latin America Value (US$ Million) Analysis by Packaging Formats, 2018 to 2033

Figure 62: Latin America Volume (Tonnes) Analysis by Packaging Formats, 2018 to 2033

Figure 63: Latin America Value Share (%) and BPS Analysis by Packaging Formats, 2023 to 2033

Figure 64: Latin America Carbon-negative Packaging Y-o-Y Growth (%) Projections by Packaging Formats,2023 to 2033

Figure 65: Latin America Value (US$ Million) Analysis by End Use, 2018 to 2033

Figure 66: Latin America Volume (Tonnes) Analysis by End Use, 2018 to 2033

Figure 67: Latin America Value Share (%) and BPS Analysis by End Use, 2023 to 2033

Figure 68: Latin America Carbon-negative Packaging Y-o-Y Growth (%) Projections by End Use, 2023 to 2033

Figure 69: Latin America Attractiveness by Material, 2023 to 2033

Figure 70: Latin America Attractiveness by Packaging Formats, 2023 to 2033

Figure 71: Latin America Attractiveness by End Use, 2023 to 2033

Figure 72: Latin America Attractiveness by Country, 2023 to 2033

Figure 73: Europe Value (US$ Million) by Material, 2023 to 2033

Figure 74: Europe Value (US$ Million) by Packaging Formats, 2023 to 2033

Figure 75: Europe Value (US$ Million) by End Use, 2023 to 2033

Figure 76: Europe Value (US$ Million) by Country, 2023 to 2033

Figure 77: Europe Value (US$ Million) Analysis by Country, 2018 to 2033

Figure 78: Europe Volume (Tonnes) Analysis by Country, 2018 to 2033

Figure 79: Europe Value Share (%) and BPS Analysis by Country, 2023 to 2033

Figure 80: Europe Carbon-negative Packaging Y-o-Y Growth (%) Projections by Country, 2023 to 2033

Figure 81: Europe Value (US$ Million) Analysis by Material, 2018 to 2033

Figure 82: Europe Volume (Tonnes) Analysis by Material, 2018 to 2033

Figure 83: Europe Value Share (%) and BPS Analysis by Material, 2023 to 2033

Figure 84: Europe Carbon-negative Packaging Y-o-Y Growth (%) Projections by Material, 2023 to 2033

Figure 85: Europe Value (US$ Million) Analysis by Packaging Formats, 2018 to 2033

Figure 86: Europe Volume (Tonnes) Analysis by Packaging Formats, 2018 to 2033

Figure 87: Europe Value Share (%) and BPS Analysis by Packaging Formats,2023 to 2033

Figure 88: Europe Carbon-negative Packaging Y-o-Y Growth (%) Projections by Packaging Formats, 2023 to 2033

Figure 89: Europe Value (US$ Million) Analysis by End Use, 2018 to 2033

Figure 90: Europe Volume (Tonnes) Analysis by End Use, 2018 to 2033

Figure 91: Europe Value Share (%) and BPS Analysis by End Use, 2023 to 2033

Figure 92: Europe Carbon-negative Packaging Y-o-Y Growth (%) Projections by End Use, 2023 to 2033

Figure 93: Europe Attractiveness by Material, 2023 to 2033

Figure 94: Europe Attractiveness by Packaging Formats, 2023 to 2033

Figure 95: Europe Attractiveness by End Use, 2023 to 2033

Figure 96: Europe Attractiveness by Country, 2023 to 2033

Figure 97: East Asia Value (US$ Million) by Material, 2023 to 2033

Figure 98: East Asia Value (US$ Million) by Packaging Formats, 2023 to 2033

Figure 99: East Asia Value (US$ Million) by End Use, 2023 to 2033

Figure 100: East Asia Value (US$ Million) by Country, 2023 to 2033

Figure 101: East Asia Value (US$ Million) Analysis by Country, 2018 to 2033

Figure 102: East Asia Volume (Tonnes) Analysis by Country, 2018 to 2033

Figure 103: East Asia Value Share (%) and BPS Analysis by Country, 2023 to 2033

Figure 104: East Asia Carbon-negative Packaging Y-o-Y Growth (%) Projections by Country, 2023 to 2033

Figure 105: East Asia Value (US$ Million) Analysis by Material, 2018 to 2033

Figure 106: East Asia Volume (Tonnes) Analysis by Material, 2018 to 2033

Figure 107: East Asia Value Share (%) and BPS Analysis by Material, 2023 to 2033

Figure 108: East Asia Carbon-negative Packaging Y-o-Y Growth (%) Projections by Material, 2023 to 2033

Figure 109: East Asia Value (US$ Million) Analysis by Packaging Formats, 2018 to 2033

Figure 110: East Asia Volume (Tonnes) Analysis by Packaging Formats, 2018 to 2033

Figure 111: East Asia Value Share (%) and BPS Analysis by Packaging Formats, 2023 to 2033

Figure 112: East Asia Carbon-negative Packaging Y-o-Y Growth (%) Projections by Packaging Formats, 2023 to 2033

Figure 113: East Asia Value (US$ Million) Analysis by End Use, 2018 to 2033

Figure 114: East Asia Volume (Tonnes) Analysis by End Use, 2018 to 2033

Figure 115: East Asia Value Share (%) and BPS Analysis by End Use, 2023 to 2033

Figure 116: East Asia Carbon-negative Packaging Y-o-Y Growth (%) Projections by End Use, 2023 to 2033

Figure 117: East Asia Attractiveness by Material, 2023 to 2033

Figure 118: East Asia Attractiveness by Packaging Formats, 2023 to 2033

Figure 119: East Asia Attractiveness by End Use, 2023 to 2033

Figure 120: East Asia Attractiveness by Country, 2023 to 2033

Figure 121: South Asia Value (US$ Million) by Material, 2023 to 2033

Figure 122: South Asia Value (US$ Million) by Packaging Formats, 2023 to 2033

Figure 123: South Asia Value (US$ Million) by End Use, 2023 to 2033

Figure 124: South Asia Value (US$ Million) by Country, 2023 to 2033

Figure 125: South Asia Value (US$ Million) Analysis by Country, 2018 to 2033

Figure 126: South Asia Volume (Tonnes) Analysis by Country, 2018 to 2033

Figure 127: South Asia Value Share (%) and BPS Analysis by Country, 2023 to 2033

Figure 128: South Asia Carbon-negative Packaging Y-o-Y Growth (%) Projections by Country, 2023 to 2033

Figure 129: South Asia Value (US$ Million) Analysis by Material, 2018 to 2033

Figure 130: South Asia Volume (Tonnes) Analysis by Material, 2018 to 2033

Figure 131: South Asia Value Share (%) and BPS Analysis by Material, 2023 to 2033

Figure 132: South Asia Carbon-negative Packaging Y-o-Y Growth (%) Projections by Material, 2023 to 2033

Figure 133: South Asia Value (US$ Million) Analysis by Packaging Formats, 2018 to 2033

Figure 134: South Asia Volume (Tonnes) Analysis by Packaging Formats, 2018 to 2033

Figure 135: South Asia Value Share (%) and BPS Analysis by Packaging Formats, 2023 to 2033

Figure 136: South Asia Carbon-negative Packaging Y-o-Y Growth (%) Projections by Packaging Formats, 2023 to 2033

Figure 137: South Asia Value (US$ Million) Analysis by End Use, 2018 to 2033

Figure 138: South Asia Volume (Tonnes) Analysis by End Use, 2018 to 2033

Figure 139: South Asia Value Share (%) and BPS Analysis by End Use, 2023 to 2033

Figure 140: South Asia Carbon-negative Packaging Y-o-Y Growth (%) Projections by End Use, 2023 to 2033

Figure 141: South Asia Attractiveness by Material, 2023 to 2033

Figure 142: South Asia Attractiveness by Packaging Formats, 2023 to 2033

Figure 143: South Asia Attractiveness by End Use, 2023 to 2033

Figure 144: South Asia Attractiveness by Country, 2023 to 2033

Figure 145: Oceania Value (US$ Million) by Material, 2023 to 2033

Figure 146: Oceania Value (US$ Million) by Packaging Formats, 2023 to 2033

Figure 147: Oceania Value (US$ Million) by End Use, 2023 to 2033

Figure 148: Oceania Value (US$ Million) by Country, 2023 to 2033

Figure 149: Oceania Value (US$ Million) Analysis by Country, 2018 to 2033

Figure 150: Oceania Volume (Tonnes) Analysis by Country, 2018 to 2033

Figure 151: Oceania Value Share (%) and BPS Analysis by Country, 2023 to 2033

Figure 152: Oceania Carbon-negative Packaging Y-o-Y Growth (%) Projections by Country, 2023 to 2033

Figure 153: Oceania Value (US$ Million) Analysis by Material, 2018 to 2033

Figure 154: Oceania Volume (Tonnes) Analysis by Material, 2018 to 2033

Figure 155: Oceania Value Share (%) and BPS Analysis by Material, 2023 to 2033

Figure 156: Oceania Carbon-negative Packaging Y-o-Y Growth (%) Projections by Material, 2023 to 2033

Figure 157: Oceania Value (US$ Million) Analysis by Packaging Formats, 2018 to 2033

Figure 158: Oceania Volume (Tonnes) Analysis by Packaging Formats, 2018 to 2033

Figure 159: Oceania Value Share (%) and BPS Analysis by Packaging Formats, 2023 to 2033

Figure 160: Oceania Carbon-negative Packaging Y-o-Y Growth (%) Projections by Packaging Formats, 2023 to 2033

Figure 161: Oceania Value (US$ Million) Analysis by End Use, 2018 to 2033

Figure 162: Oceania Volume (Tonnes) Analysis by End Use, 2018 to 2033

Figure 163: Oceania Value Share (%) and BPS Analysis by End Use, 2023 to 2033

Figure 164: Oceania Carbon-negative Packaging Y-o-Y Growth (%) Projections by End Use, 2023 to 2033

Figure 165: Oceania Attractiveness by Material, 2023 to 2033

Figure 166: Oceania Attractiveness by Packaging Formats, 2023 to 2033

Figure 167: Oceania Attractiveness by End Use, 2023 to 2033

Figure 168: Oceania Attractiveness by Country, 2023 to 2033

Figure 169: MEA Value (US$ Million) by Material, 2023 to 2033

Figure 170: MEA Value (US$ Million) by Packaging Formats, 2023 to 2033

Figure 171: MEA Value (US$ Million) by End Use, 2023 to 2033

Figure 172: MEA Value (US$ Million) by Country, 2023 to 2033

Figure 173: MEA Value (US$ Million) Analysis by Country, 2018 to 2033

Figure 174: MEA Volume (Tonnes) Analysis by Country, 2018 to 2033

Figure 175: MEA Value Share (%) and BPS Analysis by Country, 2023 to 2033

Figure 176: MEA Carbon-negative Packaging Y-o-Y Growth (%) Projections by Country, 2023 to 2033

Figure 177: MEA Value (US$ Million) Analysis by Material, 2018 to 2033

Figure 178: MEA Volume (Tonnes) Analysis by Material, 2018 to 2033

Figure 179: MEA Value Share (%) and BPS Analysis by Material, 2023 to 2033

Figure 180: MEA Carbon-negative Packaging Y-o-Y Growth (%) Projections by Material, 2023 to 2033

Figure 181: MEA Value (US$ Million) Analysis by Packaging Formats, 2018 to 2033

Figure 182: MEA Volume (Tonnes) Analysis by Packaging Formats, 2018 to 2033

Figure 183: MEA Value Share (%) and BPS Analysis by Packaging Formats, 2023 to 2033

Figure 184: MEA Carbon-negative Packaging Y-o-Y Growth (%) Projections by Packaging Formats, 2023 to 2033

Figure 185: MEA Value (US$ Million) Analysis by End Use, 2018 to 2033

Figure 186: MEA Volume (Tonnes) Analysis by End Use, 2018 to 2033

Figure 187: MEA Value Share (%) and BPS Analysis by End Use, 2023 to 2033

Figure 188: MEA Carbon-negative Packaging Y-o-Y Growth (%) Projections by End Use, 2023 to 2033

Figure 189: MEA Attractiveness by Material, 2023 to 2033

Figure 190: MEA Attractiveness by Packaging Formats, 2023 to 2033

Figure 191: MEA Attractiveness by End Use, 2023 to 2033

Figure 192: MEA Attractiveness by Country, 2023 to 2033

Recommendations

Packaging

Beverage Packaging Market

Published : October 2023

Packaging

Biodegradable Packaging Market

Published : September 2022

Explore Packaging Insights

View Reports

Carbon-negative Packaging Market