Corrugated boxes are indeed basic forms of packaging that are used by almost all industries-from food and beverages to electronics and e-commerce, and to the industrial goods. Due to their excellent durability, lightweight construction, recyclability, and cost-effective nature, corrugated boxes have retained their position as the leading form of packaging in the global packaging strategies.
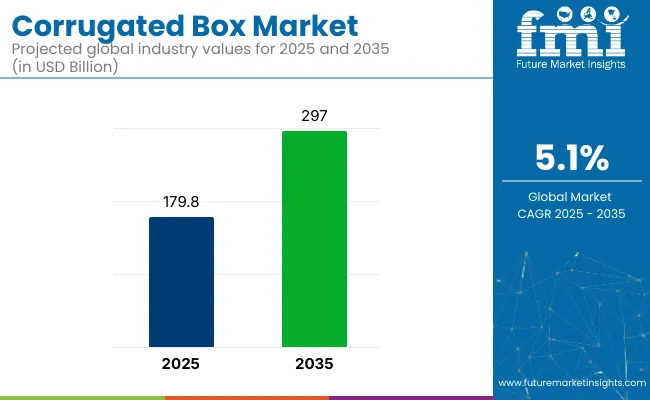
According to industry estimates, the global corrugated box market would amount to USD 152.7 billion by 2025 and then grow further at a CAGR of 4.3% to arrive at around USD 232.8 billion by 2035. The primary causes of such growth are attributed to the continuous growing e-commerce business and demand for greener packaging and long global supply chains. Continued innovations in box structure, digital printing, and lightweight yet strong substrate materials are shaping the future of this market.
Demand for on-demand corrugated packaging is growing due to the increased shift toward local production with dispersed warehousing. Moisture-resistant coatings have extended the application of boxes in cold chain and outdoor use. Low-VOC and compostable ink formulations are starting to gain traction in the area of improved sustainability. When it comes to visual storytelling and consumer experience, brands are starting to look at the opportunity of corrugated packaging. The future for such boxes is also witnessed rising trend with increasing adoption of automation-compatible designs in robotic fulfillmentcenters.
Key Market Metrics
Metric | Value |
---|---|
Market Size in 2025 | USD 152.7 Billion |
Projected Market Size in 2035 | USD 232.8 Billion |
CAGR (2025 to 2035) | 4.3% |
Single-wall, double-wall, and special printed corrugated boxes are the main growth areas as industries require lightweight protection, bespoke branding, and least environmental footprint. Advances in paper strength, recyclability, and automated converting machinery enable scalability.
Moisture-barrier coatings and tear-resistant liners are being integrated to improve longevity. Intelligent box templates are being launched to allow quicker prototyping and customization. AI-driven structural engineering software is enabling packaging performance optimization with lower material consumption.
Single-Wall Corrugated Boxes Lead for Cost-Effective Packaging
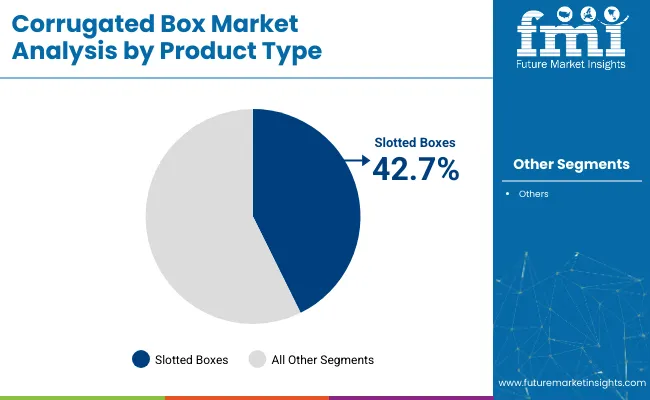
Single-wall boxes continue to be the norm for retail, small goods, and subscription packaging because of their weight, cost, and protection balance. Brands leverage recyclable liners, digital printing, and die-cut windowing to maximize product visibility. Lightweight formats are best suited for fast-moving consumer goods (FMCG) and e-commerce. Perforated tear-open panels are becoming increasingly popular for convenience and ease of use. Custom inlays and partitions are also being launched to safeguard fragile items during last-mile delivery.
Double-Wall Boxes Expand in Industrial and Heavy-Duty Applications
Double-wall corrugated boxes provide increased stacking strength and durability for heavy or delicate products. These are extensively utilized in automotive, furniture, and electronics shipping. Reinforced edges and coated liners enhance protection during long-distance transit and moisture resistance.
Custom Printed Boxes Elevate Branding and Unboxing Experience
Custom printed boxes are popular across the luxury, health, and lifestyle categories. Companies use high-res graphics, foil stamping, and AR-based prints to engage consumers. QR-code enabled promotions and interactive box elements influence further engagement and repeated purchases. Personalized messages and interior printing are improving the unboxing experience.
Biodegradable ink and coating are helping support sustainability. Built-in NFC chips are allowing for product authentication and smart engagement. Certain brands apply heat-sensitive inks for surprise visuals. Limited-edition box art is also being utilized as a collector's incentive.
The Asia-Pacific region holds the title of the largest and most rapidly growing corrugated box market due to the significant growth in e-commerce, manufacturing, and consumer goods. Countries such as China, India, Vietnam, and Indonesia are rapidly increasing their corrugated product manufacturing capacity to meet the domestic and export needs for packaging.
Government incentives for sustainable packaging and an expanding logistics network further encourage adoption in this effort. The demand for corrugated boxes in last-mile delivery and custom packaging is particularly on the rise. Investment in automated corrugated production lines across leading industrial hubs is intensifying.
Corrugated suppliers collaborate with logistics companies to develop packaging that meets regional shipping conditions. Custom box design services are in high demand from small and medium online sellers. With higher digital literacy and smartphone penetration, the use of QR-enabled corrugated packaging seems to thrive. Lastly, regional free trade agreements facilitate flows of packaged goods across borders which ultimately contributes to box usage in intra-Asia trade.
The huge market share of North America is essentially due to the mature retail and e-commerce ecosystem in North America. Although the United States is the most important nation demanding double-wall and heavy-duty corrugated solutions for industrial shipments and bulk distribution, the most important megapushing force driving consumption is recycled content, renewable energy use in production, and high-performance printing capabilities.
Packaging companies are also integrating AI for smart box design and production optimization. The new drive in cold chain logistics and medical supply chains has increased the requirement for moisture resistant corrugated packaging. Regional fulfillment centers are pushing for just-in-time box production to reduce inventory costs.
Retailers are putting money into branded recyclable packaging to improve the experience for the consumer. Smart packaging with RFID and anti-counterfeit characteristics is emerging and catching wind in the special sections of high-value products.
Europe has been among the early starters for providing a socially responsible vision for packaging, and the very idea of using corrugated boxes fits well with the EU objectives for circular economy practices. Corrugated formats are increasingly being preferred for B2B and B2C shipments in countries like the UK, Germany, France, and the Nordics.
Innovations in folding techniques, barrier coatings, and the use of recyclable adhesives are continually improving the box's functionality while minimizing the ecological footprint. The growing demand is also being fueled by the expanding regional fulfillment hubs and the cross-border e-commerce business. The government is supporting the use of FSC-certified materials or packaging with low emissions through several policy measures.
Digital printing systems for high-resolution branding are gaining acceptance with traceability features. The cold-chain market and health-care-related continuous shipments in Europe are now switching to corrugated alternatives for insulated shipping. Furthermore, the region is witnessing increased interest in reusable corrugated packages for closed-loop logistics systems.
Challenges
Fluctuating raw material costs and recyclability limitations Volatility in paper pulp prices and water-intensive production processes pose ongoing challenges. Achieving high moisture resistance while maintaining recyclability is a common packaging trade-off.
Opportunities
Smart packaging integration and digital transformation Opportunities are emerging through smart boxes with QR codes, tamper-evident designs, and RFID labeling. Custom printing, augmented reality features, and AI-assisted design tools are enabling packaging that supports both functionality and consumer engagement.
From 2020 to 2024, booming demand is driving pandemic induced ecommerce up. Consumers require contactless delivery options. Companies have taken aggressive stances on recyclable and hygienic materials, with innovations on light weighting and reducing shipping costs.
The market will then evolve-in terms of demand forecasting using AI-with modular packaging system and implementing further automation in box manufacture in 2025 to 2035. Corrugated boxes shall play a better role in data-driven logistics, personalization and climate-conscious supply chains. Real-time tracking and embedded sensors will increase traceability and product protection.
Design tendencies will favor high-impact visuals using low-voc digital inks. Local manufacturing hubs will see a significant increase in numbers by being sources of fast-turnaround, on-demand corrugated solutions. Packaging will act more and more as a brand engagement platform through AR and QR integrations. Enhanced durability and moisture control can further increase the field of application into medical and cold chain logistics.
Market Shifts: A Comparative Analysis (2020 to 2024 vs. 2025 to 2035)
Market Shift | 2020 to 2024 Trends |
---|---|
Regulatory Landscape | Growth in packaging waste regulation and green labeling . |
Material Innovation | Recycled paperboard and weight reduction. |
Industry Adoption | Dominated by e-commerce, retail, and food delivery. |
Market Competition | Fragmented with strong regional presence. |
Market Growth Drivers | Surge in online shopping and flexible packaging. |
Sustainability and Environmental Impact | Reduction in plastic usage and improved recyclability. |
Integration of AI and Process Optimization | Semi-automated lines and digital print-on-demand. |
Advancements in Packaging Technology | Basic folding boxes and flexo printing. |
Market Shift | 2025 to 2035 Projections |
---|---|
Regulatory Landscape | Global alignment on circular economy packaging standards and stricter EPR mandates. |
Material Innovation | Development of moisture-resistant, biodegradable, and smart-enabled corrugated materials. |
Industry Adoption | Broader integration in pharma, industrial automation, and omnichannel supply chains. |
Market Competition | Consolidation through digital platforms, cloud-based production, and real-time design platforms. |
Market Growth Drivers | AI-optimized logistics, ESG reporting demands, and resilient global trade systems. |
Sustainability and Environmental Impact | Mainstreaming of zero-waste corrugated supply chains and renewable packaging certifications. |
Integration of AI and Process Optimization | Fully automated, AI-integrated factories with modular, smart packaging flows. |
Advancements in Packaging Technology | High-strength, interactive, and customized designs with data and product security integration. |
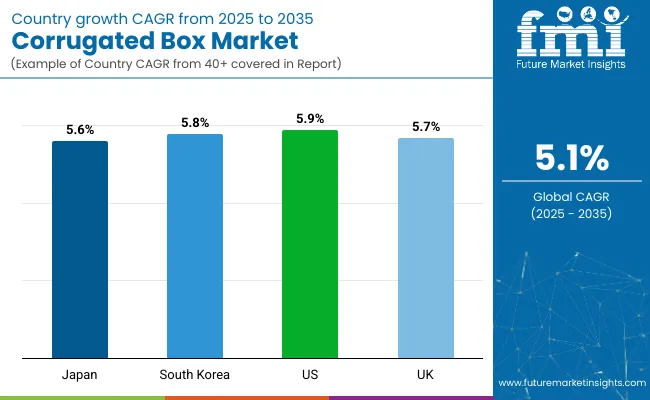
The corrugated box market in the United States has burgeoned with the phenomenal rise of e-commerce, food delivery, and retail logistics. Cost-effective, recyclable, and protective boxes have earned preference in the mass adoption by industries. USA Manufacturers use light fluting, turnkey paper liners with high-strength, and moisture-proof coatings for enhanced performance.
Such advances include smart tracking labels, QR coded authentication, and digital printing, thus enhancing supply chain traceability and brand presentation. Companies are also exploring multi-depth boxes and easy-fold formats to improve fulfillment efficiency and reduce material waste.
Temperature-sensitive corrugated packaging is being developed for pharmaceuticals and perishables. AI-driven box-sizing systems are helping warehouses reduce void fill and optimize space. Last but not least is the penchant creating demand for new and innovative designs in printed interiors of boxes for unboxing experience in consumers.
Country | CAGR (2025 to 2035) |
---|---|
United States | 5.9% |
The UK corrugated box market is still on an upward path, thanks to increased consumption in sustainable retail packaging, grocery delivery, and pharmaceutical distribution. When eco-friendliness is prioritized by consumers and businesses alike, companies are going ahead to develop fully recyclable, plastic-free corrugated formats.
Manufacturers are coming up with custom-designed tear-resistant boxes featuring printed brand identification, easy-tear strips, and tamper-evident closures. Government initiatives to promote circular packaging and enact extended producer responsibility (EPR) schemes are further aiding market growth.
Evolve packaging trends have also brought about innovations in compact box designs that can be returned. Heavy-duty packaging lines are incorporating RFID tracking for accuracy in logistics. Meanwhile, anti-moisture coatings are being tested for shipping grocery and chilled goods. AI-based box assembly is being used in high-speed fulfillment operations.
Country | CAGR (2025 to 2035) |
---|---|
United Kingdom | 5.7% |
The market for corrugated boxes in Japan depends on an accurate design, compact packaging, and consumer experience. An example of their specific emphasis is sustainability and aesthetics as they manufacture very lightweight but strong boxes suited for the electronics, cosmetics, and food industries. Their otherwise densely populated urban logistic demand foldable, stackable, and 0-defect packaging solutions for big products.
High-definition die-cutting and anti-humidity coatings enhance the performances of fresh produce and temperature-sensitive shipments. The Japan companies have included smart tags which could be amplified with other interesting features in unboxing. Temperature-sensitive inks are also utilized in this usage as freshness indicators. More compact designs with built-in handles improve convenience for final delivery miles. Increased precision with lower packaging waste results from modern innovations in AI-powered quality control systems.
Country | CAGR (2025 to 2035) |
---|---|
Japan | 5.6% |
With K-mail commerce, exports of electronics goods, and home meal kits booming, the South Korean market for corrugated boxes is thriving. Corrugated packaging provides cushioning, excellent printing properties, and recyclability. Manufacturers are developing AI-based converting systems, biodegradable adhesives, and automated print inspection to satisfy quality and environmental requirements.
Smart box innovations include RFID labeling, temperature indicators, and modular packaging for individualized fulfillment. Eco-packaging policies promoted by the government and consumer preference against plastic packaging are fast-tracking the adoption of corrugated boxes. Antimicrobial coatings are being researched for food applications. Production of custom-sized boxes through AI is optimizing the use of raw materials. Interactive packaging embedded with AR experiences is gaining momentum in retail marketing.
Country | CAGR (2025 to 2035) |
---|---|
South Korea | 5.8% |
Producers are investing in recyclable coatings, biodegradable adhesives, and AI-optimized cutting systems to drive eco-performance. Intelligent packaging elements such as track-and-trace sensors, inventory-linked codes, and real-time delivery notifications are enhancing logistics transparency.
Digital twin modeling and predictive analytics assist brands in minimizing overpacking and box size optimization. Blockchain technology is being tested to enhance packaging provenance and security. Smart inks and embedded sensors are allowing real-time temperature and freshness tracking. Augmented reality (AR) overlays are being investigated to provide interactive unpacking instructions and promotional materials.
As the world transitions towards sustainable, functional, and customer-focused packaging, corrugated boxes will continue to be the backbone of international supply chains. Ongoing innovation in materials, design, and automation will define the next generation of corrugated packaging solutions.
Corrugated Box Market Maintains Market Relevance as Global Packaging and E-Commerce Sectors Expand
Corrugated boxes remain the backbone of the packaging industry, offering durable, cost-effective, and recyclable solutions for transporting goods across sectors such as e-commerce, retail, food and beverage, manufacturing, and logistics. Their structural integrity, printability, and customizability have positioned them as a preferred packaging choice worldwide.
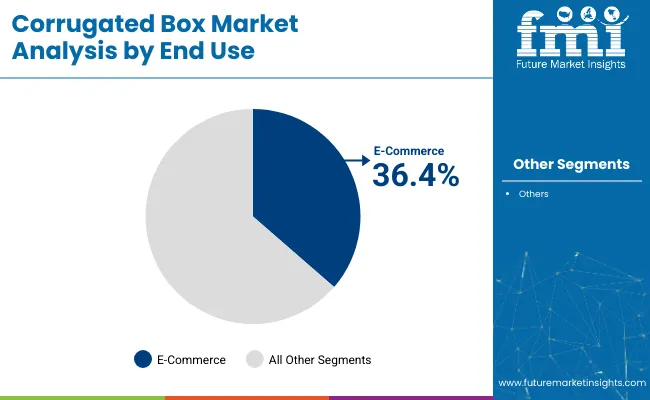
Rising global trade, a shift toward online shopping, and increased demand for sustainable packaging are key factors driving corrugated box adoption. Research shows that more than 75% of e-commerce shipments rely on corrugated boxes due to their lightweight nature and cushioning capabilities.
Manufacturers are enhancing box strength through multi-layered fluting, precision die-cutting, and reinforced edges while investing in water-resistant coatings and anti-theft designs. Sustainable innovations such as recycled kraft liners, soy-based inks, and mono-material packaging are gaining traction.
Corrugated boxes are widely used in automation-integrated packaging lines due to their compatibility with folding, gluing, and sealing machines. Smart packaging trends are also influencing box design, with brands adding QR codes, interactive elements, and augmented reality features for marketing and traceability.
E-Commerce and Food Sectors Drive Market Growth as Customization, Safety, and Sustainability Priorities Rise
E-commerce brands use corrugated boxes to ensure product protection during transit, reduce damage rates, and enhance the unboxing experience. These boxes also support personalized branding through printed exteriors and interiors.
In the food and beverage sector, corrugated boxes are used for secondary packaging of shelf-stable goods, beverages, and fresh produce. Coatings for moisture resistance and ventilated box formats support perishable logistics.
Retail and Manufacturing Industries Increase Corrugated Box Use as Standardization and Automation Evolve
Retailers benefit from shelf-ready corrugated boxes that double as in-store displays. Manufacturers use heavy-duty corrugated cartons to streamline palletization and warehouse storage.
Custom-fit inserts, edge protectors, and die-cut dividers are increasingly used to protect high-value industrial parts during transit. Corrugated boxes are also being adapted for automated storage and retrieval systems (ASRS) to increase picking accuracy. Foldable and reusable corrugated containers are gaining traction for reverse logistics applications.
In the manufacturing sector, color-coded corrugated bins are used for lean inventory practices and part traceability. Brands are incorporating printed assembly instructions on corrugated partitions to enhance operational efficiency. Additionally, QR-coded corrugated containers are being deployed for real-time inventory tracking and audit trail creation.
The corrugated box market is expanding globally, with key players focusing on lightweight designs, digital printing capabilities, and sustainability certifications. Automation in box manufacturing, just-in-time production, and on-demand box customization are transforming the industry. Major players are also collaborating with e-commerce and CPG brands to co-develop high-performance packaging. Advances in AI-based quality inspection are reducing waste and improving packaging precision.
Integration with smart logistics platforms is enhancing inventory tracking and delivery efficiency. Increased demand for biodegradable adhesives is reshaping glue formulations used in box assembly. Temperature-controlled corrugated packaging is emerging to support cold chain logistics. Additionally, minimalist packaging trends are driving design innovations for shelf-ready formats.
Market Share Analysis by Company
Company Name | Estimated Market Share (%) |
---|---|
International Paper Co. | 13-17% |
WestRock Company | 11-15% |
Smurfit Kappa Group | 9-13% |
Packaging Corporation of America | 6-10% |
Georgia-Pacific LLC | 5-8% |
Other Companies | 45-55% |
Company Name | Key Offerings/Activities |
---|---|
International Paper Co. | Produces heavy-duty corrugated cartons and specialty boxes with enhanced durability. |
WestRock Company | Offers e-commerce-ready corrugated packaging with custom printing and automation. |
Smurfit Kappa Group | Develops recyclable corrugated boxes with visual impact and structural integrity. |
Packaging Corporation of America | Manufactures high-volume shipping boxes for industrial and retail applications. |
Georgia-Pacific LLC | Specializes in sustainable corrugated packaging with moisture and grease resistance. |
Key Company Insights
Table 1: Global Market Value (US$ Million) Forecast by Region, 2018 to 2033
Table 2: Global Market Volume (Units) Forecast by Region, 2018 to 2033
Table 3: Global Market Value (US$ Million) Forecast by Board Type, 2018 to 2033
Table 4: Global Market Volume (Units) Forecast by Board Type, 2018 to 2033
Table 5: Global Market Value (US$ Million) Forecast by Grade Type, 2018 to 2033
Table 6: Global Market Volume (Units) Forecast by Grade Type, 2018 to 2033
Table 7: Global Market Value (US$ Million) Forecast by Product Type, 2018 to 2033
Table 8: Global Market Volume (Units) Forecast by Product Type, 2018 to 2033
Table 9: Global Market Value (US$ Million) Forecast by End Use, 2018 to 2033
Table 10: Global Market Volume (Units) Forecast by End Use, 2018 to 2033
Table 11: North America Market Value (US$ Million) Forecast by Country, 2018 to 2033
Table 12: North America Market Volume (Units) Forecast by Country, 2018 to 2033
Table 13: North America Market Value (US$ Million) Forecast by Board Type, 2018 to 2033
Table 14: North America Market Volume (Units) Forecast by Board Type, 2018 to 2033
Table 15: North America Market Value (US$ Million) Forecast by Grade Type, 2018 to 2033
Table 16: North America Market Volume (Units) Forecast by Grade Type, 2018 to 2033
Table 17: North America Market Value (US$ Million) Forecast by Product Type, 2018 to 2033
Table 18: North America Market Volume (Units) Forecast by Product Type, 2018 to 2033
Table 19: North America Market Value (US$ Million) Forecast by End Use, 2018 to 2033
Table 20: North America Market Volume (Units) Forecast by End Use, 2018 to 2033
Table 21: Latin America Market Value (US$ Million) Forecast by Country, 2018 to 2033
Table 22: Latin America Market Volume (Units) Forecast by Country, 2018 to 2033
Table 23: Latin America Market Value (US$ Million) Forecast by Board Type, 2018 to 2033
Table 24: Latin America Market Volume (Units) Forecast by Board Type, 2018 to 2033
Table 25: Latin America Market Value (US$ Million) Forecast by Grade Type, 2018 to 2033
Table 26: Latin America Market Volume (Units) Forecast by Grade Type, 2018 to 2033
Table 27: Latin America Market Value (US$ Million) Forecast by Product Type, 2018 to 2033
Table 28: Latin America Market Volume (Units) Forecast by Product Type, 2018 to 2033
Table 29: Latin America Market Value (US$ Million) Forecast by End Use, 2018 to 2033
Table 30: Latin America Market Volume (Units) Forecast by End Use, 2018 to 2033
Table 31: Europe Market Value (US$ Million) Forecast by Country, 2018 to 2033
Table 32: Europe Market Volume (Units) Forecast by Country, 2018 to 2033
Table 33: Europe Market Value (US$ Million) Forecast by Board Type, 2018 to 2033
Table 34: Europe Market Volume (Units) Forecast by Board Type, 2018 to 2033
Table 35: Europe Market Value (US$ Million) Forecast by Grade Type, 2018 to 2033
Table 36: Europe Market Volume (Units) Forecast by Grade Type, 2018 to 2033
Table 37: Europe Market Value (US$ Million) Forecast by Product Type, 2018 to 2033
Table 38: Europe Market Volume (Units) Forecast by Product Type, 2018 to 2033
Table 39: Europe Market Value (US$ Million) Forecast by End Use, 2018 to 2033
Table 40: Europe Market Volume (Units) Forecast by End Use, 2018 to 2033
Table 41: Asia Pacific Market Value (US$ Million) Forecast by Country, 2018 to 2033
Table 42: Asia Pacific Market Volume (Units) Forecast by Country, 2018 to 2033
Table 43: Asia Pacific Market Value (US$ Million) Forecast by Board Type, 2018 to 2033
Table 44: Asia Pacific Market Volume (Units) Forecast by Board Type, 2018 to 2033
Table 45: Asia Pacific Market Value (US$ Million) Forecast by Grade Type, 2018 to 2033
Table 46: Asia Pacific Market Volume (Units) Forecast by Grade Type, 2018 to 2033
Table 47: Asia Pacific Market Value (US$ Million) Forecast by Product Type, 2018 to 2033
Table 48: Asia Pacific Market Volume (Units) Forecast by Product Type, 2018 to 2033
Table 49: Asia Pacific Market Value (US$ Million) Forecast by End Use, 2018 to 2033
Table 50: Asia Pacific Market Volume (Units) Forecast by End Use, 2018 to 2033
Table 51: MEA Market Value (US$ Million) Forecast by Country, 2018 to 2033
Table 52: MEA Market Volume (Units) Forecast by Country, 2018 to 2033
Table 53: MEA Market Value (US$ Million) Forecast by Board Type, 2018 to 2033
Table 54: MEA Market Volume (Units) Forecast by Board Type, 2018 to 2033
Table 55: MEA Market Value (US$ Million) Forecast by Grade Type, 2018 to 2033
Table 56: MEA Market Volume (Units) Forecast by Grade Type, 2018 to 2033
Table 57: MEA Market Value (US$ Million) Forecast by Product Type, 2018 to 2033
Table 58: MEA Market Volume (Units) Forecast by Product Type, 2018 to 2033
Table 59: MEA Market Value (US$ Million) Forecast by End Use, 2018 to 2033
Table 60: MEA Market Volume (Units) Forecast by End Use, 2018 to 2033
Figure 1: Global Market Value (US$ Million) by Board Type, 2023 to 2033
Figure 2: Global Market Value (US$ Million) by Grade Type, 2023 to 2033
Figure 3: Global Market Value (US$ Million) by Product Type, 2023 to 2033
Figure 4: Global Market Value (US$ Million) by End Use, 2023 to 2033
Figure 5: Global Market Value (US$ Million) by Region, 2023 to 2033
Figure 6: Global Market Value (US$ Million) Analysis by Region, 2018 to 2033
Figure 7: Global Market Volume (Units) Analysis by Region, 2018 to 2033
Figure 8: Global Market Value Share (%) and BPS Analysis by Region, 2023 to 2033
Figure 9: Global Market Y-o-Y Growth (%) Projections by Region, 2023 to 2033
Figure 10: Global Market Value (US$ Million) Analysis by Board Type, 2018 to 2033
Figure 11: Global Market Volume (Units) Analysis by Board Type, 2018 to 2033
Figure 12: Global Market Value Share (%) and BPS Analysis by Board Type, 2023 to 2033
Figure 13: Global Market Y-o-Y Growth (%) Projections by Board Type, 2023 to 2033
Figure 14: Global Market Value (US$ Million) Analysis by Grade Type, 2018 to 2033
Figure 15: Global Market Volume (Units) Analysis by Grade Type, 2018 to 2033
Figure 16: Global Market Value Share (%) and BPS Analysis by Grade Type, 2023 to 2033
Figure 17: Global Market Y-o-Y Growth (%) Projections by Grade Type, 2023 to 2033
Figure 18: Global Market Value (US$ Million) Analysis by Product Type, 2018 to 2033
Figure 19: Global Market Volume (Units) Analysis by Product Type, 2018 to 2033
Figure 20: Global Market Value Share (%) and BPS Analysis by Product Type, 2023 to 2033
Figure 21: Global Market Y-o-Y Growth (%) Projections by Product Type, 2023 to 2033
Figure 22: Global Market Value (US$ Million) Analysis by End Use, 2018 to 2033
Figure 23: Global Market Volume (Units) Analysis by End Use, 2018 to 2033
Figure 24: Global Market Value Share (%) and BPS Analysis by End Use, 2023 to 2033
Figure 25: Global Market Y-o-Y Growth (%) Projections by End Use, 2023 to 2033
Figure 26: Global Market Attractiveness by Board Type, 2023 to 2033
Figure 27: Global Market Attractiveness by Grade Type, 2023 to 2033
Figure 28: Global Market Attractiveness by Product Type, 2023 to 2033
Figure 29: Global Market Attractiveness by End Use, 2023 to 2033
Figure 30: Global Market Attractiveness by Region, 2023 to 2033
Figure 31: North America Market Value (US$ Million) by Board Type, 2023 to 2033
Figure 32: North America Market Value (US$ Million) by Grade Type, 2023 to 2033
Figure 33: North America Market Value (US$ Million) by Product Type, 2023 to 2033
Figure 34: North America Market Value (US$ Million) by End Use, 2023 to 2033
Figure 35: North America Market Value (US$ Million) by Country, 2023 to 2033
Figure 36: North America Market Value (US$ Million) Analysis by Country, 2018 to 2033
Figure 37: North America Market Volume (Units) Analysis by Country, 2018 to 2033
Figure 38: North America Market Value Share (%) and BPS Analysis by Country, 2023 to 2033
Figure 39: North America Market Y-o-Y Growth (%) Projections by Country, 2023 to 2033
Figure 40: North America Market Value (US$ Million) Analysis by Board Type, 2018 to 2033
Figure 41: North America Market Volume (Units) Analysis by Board Type, 2018 to 2033
Figure 42: North America Market Value Share (%) and BPS Analysis by Board Type, 2023 to 2033
Figure 43: North America Market Y-o-Y Growth (%) Projections by Board Type, 2023 to 2033
Figure 44: North America Market Value (US$ Million) Analysis by Grade Type, 2018 to 2033
Figure 45: North America Market Volume (Units) Analysis by Grade Type, 2018 to 2033
Figure 46: North America Market Value Share (%) and BPS Analysis by Grade Type, 2023 to 2033
Figure 47: North America Market Y-o-Y Growth (%) Projections by Grade Type, 2023 to 2033
Figure 48: North America Market Value (US$ Million) Analysis by Product Type, 2018 to 2033
Figure 49: North America Market Volume (Units) Analysis by Product Type, 2018 to 2033
Figure 50: North America Market Value Share (%) and BPS Analysis by Product Type, 2023 to 2033
Figure 51: North America Market Y-o-Y Growth (%) Projections by Product Type, 2023 to 2033
Figure 52: North America Market Value (US$ Million) Analysis by End Use, 2018 to 2033
Figure 53: North America Market Volume (Units) Analysis by End Use, 2018 to 2033
Figure 54: North America Market Value Share (%) and BPS Analysis by End Use, 2023 to 2033
Figure 55: North America Market Y-o-Y Growth (%) Projections by End Use, 2023 to 2033
Figure 56: North America Market Attractiveness by Board Type, 2023 to 2033
Figure 57: North America Market Attractiveness by Grade Type, 2023 to 2033
Figure 58: North America Market Attractiveness by Product Type, 2023 to 2033
Figure 59: North America Market Attractiveness by End Use, 2023 to 2033
Figure 60: North America Market Attractiveness by Country, 2023 to 2033
Figure 61: Latin America Market Value (US$ Million) by Board Type, 2023 to 2033
Figure 62: Latin America Market Value (US$ Million) by Grade Type, 2023 to 2033
Figure 63: Latin America Market Value (US$ Million) by Product Type, 2023 to 2033
Figure 64: Latin America Market Value (US$ Million) by End Use, 2023 to 2033
Figure 65: Latin America Market Value (US$ Million) by Country, 2023 to 2033
Figure 66: Latin America Market Value (US$ Million) Analysis by Country, 2018 to 2033
Figure 67: Latin America Market Volume (Units) Analysis by Country, 2018 to 2033
Figure 68: Latin America Market Value Share (%) and BPS Analysis by Country, 2023 to 2033
Figure 69: Latin America Market Y-o-Y Growth (%) Projections by Country, 2023 to 2033
Figure 70: Latin America Market Value (US$ Million) Analysis by Board Type, 2018 to 2033
Figure 71: Latin America Market Volume (Units) Analysis by Board Type, 2018 to 2033
Figure 72: Latin America Market Value Share (%) and BPS Analysis by Board Type, 2023 to 2033
Figure 73: Latin America Market Y-o-Y Growth (%) Projections by Board Type, 2023 to 2033
Figure 74: Latin America Market Value (US$ Million) Analysis by Grade Type, 2018 to 2033
Figure 75: Latin America Market Volume (Units) Analysis by Grade Type, 2018 to 2033
Figure 76: Latin America Market Value Share (%) and BPS Analysis by Grade Type, 2023 to 2033
Figure 77: Latin America Market Y-o-Y Growth (%) Projections by Grade Type, 2023 to 2033
Figure 78: Latin America Market Value (US$ Million) Analysis by Product Type, 2018 to 2033
Figure 79: Latin America Market Volume (Units) Analysis by Product Type, 2018 to 2033
Figure 80: Latin America Market Value Share (%) and BPS Analysis by Product Type, 2023 to 2033
Figure 81: Latin America Market Y-o-Y Growth (%) Projections by Product Type, 2023 to 2033
Figure 82: Latin America Market Value (US$ Million) Analysis by End Use, 2018 to 2033
Figure 83: Latin America Market Volume (Units) Analysis by End Use, 2018 to 2033
Figure 84: Latin America Market Value Share (%) and BPS Analysis by End Use, 2023 to 2033
Figure 85: Latin America Market Y-o-Y Growth (%) Projections by End Use, 2023 to 2033
Figure 86: Latin America Market Attractiveness by Board Type, 2023 to 2033
Figure 87: Latin America Market Attractiveness by Grade Type, 2023 to 2033
Figure 88: Latin America Market Attractiveness by Product Type, 2023 to 2033
Figure 89: Latin America Market Attractiveness by End Use, 2023 to 2033
Figure 90: Latin America Market Attractiveness by Country, 2023 to 2033
Figure 91: Europe Market Value (US$ Million) by Board Type, 2023 to 2033
Figure 92: Europe Market Value (US$ Million) by Grade Type, 2023 to 2033
Figure 93: Europe Market Value (US$ Million) by Product Type, 2023 to 2033
Figure 94: Europe Market Value (US$ Million) by End Use, 2023 to 2033
Figure 95: Europe Market Value (US$ Million) by Country, 2023 to 2033
Figure 96: Europe Market Value (US$ Million) Analysis by Country, 2018 to 2033
Figure 97: Europe Market Volume (Units) Analysis by Country, 2018 to 2033
Figure 98: Europe Market Value Share (%) and BPS Analysis by Country, 2023 to 2033
Figure 99: Europe Market Y-o-Y Growth (%) Projections by Country, 2023 to 2033
Figure 100: Europe Market Value (US$ Million) Analysis by Board Type, 2018 to 2033
Figure 101: Europe Market Volume (Units) Analysis by Board Type, 2018 to 2033
Figure 102: Europe Market Value Share (%) and BPS Analysis by Board Type, 2023 to 2033
Figure 103: Europe Market Y-o-Y Growth (%) Projections by Board Type, 2023 to 2033
Figure 104: Europe Market Value (US$ Million) Analysis by Grade Type, 2018 to 2033
Figure 105: Europe Market Volume (Units) Analysis by Grade Type, 2018 to 2033
Figure 106: Europe Market Value Share (%) and BPS Analysis by Grade Type, 2023 to 2033
Figure 107: Europe Market Y-o-Y Growth (%) Projections by Grade Type, 2023 to 2033
Figure 108: Europe Market Value (US$ Million) Analysis by Product Type, 2018 to 2033
Figure 109: Europe Market Volume (Units) Analysis by Product Type, 2018 to 2033
Figure 110: Europe Market Value Share (%) and BPS Analysis by Product Type, 2023 to 2033
Figure 111: Europe Market Y-o-Y Growth (%) Projections by Product Type, 2023 to 2033
Figure 112: Europe Market Value (US$ Million) Analysis by End Use, 2018 to 2033
Figure 113: Europe Market Volume (Units) Analysis by End Use, 2018 to 2033
Figure 114: Europe Market Value Share (%) and BPS Analysis by End Use, 2023 to 2033
Figure 115: Europe Market Y-o-Y Growth (%) Projections by End Use, 2023 to 2033
Figure 116: Europe Market Attractiveness by Board Type, 2023 to 2033
Figure 117: Europe Market Attractiveness by Grade Type, 2023 to 2033
Figure 118: Europe Market Attractiveness by Product Type, 2023 to 2033
Figure 119: Europe Market Attractiveness by End Use, 2023 to 2033
Figure 120: Europe Market Attractiveness by Country, 2023 to 2033
Figure 121: Asia Pacific Market Value (US$ Million) by Board Type, 2023 to 2033
Figure 122: Asia Pacific Market Value (US$ Million) by Grade Type, 2023 to 2033
Figure 123: Asia Pacific Market Value (US$ Million) by Product Type, 2023 to 2033
Figure 124: Asia Pacific Market Value (US$ Million) by End Use, 2023 to 2033
Figure 125: Asia Pacific Market Value (US$ Million) by Country, 2023 to 2033
Figure 126: Asia Pacific Market Value (US$ Million) Analysis by Country, 2018 to 2033
Figure 127: Asia Pacific Market Volume (Units) Analysis by Country, 2018 to 2033
Figure 128: Asia Pacific Market Value Share (%) and BPS Analysis by Country, 2023 to 2033
Figure 129: Asia Pacific Market Y-o-Y Growth (%) Projections by Country, 2023 to 2033
Figure 130: Asia Pacific Market Value (US$ Million) Analysis by Board Type, 2018 to 2033
Figure 131: Asia Pacific Market Volume (Units) Analysis by Board Type, 2018 to 2033
Figure 132: Asia Pacific Market Value Share (%) and BPS Analysis by Board Type, 2023 to 2033
Figure 133: Asia Pacific Market Y-o-Y Growth (%) Projections by Board Type, 2023 to 2033
Figure 134: Asia Pacific Market Value (US$ Million) Analysis by Grade Type, 2018 to 2033
Figure 135: Asia Pacific Market Volume (Units) Analysis by Grade Type, 2018 to 2033
Figure 136: Asia Pacific Market Value Share (%) and BPS Analysis by Grade Type, 2023 to 2033
Figure 137: Asia Pacific Market Y-o-Y Growth (%) Projections by Grade Type, 2023 to 2033
Figure 138: Asia Pacific Market Value (US$ Million) Analysis by Product Type, 2018 to 2033
Figure 139: Asia Pacific Market Volume (Units) Analysis by Product Type, 2018 to 2033
Figure 140: Asia Pacific Market Value Share (%) and BPS Analysis by Product Type, 2023 to 2033
Figure 141: Asia Pacific Market Y-o-Y Growth (%) Projections by Product Type, 2023 to 2033
Figure 142: Asia Pacific Market Value (US$ Million) Analysis by End Use, 2018 to 2033
Figure 143: Asia Pacific Market Volume (Units) Analysis by End Use, 2018 to 2033
Figure 144: Asia Pacific Market Value Share (%) and BPS Analysis by End Use, 2023 to 2033
Figure 145: Asia Pacific Market Y-o-Y Growth (%) Projections by End Use, 2023 to 2033
Figure 146: Asia Pacific Market Attractiveness by Board Type, 2023 to 2033
Figure 147: Asia Pacific Market Attractiveness by Grade Type, 2023 to 2033
Figure 148: Asia Pacific Market Attractiveness by Product Type, 2023 to 2033
Figure 149: Asia Pacific Market Attractiveness by End Use, 2023 to 2033
Figure 150: Asia Pacific Market Attractiveness by Country, 2023 to 2033
Figure 151: MEA Market Value (US$ Million) by Board Type, 2023 to 2033
Figure 152: MEA Market Value (US$ Million) by Grade Type, 2023 to 2033
Figure 153: MEA Market Value (US$ Million) by Product Type, 2023 to 2033
Figure 154: MEA Market Value (US$ Million) by End Use, 2023 to 2033
Figure 155: MEA Market Value (US$ Million) by Country, 2023 to 2033
Figure 156: MEA Market Value (US$ Million) Analysis by Country, 2018 to 2033
Figure 157: MEA Market Volume (Units) Analysis by Country, 2018 to 2033
Figure 158: MEA Market Value Share (%) and BPS Analysis by Country, 2023 to 2033
Figure 159: MEA Market Y-o-Y Growth (%) Projections by Country, 2023 to 2033
Figure 160: MEA Market Value (US$ Million) Analysis by Board Type, 2018 to 2033
Figure 161: MEA Market Volume (Units) Analysis by Board Type, 2018 to 2033
Figure 162: MEA Market Value Share (%) and BPS Analysis by Board Type, 2023 to 2033
Figure 163: MEA Market Y-o-Y Growth (%) Projections by Board Type, 2023 to 2033
Figure 164: MEA Market Value (US$ Million) Analysis by Grade Type, 2018 to 2033
Figure 165: MEA Market Volume (Units) Analysis by Grade Type, 2018 to 2033
Figure 166: MEA Market Value Share (%) and BPS Analysis by Grade Type, 2023 to 2033
Figure 167: MEA Market Y-o-Y Growth (%) Projections by Grade Type, 2023 to 2033
Figure 168: MEA Market Value (US$ Million) Analysis by Product Type, 2018 to 2033
Figure 169: MEA Market Volume (Units) Analysis by Product Type, 2018 to 2033
Figure 170: MEA Market Value Share (%) and BPS Analysis by Product Type, 2023 to 2033
Figure 171: MEA Market Y-o-Y Growth (%) Projections by Product Type, 2023 to 2033
Figure 172: MEA Market Value (US$ Million) Analysis by End Use, 2018 to 2033
Figure 173: MEA Market Volume (Units) Analysis by End Use, 2018 to 2033
Figure 174: MEA Market Value Share (%) and BPS Analysis by End Use, 2023 to 2033
Figure 175: MEA Market Y-o-Y Growth (%) Projections by End Use, 2023 to 2033
Figure 176: MEA Market Attractiveness by Board Type, 2023 to 2033
Figure 177: MEA Market Attractiveness by Grade Type, 2023 to 2033
Figure 178: MEA Market Attractiveness by Product Type, 2023 to 2033
Figure 179: MEA Market Attractiveness by End Use, 2023 to 2033
Figure 180: MEA Market Attractiveness by Country, 2023 to 2033
The overall market size for the Corrugated Box Market was USD 152.7 Billion in 2025.
The Corrugated Box Market is expected to reach USD 232.8 Billion in 2035.
The Corrugated Box Market will be driven by the growth in e-commerce, food distribution, sustainable packaging requirements, and the expansion of automation in warehousing and logistics.
The top 5 countries driving the development of the Corrugated Box Market are the USA, China, Germany, India, and Brazil.
Explore Similar Insights
Thank you!
You will receive an email from our Business Development Manager. Please be sure to check your SPAM/JUNK folder too.