
- Market Size (2026)
- USD 11,999.2 Mn
- Forecast (2036)
- USD 21,490.4 Mn
- CAGR (2026 to 2036)
- 6.0%
How big is Cutlery Market in 2026?
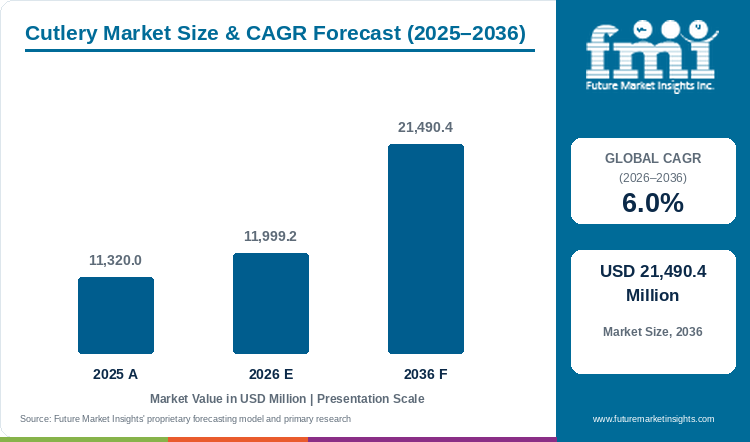
A CAGR of 6% from 2026 to 2036 moves cutlery sales from USD 11,320 million (2025) through USD 11,999.2 million (2026 estimate) to USD 21,490.4 million (2036 projection).
Global cutlery demand stood at USD 11,320 million in 2025 and is estimated at USD 11,999.2 million in 2026. FMI data show that market size is projected to reach USD 21,490.4 million by 2036. Sales will grow at a CAGR of 6% from 2026 to 2036. Landed cost sets the shelf price of most knives, forks and spoons, since the USA and other large consuming markets import finished pieces from a few exporting countries.
A US tariff rule put the landed cost of imported cutlery under strain. The Bureau of Industry and Security added 407 HTSUS codes to the Section 232 steel and aluminum tariffs in a notice published on 19 August 2025, with headings 8211 and 8215 for knives, spoons and forks among them. Duty applies to the value of the steel content for goods entered on or after 18 August 2025. Stainless flatware is almost wholly steel, so the duty base will cover most of the import value.
Multi-origin sourcing has become the next frontier of market opportunity after the August 2025 Section 232 inclusion. Importers that split orders across two or three origins will hold shelf prices steadier than single-origin rivals. US retailers will face flatware price rises as the August 2025 and April 2026 tariff changes reach import invoices. Exporters like Tramontina will in turn price US-bound lots apart from lots for Europe and Asia.
Key Market Trends & Insights
- Product type: stainless steel led on an estimated 58.4% in 2026, and plastic, silver and gold made up the remainder.
- Application: household buyers made up about 54.6% of 2026 sales (estimated), with public consumption and high-end restaurants behind.
- Distribution channel: offline stores accounted for an estimated 67.3% of 2026 sales. Tramontina named cutlery items among the main exports to the United States, which takes one-third of company exports, in August 2025.
Regional Highlights
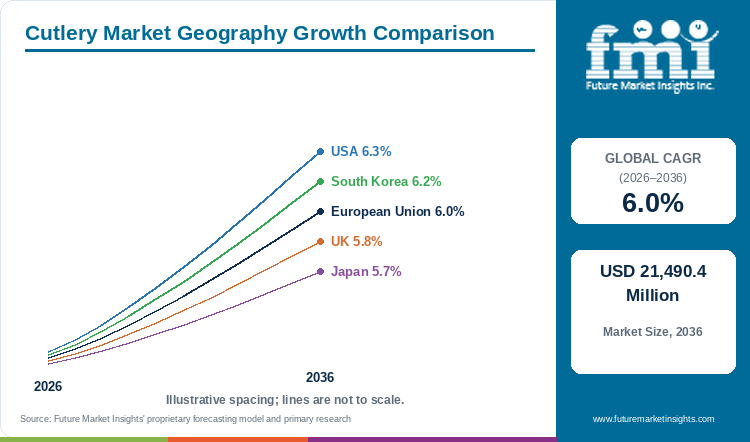
- Strongest profiled growth: the USA, with a 6.3% CAGR over the decade to 2036.
- South Korea comes in on 6.2% and the European Union on 6%, with the UK on 5.8% and Japan lowest on 5.7%.
- Products of Korea with a column 1 duty below 15% carry a combined 15% US rate for entries from 14 November 2025, a December 2025 Federal Register notice stated.
Market Size & Forecast
Table 1: Market Size and Forecast for the Cutlery Market (USD million and percentage), 2025 to 2036
| Metric | Value |
|---|---|
| 2025 Market Size | USD 11,320 million |
| Estimated Market Size in 2026 | USD 11,999.2 million |
| Projected Market Size by 2036 | USD 21,490.4 million |
| CAGR, 2026 to 2036 | 6% |
| Added Revenue, 2026 to 2036 | USD 9,491.2 million |
| Market Expansion Multiple | 1.8x |
Cutlery outpaces adjacent dining categories. Fork and spoon sets also feed the related flatware market. Plates, bowls and serveware advance at a 4.3% CAGR from 2026 to 2036 within the tableware market. Knives, premium sets and eco materials give cutlery the higher rate of 6% on FMI numbers. Stainless steel input cost matters too, and the stainless steel market expands at a 5.4% CAGR to 2036.
Import Reliance, Tariff Layers and Shifting Cutlery Supply Routes
US tariff exposure for imported cutlery now stacks a metal duty, a wider customs base and country rates. A Department of Commerce release dated 19 August 2025 set a duty rate of 50% on the metal content of the 407 newly covered product categories. Germany Trade and Invest reported that Proclamation 11021 of 2 April 2026 set US metal tariffs on the full customs value of a product, with the overhaul in force from 6 April 2026. UK-origin goods in Annex I-A face 25% in place of 50% once the metal is shown as melted and poured in the UK. Products of Japan with a low base duty carry a combined 15% rate for entries from 7 August 2025. Origin and metal source will set the landed cost of a fork alongside the factory price.
Cutlery exporters like Tramontina and Fiskars are redrawing supply routes in response to US tariffs. Tramontina, with a US distribution centre since the 1980s, is seeking new commercial partners in Latin America, Africa and the Middle East, Jornal do Comércio reported on 24 August 2025. Fiskars Group said in July 2025 that the U.S. represents about 30% of group net sales, with the majority of that business sourced from Asia. Fiskars plans to rebase some sourcing once conditions stabilize. Trade defence against Chinese cutlery also runs in Argentina. Argentina opened a sunset review of anti-dumping measures on Chinese stainless steel table knives, forks and spoons under Resolution 812/2026, Marval reported on 3 June 2026.
Table 2: Trade and Tariff Exposure Indicators for the Cutlery Market (duty rates, shares and codes), mixed reporting years from 2025 to 2026
| Indicator | Data Point | Relevance | Source |
|---|---|---|---|
| US Section 232 inclusions, August 2025 | 407 HTSUS codes added, including 8211 and 8215 | Knives, spoons and forks enter the steel derivative list. | |
| Duty on metal content, August 2025 | 50% | Sets the tariff layer for stainless cutlery imports. | |
| US metal tariff base, April 2026 | Full customs value under Proclamation 11021, in force from 6 April 2026 | Widens the dutiable base for metal goods. | |
| UK-origin rate under Annex I-A, June 2026 | 25% for metal melted and poured in the UK | UK makers gain a lower rate on qualifying goods. | |
| Japan combined US rate, August 2025 | 15% for goods with a low base duty | Sets the floor for Japanese tableware exports. | |
| Korea combined US rate, November 2025 | 15% for goods with a column 1 duty below 15% | Puts Korean exports on a par with Japan. | |
| Fiskars Group US exposure, July 2025 | About 30% of group net sales, mostly sourced from Asia | Import reliance of a profiled brand in the largest market. | |
| Tramontina US exposure, August 2025 | One-third of total exports | Brazilian cutlery exports lean on US buyers. | |
| Argentina anti-dumping review, June 2026 | Sunset review on Chinese stainless steel table knives, forks and spoons | Trade defence remains active outside the US. |
Analyst Perspective
“Brands that can prove melt-and-pour origin or finish sets close to the buyer will take share in the United States as metal tariffs widen to full customs value. I see the strongest opening for makers who pair stainless steel quality with a dual-origin supply chain across Latin America and Asia.”
- Rahul Pandita, Principal Consultant, Future Market Insights.
How is the cutlery market segmented?
Product type, application and distribution channel, together with region, form the cutlery segmentation. For 2026, the leaders are stainless steel at an estimated 58.4% of product type sales, household use at about 54.6% of the application split and offline retail at roughly 67.3% of the channel split.
By product type: plastic, stainless steel, silver, and gold.
By application: household, public consumption restaurant, and high-end restaurant.
By distribution channel: online and offline.
By region: Latin America with North America, then South Asia Pacific beside East Asia, then Eastern and Western Europe, and finally Middle East and Africa.
Why does stainless steel lead product type sales?
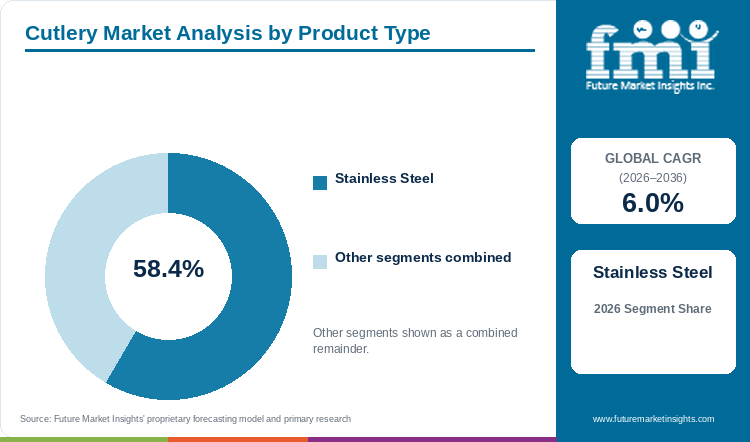
Stainless steel carries an estimated 58.4% of 2026 product type sales, well clear of plastic, silver and gold.
Table 3: Product Type Share for the Cutlery Market (percentage share), 2026
| Product Type | Estimated Share (2026) |
|---|---|
| Stainless Steel | 58.4% |
| Plastic | 27.3% |
| Silver | 10.2% |
| Gold | 4.1% |
| Total | 100.0% |
Table 4: Product Type Leadership and Market Growth for the Cutlery Market (segment and CAGR percentage), 2026 to 2036
| Metric | Value |
|---|---|
| Global CAGR (2026 to 2036) | 6% |
| Leading Segment | Stainless Steel |
Durability and a wide design range give stainless steel the broadest buyer base. Stainless steel leads product type sales, FMI finds. Stainless takes an estimated 58.4% of product type sales, against about 27.3% for plastic, 10.2% for silver and 4.1% for gold. Plastic holds second place through takeaway and delivery use, and single-use plastic bans press on the 27.3% plastic share. Silver and gold serve gifting and formal dining. The steel lead also carries the heaviest tariff exposure, since 8215 spoons and forks entered the US derivative list in August 2025.
- Plastic cutlery faces single-use bans in several regions, which steers buyers to wood, bamboo and reusable steel.
- The US duty rate on metal content of newly covered derivative goods was set at 50%.
Why do households lead application sales?
Households generate an estimated 54.6% of the 2026 application split, ahead of public consumption restaurants and high-end restaurants.
Table 5: Application Share for the Cutlery Market (percentage share), 2026
| Application | Estimated Share (2026) |
|---|---|
| Household | 54.6% |
| Public Consumption Restaurant | 31.2% |
| High-end Restaurant | 14.2% |
| Total | 100.0% |
Home dining and gifting keep the household segment ahead of commercial kitchens. FMI places household use ahead of both restaurant segments. Households account for about 54.6% of application sales by estimate, public consumption restaurants 31.2% and high-end restaurants 14.2%. Families will replace sets on gifting and moving occasions, and restaurants will keep buying in bulk at negotiated prices. Fiskars Group reported a rapid decline in U.S. retailer demand in 2025 from indirect tariff effects. US retail orders for household sets will swing the most with each new tariff notice.
- Restaurants buy on durability and unit price, and hotels add brand and design to the list.
- Comparable gross margin at the Fiskars business area fell 150 bps to 39.1% in Q2 2025 on tariff impacts.
Why do offline stores lead distribution channel sales?
Offline stores move an estimated 67.3% of 2026 channel sales, and online channels about 32.7%.
Table 6: Distribution Channel Share for the Cutlery Market (percentage share), 2026
| Distribution Channel | Estimated Share (2026) |
|---|---|
| Offline | 67.3% |
| Online | 32.7% |
| Total | 100.0% |
Shoppers want to feel weight and balance before paying for a premium set. Over 65% of consumers prefer buying premium cutlery offline, as per FMI. Offline stores carry an estimated 67.3% of channel sales, and online channels 32.7%. Department stores and kitchen specialists will be the first point of tariff pass-through, since shelf prices follow landed cost. Online sales will gain on replacement pieces and value sets.
- Higher operating costs for physical stores limit offline margins.
- Tramontina has run a US distribution centre since the 1980s and plans no change to that structure.
What are the drivers, restraints, and opportunities in the cutlery market?
Sales of cutlery rise with demand for premium and designer sets, eco materials and foodservice growth. Key challenges faced by manufacturers include volatile stainless steel prices, low-cost imports and tariff costs, and regional sourcing close to large buyers offers the clearest opening.
- Driver: Premium and designer sets, hospitality demand and home dining support sales.
- Restraint: Raw material swings, low-cost competition and new metal tariffs raise costs.
- Opportunity: Dual-origin supply and local finishing near major importing markets.
Premium Sets and Foodservice Keep Orders Coming
Key trends in cutlery include premium and designer sets, ergonomic designs and custom engraving. Japan offers a clear example of tariff terms that support premium exports, with a combined 15% US rate on products with a low base duty from 7 August 2025. Korean goods with a column 1 duty below 15% received the same combined rate from 14 November 2025. Exporters of high-precision sets from Japan and South Korea face a predictable rate. Foodservice buyers will keep ordering durable steel for public and high-end restaurants.
Metal Tariffs and Steel Prices Squeeze Importers
Volatile raw material prices for stainless steel, aluminium and bioplastics are a restraint FMI cites. Proclamation 11021 of 2 April 2026 moved US metal tariffs from a metal-content base to the full customs value of a product, effective 6 April 2026. Goods with a metal share below 15% by weight outside chapters 72, 73, 74 and 76 carry no additional duty. Stainless cutlery clears that threshold by a wide margin. US importers will absorb part of the full-value duty and pass the remainder to retailers. The disposable cutlery market follows a slower 3.5% CAGR from 2026 to 2036, and plastic ranges carry a lighter metal burden.
Regional Supply Routes Open Room for Mid-Sized Makers
Tramontina is targeting new partners in Latin America, Africa and the Middle East. Sales potential is expected to emerge from makers that can supply large markets from a nearby or low-tariff origin. Argentina reopened the question of duties on Chinese stainless table cutlery in June 2026. Eco-friendly ranges add a second route, and the biodegradable cutlery market posted a 5.6% CAGR over 2021 to 2031. Mid-sized makers with flexible plants will gain from the shifting balance between supply and demand and take the orders that importers like Fiskars reroute from Asia.
Which country CAGRs are profiled in the cutlery market?
Table 7: Country CAGR Comparison for the Cutlery Market (CAGR percentage), 2026 to 2036
| Country | CAGR |
|---|---|
| USA | 6.3% |
| South Korea | 6.2% |
| European Union | 6% |
| UK | 5.8% |
| Japan | 5.7% |
How do country-level CAGRs compare in the cutlery market?
The five profiled markets fall within a narrow band. In FMI country figures, the USA leads at 6.3% from 2026 to 2036 and South Korea follows at 6.2%. The European Union matches the 6% global CAGR. The UK grows at 5.8% and Japan at 5.7%. Premium kitchenware demand keeps the USA first despite the heaviest tariff layer, and mature households slow Japan to 5.7%.
- The USA pairs premium kitchenware demand with the heaviest import tariff layer.
- South Korea links modern kitchen design to a 15% combined US rate for exporters.
- The European Union is led by Germany, France and Italy under strict environmental rules.
- The UK adds a lower US rate for metal melted and poured at home.
- Japan joins high-precision craft with a 15% US rate on low-duty goods.
Full report country CAGRs cover: the Asia-Pacific pair of South Asia Pacific and East Asia, then North and Latin America, then Middle East and Africa, then Western and Eastern Europe.
Country-wise Analysis
USA Cutlery Market Outlook (2026 to 2036)
Import tariffs define the US outlook. Spoons, forks and knives under headings 8215 and 8211 joined the Section 232 derivative list from 18 August 2025. Fiskars Group sources the majority of US business from Asia. Buyers still trade up to premium kitchenware and sustainable dining sets, and the USA heads the five with a 6.3% CAGR to 2036.
Key takeaway: US growth will reward suppliers that cut dutiable content or source from lower-rate origins, since tariff cost now shapes shelf price.
South Korea Cutlery Market Outlook (2026 to 2036)
South Korea grows at 6.2% from 2026 to 2036 on modern kitchen aesthetics. The country ranks second in the profiled table. A December 2025 Federal Register notice set a combined 15% US rate on Korean goods with a column 1 duty below 15%. Korean makers of steel sets gain a known export rate, and home buyers will keep favouring sleek steel designs.
Key takeaway: South Korea pairs strong home demand for steel sets with a stable 15% US export rate.
European Union Cutlery Market Outlook (2026 to 2036)
Germany, France and Italy lead the European Union. Union sales post a 6% CAGR to 2036, matching the global pace. Strong EU environmental regulation pushes the material mix away from single-use plastic. EU-origin goods under Annex I-C carry a 15% US rate, Germany Trade and Invest noted in June 2026. EU makers will balance home sales with exports to the United States.
Key takeaway: EU makers will rely on premium home sales and a capped US rate on qualifying goods.
UK Cutlery Market Outlook (2026 to 2036)
A lower US rate of 25% in place of 50% applies to UK goods in Annex I-A made from metal melted and poured in the UK. UK cutlery makers that buy imported steel will see little benefit. Domestic buyers seek durable, stylish and sustainable sets. A 5.8% CAGR through 2036 is in prospect for the UK.
Key takeaway: Design-led UK brands will grow through home sales, and US exports will hinge on proving metal origin.
Japan Cutlery Market Outlook (2026 to 2036)
High-precision and finely finished pieces drive the Japanese market. A US executive order of 4 September 2025 set a combined 15% rate for Japanese products with a low base duty, applied to entries from 7 August 2025. Japan grows at 5.7% from 2026 to 2036, last among the profiled markets.
Key takeaway: Japan will gain most from craft exports at a fixed US rate and less from a mature home market.
Who are the notable companies in the cutlery market?
Oneida Group, Fiskars Group, Zwilling J.A. Henckels, Tramontina, Robert Welch Designs Ltd., Victorinox AG, Mikasa, Amefa B.V., Sambonet Paderno Industrie S.p.A. and Eco-Products, Inc. are the key companies in cutlery.
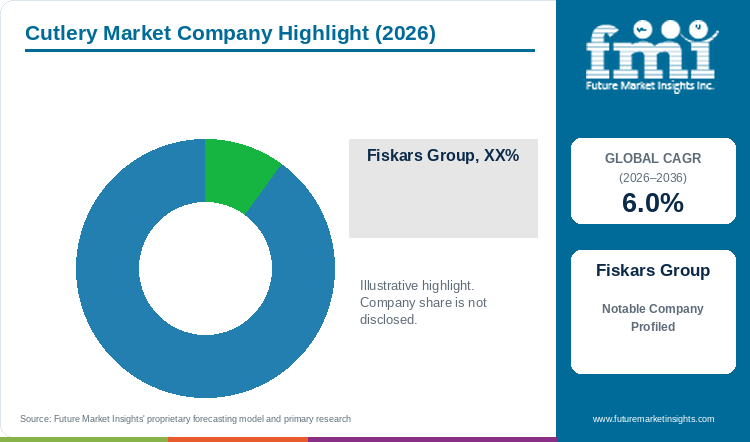
FMI estimates Oneida Group at 18% to 22%, Fiskars Group at 15% to 19% and Zwilling J.A. Henckels at 12% to 16%. Tramontina holds 9% to 13% and Robert Welch Designs 7% to 11%. Other companies and regional players hold 30% to 40% combined.
Tariff exposure differs sharply among the five largest cutlery brands. Fiskars counts the U.S. as about 30% of group net sales. Tramontina sends one-third of exports to the United States. Victorinox serves professional kitchens, Amefa supplies low-cost cutlery to hospitality and Sambonet Paderno makes high-end Italian ranges. In eco ranges, market leaders face new challengers such as Eco-Products, which focuses on compostable cutlery.
- Share leaders: Oneida Group and Fiskars Group (Gerber, Royal Doulton, Waterford).
- Precision knife and cutlery makers: Zwilling J.A. Henckels and Victorinox AG.
- Value and hospitality suppliers: Tramontina, Amefa B.V. and Mikasa.
- Design, premium and eco brands: Robert Welch Designs Ltd., Sambonet Paderno Industrie S.p.A. and Eco-Products, Inc.
Competitive Benchmarking: Cutlery Market
Table 8: Competitive Benchmarking for the Cutlery Market (qualitative documentation ratings), 2026
| Company | US Exposure | Sourcing Detail | Tariff Response | Disclosure |
|---|---|---|---|---|
| Fiskars Group | High | Medium | High | High |
| Tramontina | High | Medium | Medium | Medium |
| Oneida Group | Low | Low | Low | Low |
| Zwilling J.A. Henckels | Low | Low | Low | Low |
| Robert Welch Designs Ltd. | Low | Low | Low | Low |
Ratings measure the depth of dated filings, releases and trade reports for each company, from High to Low.
Key Developments in the Cutlery Market
- In June 2026, Argentina opened a sunset review of anti-dumping measures on Chinese stainless steel table cutlery.
- In April 2026, Proclamation 11021 moved US metal tariffs to the full customs value of a product from 6 April 2026, as Germany Trade and Invest reported.
- In December 2025, a Federal Register notice implemented a combined 15% US rate for qualifying Korean goods.
- In September 2025, a US executive order implemented the 15% combined rate for qualifying Japanese products.
- In August 2025, Tramontina said the company was seeking new partners in Latin America, Africa and the Middle East.
- In August 2025, 407 HTSUS codes, including 8211 and 8215, joined the Section 232 tariff list through a BIS notice.
- In July 2025, Fiskars Group reported a 150 bps fall in Q2 2025 comparable gross margin at the Fiskars business area on tariff impacts.
Key Players in the Cutlery Market
Share Leaders
- Oneida Group
- Fiskars Group
Precision Knife and Cutlery Makers
- Zwilling J.A. Henckels
- Victorinox AG
Value and Hospitality Suppliers
- Tramontina
- Amefa B.V.
- Mikasa
Design, Premium and Eco Brands
- Robert Welch Designs Ltd.
- Sambonet Paderno Industrie S.p.A.
- Eco-Products, Inc.
Cutlery Market - Report Scope
Table 9: Report Scope for the Cutlery Market (coverage fields and definitions), 2026 to 2036
| Coverage field | Report scope |
|---|---|
| Market breakdown | Product type; application; distribution channel; region |
| Quantitative units | USD million |
| Market definition | Cutlery market covering plastic, stainless steel, silver and gold spoons, forks and knives for household, public consumption restaurant and high-end restaurant use. |
| Regions covered | North America; Latin America; Western Europe; Eastern Europe; East Asia; South Asia Pacific; Middle East and Africa |
| Countries covered | USA; UK; European Union; Japan; South Korea |
| Key companies profiled | Oneida Group, Fiskars Group, Zwilling J.A. Henckels, Tramontina, Robert Welch Designs Ltd., Victorinox AG, Mikasa, Amefa B.V., Sambonet Paderno Industrie S.p.A., Eco-Products, Inc. |
| Forecast period | 2026 to 2036 |
Cutlery Market - Research Methodology
Table 10: Research Methodology for the Cutlery Market (research methods and approach), 2026 edition
| Method | Approach |
|---|---|
| Data Sources | Tariff and trade facts come from government notices, company releases and trade press dated May 2025 or later. |
| Desk Research | Desk research covers US tariff notices, trade agreements, anti-dumping reviews and exporter statements on cutlery sourcing. |
| Market Sizing and Forecasting | Sizing starts from the 2025 base of USD 11,320 million and the 6% CAGR. |
| Data Validation | Tariff rates and effective dates were taken from the Federal Register, BIS notices and executive orders themselves. |
Cutlery Market by Segments
Cutlery Market segmented by Product Type:
- Plastic
- Stainless Steel
- Silver
- Gold
Cutlery Market segmented by Application:
- Household
- Public Consumption Restaurant
- High-end Restaurant
Cutlery Market segmented by Distribution Channel:
- Online
- Offline
Cutlery Market by Region
- North America
- Latin America
- Western Europe
- Eastern Europe
- East Asia
- South Asia Pacific
- Middle East and Africa
Research Sources and Bibliography
- [1] Bureau of Industry and Security, Federal Register. (2025, August 19). Adoption and Procedures of the Section 232 Steel and Aluminum Tariff Inclusions Process. https://www.govinfo.gov/content/pkg/FR-2025-08-19/html/2025-15819.htm
- [2] Jornal do Comércio. (2025, August 24). Multinacionais do setor metalmecânico da Serra criam estratégias após tarifaço dos EUA. https://www.jornaldocomercio.com/mapa-economico/regiao-serra/2025/08/1215576-multinacionais-do-setor-metalmecanico-da-serra-criam-estrategias-apos-tarifaco-dos-eua.html
- [3] International Trade Administration and USTR, Federal Register. (2025, December 4). Implementing Certain Tariff-Related Elements of the U.S.-Korea Strategic Trade and Investment Deal. https://www.govinfo.gov/content/pkg/FR-2025-12-04/html/2025-21940.htm
- [4] U.S. Department of Commerce, Bureau of Industry and Security. (2025, August 19). Department of Commerce Adds 407 Product Categories to Steel and Aluminum Tariffs. https://media.bis.gov/sites/default/files/documents/Department%20of%20Commerce%20Adds%20407%20Product%20Categories%20to%20Steel%20and%20Aluminum%20Tariffs.pdf
- [5] Germany Trade and Invest. (2026, June 8). Update - US-Zölle auf Stahl und Stahlprodukte. https://www.gtai.de/de/trade/usa/zoll/usa-zoelle-stahl-aluminium-1868376
- [6] The White House. (2025, September 4). Implementing the United States-Japan Agreement. https://www.whitehouse.gov/presidential-actions/2025/09/implementing-the-united-states-japan-agreement/
- [7] Fiskars Corporation. (2025, July 17). Half-year Financial Report for January-June 2025. https://fiskarsgroup.com/news/stock-exchange-release/fiskars-corporation-half-year-financial-report-for-january-june-2025/
- [8] Marval O'Farrell Mairal. (2026, June 3). Anti-Dumping Proceeding: Tableware. https://www.marval.com/publicacion/proceso-antidumping-cubiertos-de-mesa-17618?lang=en
This bibliography is provided for reader reference. The full report contains the complete reference list and detailed citations.
This Report Answers
- What size will the cutlery market reach in 2026 and by 2036?
- What CAGR will cutlery sales record from 2026 to 2036?
- Which product type will lead cutlery sales?
- Which distribution channel will carry the most sales?
- Which profiled country will grow fastest?
- Which companies will hold the largest shares?
Table of Content
- Key Takeaways
- Market Size and CAGR
- Top Growth Driver
- Fastest Growing Segment
- Leading Region
- Key Companies
- Emerging Opportunities
- Executive Summary
- Global Market Outlook
- Demand-side Trends
- Supply-side Trends
- Technology Roadmap Analysis
- Analysis and Recommendations
- Analyst Perspective (What is happening? Why now? What should investors know?)
- Key Questions Answered
- How large is the market?
- What is the CAGR?
- What are key trends?
- Which region dominates?
- Who are the leaders?
Read More...
- Market Overview
- Market Coverage / Taxonomy
- Market Definition / Scope / Limitations
- Research Methodology
- Chapter Orientation
- Analytical Lens and Working Hypotheses
- Market Structure, Signals, and Trend Drivers
- Benchmarking and Cross-market Comparability
- Market Sizing, Forecasting, and Opportunity Mapping
- Research Design and Evidence Framework
- Desk Research Programme (Secondary Evidence)
- Expert Input and Fieldwork (Primary Evidence)
- Tooling, Models, and Reference Databases
- Data Engineering and Model Build
- Quality Assurance and Audit Trail
- Market Background
- Market Dynamics (Drivers, Restraints, Opportunity, Trends)
- Scenario Forecast (Optimistic, Likely, Conservative)
- Impact Analysis
- AI Impact
- Sustainability Impact
- Regulatory Impact
- Technology Impact
- Consumer / Buyer Analysis
- Purchase Drivers
- Adoption Barriers
- Buyer Journey
- Opportunity Map Analysis
- Product Life Cycle Analysis
- Supply Chain Analysis
- Investment Feasibility Matrix
- Value Chain Analysis
- PESTLE and Porter's Analysis
- Regulatory Landscape
- Regional Parent Market Outlook
- Production and Consumption Statistics
- Import and Export Statistics
- Global Market Analysis and Forecast, 2021 to 2036
- Historical Market Size Value (USD Million) Analysis, 2021 to 2025
- Current and Future Market Size Value (USD Million) Projections, 2026 to 2036
- Y-o-Y Growth Trend Analysis
- Absolute $ Opportunity Analysis
- Global Market Pricing Analysis, 2021 to 2036
- Global Market Analysis and Forecast, By Product Type, 2021 to 2036
- Introduction / Key Findings
- Historical Market Size Value (USD Million) Analysis By Product Type, 2021 to 2025
- Current and Future Market Size Value (USD Million) Analysis and Forecast By Product Type, 2026 to 2036
- Plastic
- Stainless Steel
- Silver
- Gold
- Y-o-Y Growth Trend Analysis By Product Type, 2021 to 2025
- Absolute $ Opportunity Analysis By Product Type, 2026 to 2036
- Global Market Analysis and Forecast, By Application, 2021 to 2036
- Introduction / Key Findings
- Historical Market Size Value (USD Million) Analysis By Application, 2021 to 2025
- Current and Future Market Size Value (USD Million) Analysis and Forecast By Application, 2026 to 2036
- Household
- Public Consumption Restaurant
- High-end Restaurant
- Y-o-Y Growth Trend Analysis By Application, 2021 to 2025
- Absolute $ Opportunity Analysis By Application, 2026 to 2036
- Global Market Analysis and Forecast, By Distribution Channel, 2021 to 2036
- Introduction / Key Findings
- Historical Market Size Value (USD Million) Analysis By Distribution Channel, 2021 to 2025
- Current and Future Market Size Value (USD Million) Analysis and Forecast By Distribution Channel, 2026 to 2036
- Online
- Offline
- Y-o-Y Growth Trend Analysis By Distribution Channel, 2021 to 2025
- Absolute $ Opportunity Analysis By Distribution Channel, 2026 to 2036
- Global Market Analysis and Forecast, By Region, 2021 to 2036
- Introduction
- Historical Market Size Value (USD Million) Analysis By Region, 2021 to 2025
- Current Market Size Value (USD Million) Analysis and Forecast By Region, 2026 to 2036
- North America
- Latin America
- Western Europe
- Eastern Europe
- East Asia
- Middle East and Africa
- Market Attractiveness Analysis By Region
- North America Market Analysis and Forecast, By Country, 2021 to 2036
- Historical Market Size Value (USD Million) Trend Analysis By Market Taxonomy, 2021 to 2025
- Market Size Value (USD Million) Forecast By Market Taxonomy, 2026 to 2036
- By Country
- By Product Type
- By Application
- By Distribution Channel
- Market Attractiveness Analysis
- By Country
- By Product Type
- By Application
- By Distribution Channel
- Key Takeaways
- Latin America Market Analysis and Forecast, By Country
- Historical Market Size Value (USD Million) Trend Analysis By Market Taxonomy, 2021 to 2025
- Market Size Value (USD Million) Forecast By Market Taxonomy, 2026 to 2036
- By Country
- By Product Type
- By Application
- By Distribution Channel
- Market Attractiveness Analysis
- By Country
- By Product Type
- By Application
- By Distribution Channel
- Key Takeaways
- Western Europe Market Analysis and Forecast, By Country
- Historical Market Size Value (USD Million) Trend Analysis By Market Taxonomy, 2021 to 2025
- Market Size Value (USD Million) Forecast By Market Taxonomy, 2026 to 2036
- By Country
- By Product Type
- By Application
- By Distribution Channel
- Market Attractiveness Analysis
- By Country
- By Product Type
- By Application
- By Distribution Channel
- Key Takeaways
- Eastern Europe Market Analysis and Forecast, By Country
- Historical Market Size Value (USD Million) Trend Analysis By Market Taxonomy, 2021 to 2025
- Market Size Value (USD Million) Forecast By Market Taxonomy, 2026 to 2036
- By Country
- By Product Type
- By Application
- By Distribution Channel
- Market Attractiveness Analysis
- By Country
- By Product Type
- By Application
- By Distribution Channel
- Key Takeaways
- East Asia Market Analysis and Forecast, By Country
- Historical Market Size Value (USD Million) Trend Analysis By Market Taxonomy, 2021 to 2025
- Market Size Value (USD Million) Forecast By Market Taxonomy, 2026 to 2036
- By Country
- South Asia Pacific
- By Product Type
- By Application
- By Distribution Channel
- By Country
- Market Attractiveness Analysis
- By Country
- By Product Type
- By Application
- By Distribution Channel
- Key Takeaways
- Middle East and Africa Market Analysis and Forecast, By Country
- Historical Market Size Value (USD Million) Trend Analysis By Market Taxonomy, 2021 to 2025
- Market Size Value (USD Million) Forecast By Market Taxonomy, 2026 to 2036
- By Country
- By Product Type
- By Application
- By Distribution Channel
- Market Attractiveness Analysis
- By Country
- By Product Type
- By Application
- By Distribution Channel
- Key Takeaways
- Key Countries Market Analysis
- USA
- Pricing Analysis
- Market Share Analysis, 2025
- By Product Type
- By Application
- By Distribution Channel
- South Korea
- Pricing Analysis
- Market Share Analysis, 2025
- By Product Type
- By Application
- By Distribution Channel
- European Union
- Pricing Analysis
- Market Share Analysis, 2025
- By Product Type
- By Application
- By Distribution Channel
- UK
- Pricing Analysis
- Market Share Analysis, 2025
- By Product Type
- By Application
- By Distribution Channel
- Japan
- Pricing Analysis
- Market Share Analysis, 2025
- By Product Type
- By Application
- By Distribution Channel
- USA
- Market Structure Analysis
- Competition Dashboard
- Competition Benchmarking
- Market Share Analysis of Top Players
- By Regional
- By Product Type
- By Application
- By Distribution Channel
- Emerging Startups
- Innovation Benchmarking
- Competition Analysis
- Competition Deep Dive
- Fiskars Group
- Overview
- Product Portfolio
- Profitability by Market Segments
- Sales Footprint
- Strategy Overview
- Marketing Strategy
- Product Strategy
- Channel Strategy
- Tramontina
- Oneida Group
- Zwilling J.A. Henckels
- Robert Welch Designs Ltd.
- Victorinox AG
- Amefa B.V.
- Mikasa
- Sambonet Paderno Industrie S.p.A.
- Eco-Products, Inc.
- Fiskars Group
- Case Studies
- Success Stories
- Recent Developments
- Competition Deep Dive
- Assumptions & Acronyms Used
List of Tables
- Table 1: Global Market Value (USD Million) Forecast by Region, 2021 to 2036
- Table 2: Global Market Value (USD Million) Forecast by Product Type, 2021 to 2036
- Table 3: Global Market Value (USD Million) Forecast by Application, 2021 to 2036
- Table 4: Global Market Value (USD Million) Forecast by Distribution Channel, 2021 to 2036
- Table 5: North America Market Value (USD Million) Forecast by Country, 2021 to 2036
- Table 6: North America Market Value (USD Million) Forecast by Product Type, 2021 to 2036
- Table 7: North America Market Value (USD Million) Forecast by Application, 2021 to 2036
- Table 8: North America Market Value (USD Million) Forecast by Distribution Channel, 2021 to 2036
- Table 9: Latin America Market Value (USD Million) Forecast by Country, 2021 to 2036
- Table 10: Latin America Market Value (USD Million) Forecast by Product Type, 2021 to 2036
- Table 11: Latin America Market Value (USD Million) Forecast by Application, 2021 to 2036
- Table 12: Latin America Market Value (USD Million) Forecast by Distribution Channel, 2021 to 2036
- Table 13: Western Europe Market Value (USD Million) Forecast by Country, 2021 to 2036
- Table 14: Western Europe Market Value (USD Million) Forecast by Product Type, 2021 to 2036
- Table 15: Western Europe Market Value (USD Million) Forecast by Application, 2021 to 2036
- Table 16: Western Europe Market Value (USD Million) Forecast by Distribution Channel, 2021 to 2036
- Table 17: Eastern Europe Market Value (USD Million) Forecast by Country, 2021 to 2036
- Table 18: Eastern Europe Market Value (USD Million) Forecast by Product Type, 2021 to 2036
- Table 19: Eastern Europe Market Value (USD Million) Forecast by Application, 2021 to 2036
- Table 20: Eastern Europe Market Value (USD Million) Forecast by Distribution Channel, 2021 to 2036
- Table 21: East Asia Market Value (USD Million) Forecast by Country, 2021 to 2036
- Table 22: East Asia Market Value (USD Million) Forecast by Product Type, 2021 to 2036
- Table 23: East Asia Market Value (USD Million) Forecast by Application, 2021 to 2036
- Table 24: East Asia Market Value (USD Million) Forecast by Distribution Channel, 2021 to 2036
- Table 25: Middle East and Africa Market Value (USD Million) Forecast by Country, 2021 to 2036
- Table 26: Middle East and Africa Market Value (USD Million) Forecast by Product Type, 2021 to 2036
- Table 27: Middle East and Africa Market Value (USD Million) Forecast by Application, 2021 to 2036
- Table 28: Middle East and Africa Market Value (USD Million) Forecast by Distribution Channel, 2021 to 2036
List of Figures
- Figure 1: Global Market Pricing Analysis
- Figure 2: Global Market Value (USD Million) Forecast 2021-2036
- Figure 3: Global Market Value Share and BPS Analysis by Product Type, 2026 and 2036
- Figure 4: Global Market Y-o-Y Growth Comparison by Product Type, 2026-2036
- Figure 5: Global Market Attractiveness Analysis by Product Type
- Figure 6: Global Market Value Share and BPS Analysis by Application, 2026 and 2036
- Figure 7: Global Market Y-o-Y Growth Comparison by Application, 2026-2036
- Figure 8: Global Market Attractiveness Analysis by Application
- Figure 9: Global Market Value Share and BPS Analysis by Distribution Channel, 2026 and 2036
- Figure 10: Global Market Y-o-Y Growth Comparison by Distribution Channel, 2026-2036
- Figure 11: Global Market Attractiveness Analysis by Distribution Channel
- Figure 12: Global Market Value (USD Million) Share and BPS Analysis by Region, 2026 and 2036
- Figure 13: Global Market Y-o-Y Growth Comparison by Region, 2026-2036
- Figure 14: Global Market Attractiveness Analysis by Region
- Figure 15: North America Market Incremental Dollar Opportunity, 2026-2036
- Figure 16: Latin America Market Incremental Dollar Opportunity, 2026-2036
- Figure 17: Western Europe Market Incremental Dollar Opportunity, 2026-2036
- Figure 18: Eastern Europe Market Incremental Dollar Opportunity, 2026-2036
- Figure 19: East Asia Market Incremental Dollar Opportunity, 2026-2036
- Figure 20: Middle East and Africa Market Incremental Dollar Opportunity, 2026-2036
- Figure 21: North America Market Value Share and BPS Analysis by Country, 2026 and 2036
- Figure 22: North America Market Value Share and BPS Analysis by Product Type, 2026 and 2036
- Figure 23: North America Market Y-o-Y Growth Comparison by Product Type, 2026-2036
- Figure 24: North America Market Attractiveness Analysis by Product Type
- Figure 25: North America Market Value Share and BPS Analysis by Application, 2026 and 2036
- Figure 26: North America Market Y-o-Y Growth Comparison by Application, 2026-2036
- Figure 27: North America Market Attractiveness Analysis by Application
- Figure 28: North America Market Value Share and BPS Analysis by Distribution Channel, 2026 and 2036
- Figure 29: North America Market Y-o-Y Growth Comparison by Distribution Channel, 2026-2036
- Figure 30: North America Market Attractiveness Analysis by Distribution Channel
- Figure 31: Latin America Market Value Share and BPS Analysis by Country, 2026 and 2036
- Figure 32: Latin America Market Value Share and BPS Analysis by Product Type, 2026 and 2036
- Figure 33: Latin America Market Y-o-Y Growth Comparison by Product Type, 2026-2036
- Figure 34: Latin America Market Attractiveness Analysis by Product Type
- Figure 35: Latin America Market Value Share and BPS Analysis by Application, 2026 and 2036
- Figure 36: Latin America Market Y-o-Y Growth Comparison by Application, 2026-2036
- Figure 37: Latin America Market Attractiveness Analysis by Application
- Figure 38: Latin America Market Value Share and BPS Analysis by Distribution Channel, 2026 and 2036
- Figure 39: Latin America Market Y-o-Y Growth Comparison by Distribution Channel, 2026-2036
- Figure 40: Latin America Market Attractiveness Analysis by Distribution Channel
- Figure 41: Western Europe Market Value Share and BPS Analysis by Country, 2026 and 2036
- Figure 42: Western Europe Market Value Share and BPS Analysis by Product Type, 2026 and 2036
- Figure 43: Western Europe Market Y-o-Y Growth Comparison by Product Type, 2026-2036
- Figure 44: Western Europe Market Attractiveness Analysis by Product Type
- Figure 45: Western Europe Market Value Share and BPS Analysis by Application, 2026 and 2036
- Figure 46: Western Europe Market Y-o-Y Growth Comparison by Application, 2026-2036
- Figure 47: Western Europe Market Attractiveness Analysis by Application
- Figure 48: Western Europe Market Value Share and BPS Analysis by Distribution Channel, 2026 and 2036
- Figure 49: Western Europe Market Y-o-Y Growth Comparison by Distribution Channel, 2026-2036
- Figure 50: Western Europe Market Attractiveness Analysis by Distribution Channel
- Figure 51: Eastern Europe Market Value Share and BPS Analysis by Country, 2026 and 2036
- Figure 52: Eastern Europe Market Value Share and BPS Analysis by Product Type, 2026 and 2036
- Figure 53: Eastern Europe Market Y-o-Y Growth Comparison by Product Type, 2026-2036
- Figure 54: Eastern Europe Market Attractiveness Analysis by Product Type
- Figure 55: Eastern Europe Market Value Share and BPS Analysis by Application, 2026 and 2036
- Figure 56: Eastern Europe Market Y-o-Y Growth Comparison by Application, 2026-2036
- Figure 57: Eastern Europe Market Attractiveness Analysis by Application
- Figure 58: Eastern Europe Market Value Share and BPS Analysis by Distribution Channel, 2026 and 2036
- Figure 59: Eastern Europe Market Y-o-Y Growth Comparison by Distribution Channel, 2026-2036
- Figure 60: Eastern Europe Market Attractiveness Analysis by Distribution Channel
- Figure 61: East Asia Market Value Share and BPS Analysis by Country, 2026 and 2036
- Figure 62: East Asia Market Value Share and BPS Analysis by Product Type, 2026 and 2036
- Figure 63: East Asia Market Y-o-Y Growth Comparison by Product Type, 2026-2036
- Figure 64: East Asia Market Attractiveness Analysis by Product Type
- Figure 65: East Asia Market Value Share and BPS Analysis by Application, 2026 and 2036
- Figure 66: East Asia Market Y-o-Y Growth Comparison by Application, 2026-2036
- Figure 67: East Asia Market Attractiveness Analysis by Application
- Figure 68: East Asia Market Value Share and BPS Analysis by Distribution Channel, 2026 and 2036
- Figure 69: East Asia Market Y-o-Y Growth Comparison by Distribution Channel, 2026-2036
- Figure 70: East Asia Market Attractiveness Analysis by Distribution Channel
- Figure 71: Middle East and Africa Market Value Share and BPS Analysis by Country, 2026 and 2036
- Figure 72: Middle East and Africa Market Value Share and BPS Analysis by Product Type, 2026 and 2036
- Figure 73: Middle East and Africa Market Y-o-Y Growth Comparison by Product Type, 2026-2036
- Figure 74: Middle East and Africa Market Attractiveness Analysis by Product Type
- Figure 75: Middle East and Africa Market Value Share and BPS Analysis by Application, 2026 and 2036
- Figure 76: Middle East and Africa Market Y-o-Y Growth Comparison by Application, 2026-2036
- Figure 77: Middle East and Africa Market Attractiveness Analysis by Application
- Figure 78: Middle East and Africa Market Value Share and BPS Analysis by Distribution Channel, 2026 and 2036
- Figure 79: Middle East and Africa Market Y-o-Y Growth Comparison by Distribution Channel, 2026-2036
- Figure 80: Middle East and Africa Market Attractiveness Analysis by Distribution Channel
- Figure 81: Global Market - Tier Structure Analysis
- Figure 82: Global Market - Company Share Analysis
Frequently Asked Questions
How large will the cutlery market be in 2026?
USD 11,999.2 million is the 2026 estimate, and FMI projects USD 21,490.4 million by 2036.
What growth rate will cutlery sales post through 2036?
Cutlery will expand at a 6% CAGR from 2026 to 2036, with premium sets and restaurant orders carrying sales.
Which product type will hold the top share in 2026?
Stainless steel will lead with an estimated 58.4% of product type sales, ahead of plastic.
Which distribution channel will lead in 2026?
Offline stores will carry about 67.3% of channel sales (estimated), since buyers will still handle premium sets before paying.
Which country will record the fastest growth?
The USA will grow fastest in the FMI country set, at 6.3% from 2026 to 2036, just ahead of South Korea at 6.2%.
Which companies will hold the largest shares?
Oneida Group at 18% to 22%, Fiskars Group at 15% to 19% and Zwilling J.A. Henckels at 12% to 16% will form the top three.
Preview the report firsthand - request a free sample
Get SampleGet the brochure for pricing and purchase details.
Get PDF
