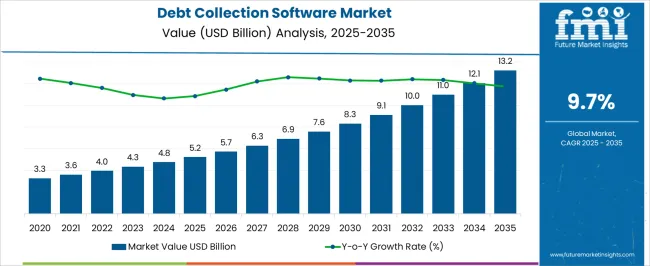
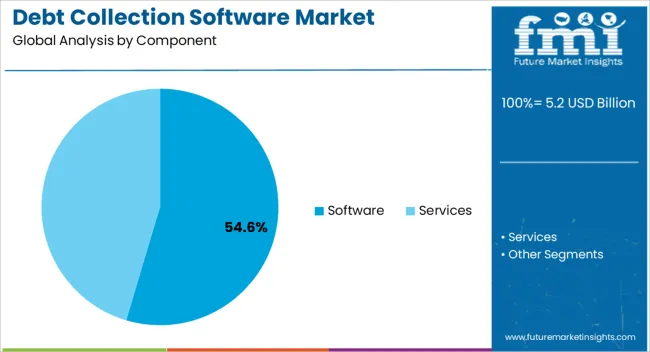
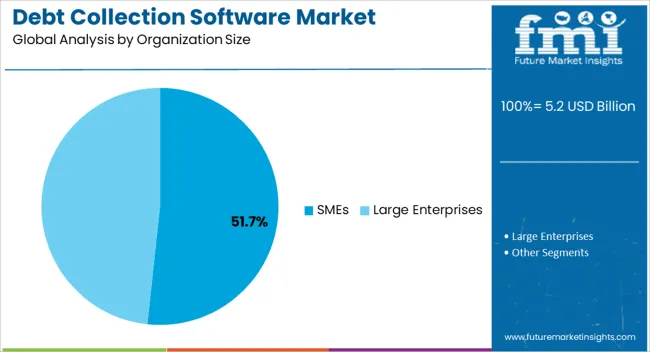
The debt collection software market is estimated to capture a valuation of USD 4.3 billion in 2023 and is projected to reach USD 11.5 billion by 2033, at a CAGR of 10.2% from 2022 to 2032.
The demand for debt collection software is increasing as it provides an organization with various features that lead to more efficient operations and a reduction in the excessive costs incurred due to these processes, resulting in increased market growth for debt collection software.
Various factors drive the global market share, including the need to manage and automate all debt collection and recovery processes, the increasing need to reduce bad debt and improve cash flow while optimizing collection costs, and a surge in demand for debt collection software.
What Key Dynamics Governing the Growth of the Global Market?
Debt collection software is designed to help with debt collection by streamlining the debt recovery process. The demand for debt collection software is growing as it aids debt collectors in managing workflow, adhering to government requirements, and collecting online payments.
The debt collection software takes care of every stage of the loan recovery process, from gathering the borrower's information to sending late invoice reminders, making phone calls, and managing debt collection. Due to its multifunctionality, the sales of debt collection software are anticipated to rise.
Several factors drive the growth of the global market, including the increased need to minimize bad debt and improve cash flow, increased demand for automation in the accounts receivable process, and increased use of multichannel collection models.
In the coming years, the increasing trend of analytics-enabled collection methods is projected to impact sales significantly. However, high debt collection service costs and various debt collection legislation worldwide may somewhat limit the global market. As a result, each of these variables is expected to significantly impact the demand for debt-collection software during the forecast period.
The demand for debt collection software or automation has been fueled by the need to speed up day-to-day activities by eliminating labor-intensive administrative tasks and transferring that burden to technology. The debt collection software industry is predicted to develop rapidly as the automation of accounts receivable processes can shift to digital methods.
Automating the debt collection and recovery process increases collection productivity by systematically determining reasons and reducing the time it takes to handle cases. As a result, the sales of debt collection software are projected to rise rapidly during the forecast period.
The demand for debt collection software is likely to rise as firms collecting debt face increased pressure to decrease costs while improving operations and boosting income. This element is predicted to significantly impact the sales of debt collection software and the overall global market's growth.
The growing need for financial organizations to reduce the time and cost associated with the manual debt recovery process and the growing need to provide customer-centric debt collection management is projected to create lucrative opportunities for the global market to grow.
Attributes | Details |
---|---|
Market CAGR (2023 to 2033) | 10.2% |
Market Valuation (2023) | USD 4.3 billion |
Market Valuation (2033) | USD 11.5 billion |
The sales of debt collection software are anticipated to grow during the forecast period by large health institutions to cope with internal medical debt recovery has become critical. The market secured a valuation of USD 2.9 billion in 2018 and USD 4.0 billion in 2022. The market grew steadily by increasing the demand for debt collection software, increasing debt levels, and strict regulations.
The growing advanced technologies such as machine learning, artificial intelligence, and analytics fuel the global market. These technologies improve efficiency during debt processes. Cloud-based solutions have recently gained popularity due to various benefits, including data security, scalability, and cost-effectiveness. The increasing new market entrance, innovations, new product launches, and strict regulation is estimated to continue to expand the global market by 2033.
Due to a spike in acceptance of cloud-based debt collection software among large organizations and SMEs, attributable to the need to reduce infrastructure investment, the cloud-based deployment mode is predicted to grow at a significant rate of 9.2% over the projection period.
The on-premise segment is also anticipated to grow rapidly in the debt-collection software market, and this trend is likely to continue over the forecast period. It is due to the growing requirement to protect vital data from cyber threats and monitor data intrusion within enterprises, encouraging customers to adopt on-premises debt collection software. It also allows businesses to take responsibility for costly software upgrades.
In 2021, the financial institution sector led the global market, projected to continue during the forecast period. It can be linked to the banking industry's fast digitalization. Furthermore, debt collection software allows banks to automate their collections activities, which is projected to promote software adoption among banks.
However, due to rising patient costs and bad debt in the healthcare industry, the healthcare industry is predicted to increase at a significant rate. Furthermore, the expansion of debt collection software in the healthcare business is fueled by a surge in demand for debt collection software and technologically enhanced systems to reduce bad debt and speed up and automate the revenue cycle.
Countries | Current Market Share 2022 |
---|---|
United States | 19.2% |
Germany | 10.2% |
Japan | 5.4% |
Australia | 3.3% |
The North American region has much potential for the debt collection software market to flourish. In terms of debt recovery, the region has faced several difficulties. Even if student debts in the United States were forgiven or modified, there would still be trillions of dollars in debt to be repaid in the US alone. Despite this, the debt collection sector has largely escaped the fintech revolution of the last decade.
Traditional debt collection measures, such as aggressive calls, door-to-door collections, and invoice reminders, have all failed. Inefficient collection procedures based on flawed tactics and models raise operating costs and hurt liquidity. According to a whitepaper published by Collect Edge, the industry average for unpaid debt collection in 2019 was only 20%, down from 30% a year ago.
Debt collection software allows banks to automate their collections activities, which is projected to promote software adoption among banks. However, due to rising patient costs and bad debt in the healthcare industry, the healthcare industry is predicted to increase at the fast rate.
The expansion of debt collection software in the healthcare business is fueled by a surge in demand for technologically enhanced systems to reduce bad debt and speed and automate the revenue cycle. These countries are continue to expand the global market by innovating advanced products by invest in research and developing activities.
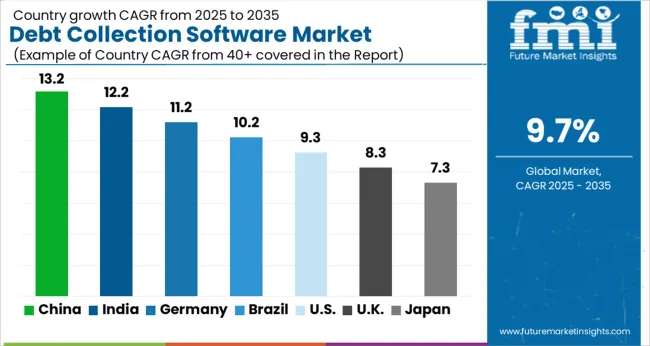
Countries | Current CAGR Market Values 2023 |
---|---|
China | 19.2% |
India | 10.2% |
United Kingdom | 5.4% |
Vendors of debt collection software use a variety of expansion techniques to expand their presence and market share in the worldwide market. Partnerships and collaborations with other companies, mergers and acquisitions, strategic alliances, new product launches, and the strengthening of regional and worldwide distribution networks are all methods that vendors employ.
These key players are developing improved and advanced products as per customers' requirements to enhance their experiences. They are upsurging the global market through various sales and distribution networks. These players invest their time in research and development activities to improve solutions and attract end users' attention.
Other Essential Players in the Market are
Recent Developments in the Global Market
Attributes | Details |
---|---|
Forecast Period | 2023 to 2033 |
Historical Data Available for | 2018 to 2022 |
Market Analysis | USD billion for Value |
Key Countries Covered | United States, United Kingdom, Japan, India, China, Australia, Germany |
Key Segments Covered | Component, Deployment, Organization Size, End User, Region |
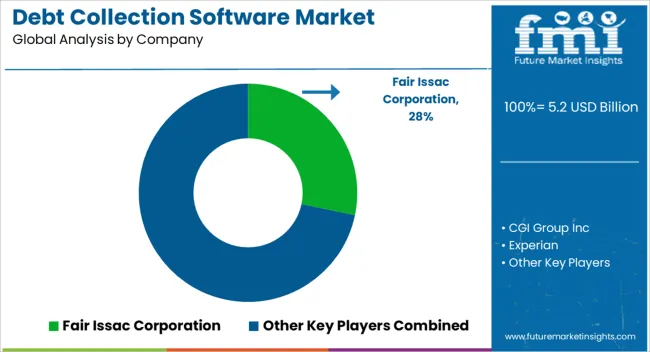
Key Companies Profiled | Fair Issac Corporation; CGI Group Inc; Experian; Pegasystems Inc; JST Collection System Co., Ltd; Interactive Intelligence Group Inc; Chetu Inc; Temenos Group AG; Fiserv Inc; TransUnion; Nucleus Software; TietoEVRY; AMEYO; Kuhlet; Totality Software; Advantage Software; InterProse Corporation; Interctive Intelligence Group Inc |
Report Coverage | Market Forecast, Company Share Analysis, Competition Intelligence, DROT Analysis, Market Dynamics and Challenges, and Strategic Growth Initiatives |
Customization & Pricing | Available upon Request |
Table 1: Global Market Value (US$ Million) Forecast by Region, 2018 to 2033
Table 2: Global Market Value (US$ Million) Forecast by Component, 2018 to 2033
Table 3: Global Market Value (US$ Million) Forecast by Deployment, 2018 to 2033
Table 4: Global Market Value (US$ Million) Forecast by Organization Size, 2018 to 2033
Table 5: Global Market Value (US$ Million) Forecast by End-user, 2018 to 2033
Table 6: North America Market Value (US$ Million) Forecast by Country, 2018 to 2033
Table 7: North America Market Value (US$ Million) Forecast by Component, 2018 to 2033
Table 8: North America Market Value (US$ Million) Forecast by Deployment, 2018 to 2033
Table 9: North America Market Value (US$ Million) Forecast by Organization Size, 2018 to 2033
Table 10: North America Market Value (US$ Million) Forecast by End-user, 2018 to 2033
Table 11: Latin America Market Value (US$ Million) Forecast by Country, 2018 to 2033
Table 12: Latin America Market Value (US$ Million) Forecast by Component, 2018 to 2033
Table 13: Latin America Market Value (US$ Million) Forecast by Deployment, 2018 to 2033
Table 14: Latin America Market Value (US$ Million) Forecast by Organization Size, 2018 to 2033
Table 15: Latin America Market Value (US$ Million) Forecast by End-user, 2018 to 2033
Table 16: Europe Market Value (US$ Million) Forecast by Country, 2018 to 2033
Table 17: Europe Market Value (US$ Million) Forecast by Component, 2018 to 2033
Table 18: Europe Market Value (US$ Million) Forecast by Deployment, 2018 to 2033
Table 19: Europe Market Value (US$ Million) Forecast by Organization Size, 2018 to 2033
Table 20: Europe Market Value (US$ Million) Forecast by End-user, 2018 to 2033
Table 21: South Asia Market Value (US$ Million) Forecast by Country, 2018 to 2033
Table 22: South Asia Market Value (US$ Million) Forecast by Component, 2018 to 2033
Table 23: South Asia Market Value (US$ Million) Forecast by Deployment, 2018 to 2033
Table 24: South Asia Market Value (US$ Million) Forecast by Organization Size, 2018 to 2033
Table 25: South Asia Market Value (US$ Million) Forecast by End-user, 2018 to 2033
Table 26: East Asia Market Value (US$ Million) Forecast by Country, 2018 to 2033
Table 27: East Asia Market Value (US$ Million) Forecast by Component, 2018 to 2033
Table 28: East Asia Market Value (US$ Million) Forecast by Deployment, 2018 to 2033
Table 29: East Asia Market Value (US$ Million) Forecast by Organization Size, 2018 to 2033
Table 30: East Asia Market Value (US$ Million) Forecast by End-user, 2018 to 2033
Table 31: Oceania Market Value (US$ Million) Forecast by Country, 2018 to 2033
Table 32: Oceania Market Value (US$ Million) Forecast by Component, 2018 to 2033
Table 33: Oceania Market Value (US$ Million) Forecast by Deployment, 2018 to 2033
Table 34: Oceania Market Value (US$ Million) Forecast by Organization Size, 2018 to 2033
Table 35: Oceania Market Value (US$ Million) Forecast by End-user, 2018 to 2033
Table 36: MEA Market Value (US$ Million) Forecast by Country, 2018 to 2033
Table 37: MEA Market Value (US$ Million) Forecast by Component, 2018 to 2033
Table 38: MEA Market Value (US$ Million) Forecast by Deployment, 2018 to 2033
Table 39: MEA Market Value (US$ Million) Forecast by Organization Size, 2018 to 2033
Table 40: MEA Market Value (US$ Million) Forecast by End-user, 2018 to 2033
Figure 1: Global Market Value (US$ Million) by Component, 2023 to 2033
Figure 2: Global Market Value (US$ Million) by Deployment, 2023 to 2033
Figure 3: Global Market Value (US$ Million) by Organization Size, 2023 to 2033
Figure 4: Global Market Value (US$ Million) by End-user, 2023 to 2033
Figure 5: Global Market Value (US$ Million) by Region, 2023 to 2033
Figure 6: Global Market Value (US$ Million) Analysis by Region, 2018 to 2033
Figure 7: Global Market Value Share (%) and BPS Analysis by Region, 2023 to 2033
Figure 8: Global Market Y-o-Y Growth (%) Projections by Region, 2023 to 2033
Figure 9: Global Market Value (US$ Million) Analysis by Component, 2018 to 2033
Figure 10: Global Market Value Share (%) and BPS Analysis by Component, 2023 to 2033
Figure 11: Global Market Y-o-Y Growth (%) Projections by Component, 2023 to 2033
Figure 12: Global Market Value (US$ Million) Analysis by Deployment, 2018 to 2033
Figure 13: Global Market Value Share (%) and BPS Analysis by Deployment, 2023 to 2033
Figure 14: Global Market Y-o-Y Growth (%) Projections by Deployment, 2023 to 2033
Figure 15: Global Market Value (US$ Million) Analysis by Organization Size, 2018 to 2033
Figure 16: Global Market Value Share (%) and BPS Analysis by Organization Size, 2023 to 2033
Figure 17: Global Market Y-o-Y Growth (%) Projections by Organization Size, 2023 to 2033
Figure 18: Global Market Value (US$ Million) Analysis by End-user, 2018 to 2033
Figure 19: Global Market Value Share (%) and BPS Analysis by End-user, 2023 to 2033
Figure 20: Global Market Y-o-Y Growth (%) Projections by End-user, 2023 to 2033
Figure 21: Global Market Attractiveness by Component, 2023 to 2033
Figure 22: Global Market Attractiveness by Deployment, 2023 to 2033
Figure 23: Global Market Attractiveness by Organization Size, 2023 to 2033
Figure 24: Global Market Attractiveness by End-user, 2023 to 2033
Figure 25: Global Market Attractiveness by Region, 2023 to 2033
Figure 26: North America Market Value (US$ Million) by Component, 2023 to 2033
Figure 27: North America Market Value (US$ Million) by Deployment, 2023 to 2033
Figure 28: North America Market Value (US$ Million) by Organization Size, 2023 to 2033
Figure 29: North America Market Value (US$ Million) by End-user, 2023 to 2033
Figure 30: North America Market Value (US$ Million) by Country, 2023 to 2033
Figure 31: North America Market Value (US$ Million) Analysis by Country, 2018 to 2033
Figure 32: North America Market Value Share (%) and BPS Analysis by Country, 2023 to 2033
Figure 33: North America Market Y-o-Y Growth (%) Projections by Country, 2023 to 2033
Figure 34: North America Market Value (US$ Million) Analysis by Component, 2018 to 2033
Figure 35: North America Market Value Share (%) and BPS Analysis by Component, 2023 to 2033
Figure 36: North America Market Y-o-Y Growth (%) Projections by Component, 2023 to 2033
Figure 37: North America Market Value (US$ Million) Analysis by Deployment, 2018 to 2033
Figure 38: North America Market Value Share (%) and BPS Analysis by Deployment, 2023 to 2033
Figure 39: North America Market Y-o-Y Growth (%) Projections by Deployment, 2023 to 2033
Figure 40: North America Market Value (US$ Million) Analysis by Organization Size, 2018 to 2033
Figure 41: North America Market Value Share (%) and BPS Analysis by Organization Size, 2023 to 2033
Figure 42: North America Market Y-o-Y Growth (%) Projections by Organization Size, 2023 to 2033
Figure 43: North America Market Value (US$ Million) Analysis by End-user, 2018 to 2033
Figure 44: North America Market Value Share (%) and BPS Analysis by End-user, 2023 to 2033
Figure 45: North America Market Y-o-Y Growth (%) Projections by End-user, 2023 to 2033
Figure 46: North America Market Attractiveness by Component, 2023 to 2033
Figure 47: North America Market Attractiveness by Deployment, 2023 to 2033
Figure 48: North America Market Attractiveness by Organization Size, 2023 to 2033
Figure 49: North America Market Attractiveness by End-user, 2023 to 2033
Figure 50: North America Market Attractiveness by Country, 2023 to 2033
Figure 51: Latin America Market Value (US$ Million) by Component, 2023 to 2033
Figure 52: Latin America Market Value (US$ Million) by Deployment, 2023 to 2033
Figure 53: Latin America Market Value (US$ Million) by Organization Size, 2023 to 2033
Figure 54: Latin America Market Value (US$ Million) by End-user, 2023 to 2033
Figure 55: Latin America Market Value (US$ Million) by Country, 2023 to 2033
Figure 56: Latin America Market Value (US$ Million) Analysis by Country, 2018 to 2033
Figure 57: Latin America Market Value Share (%) and BPS Analysis by Country, 2023 to 2033
Figure 58: Latin America Market Y-o-Y Growth (%) Projections by Country, 2023 to 2033
Figure 59: Latin America Market Value (US$ Million) Analysis by Component, 2018 to 2033
Figure 60: Latin America Market Value Share (%) and BPS Analysis by Component, 2023 to 2033
Figure 61: Latin America Market Y-o-Y Growth (%) Projections by Component, 2023 to 2033
Figure 62: Latin America Market Value (US$ Million) Analysis by Deployment, 2018 to 2033
Figure 63: Latin America Market Value Share (%) and BPS Analysis by Deployment, 2023 to 2033
Figure 64: Latin America Market Y-o-Y Growth (%) Projections by Deployment, 2023 to 2033
Figure 65: Latin America Market Value (US$ Million) Analysis by Organization Size, 2018 to 2033
Figure 66: Latin America Market Value Share (%) and BPS Analysis by Organization Size, 2023 to 2033
Figure 67: Latin America Market Y-o-Y Growth (%) Projections by Organization Size, 2023 to 2033
Figure 68: Latin America Market Value (US$ Million) Analysis by End-user, 2018 to 2033
Figure 69: Latin America Market Value Share (%) and BPS Analysis by End-user, 2023 to 2033
Figure 70: Latin America Market Y-o-Y Growth (%) Projections by End-user, 2023 to 2033
Figure 71: Latin America Market Attractiveness by Component, 2023 to 2033
Figure 72: Latin America Market Attractiveness by Deployment, 2023 to 2033
Figure 73: Latin America Market Attractiveness by Organization Size, 2023 to 2033
Figure 74: Latin America Market Attractiveness by End-user, 2023 to 2033
Figure 75: Latin America Market Attractiveness by Country, 2023 to 2033
Figure 76: Europe Market Value (US$ Million) by Component, 2023 to 2033
Figure 77: Europe Market Value (US$ Million) by Deployment, 2023 to 2033
Figure 78: Europe Market Value (US$ Million) by Organization Size, 2023 to 2033
Figure 79: Europe Market Value (US$ Million) by End-user, 2023 to 2033
Figure 80: Europe Market Value (US$ Million) by Country, 2023 to 2033
Figure 81: Europe Market Value (US$ Million) Analysis by Country, 2018 to 2033
Figure 82: Europe Market Value Share (%) and BPS Analysis by Country, 2023 to 2033
Figure 83: Europe Market Y-o-Y Growth (%) Projections by Country, 2023 to 2033
Figure 84: Europe Market Value (US$ Million) Analysis by Component, 2018 to 2033
Figure 85: Europe Market Value Share (%) and BPS Analysis by Component, 2023 to 2033
Figure 86: Europe Market Y-o-Y Growth (%) Projections by Component, 2023 to 2033
Figure 87: Europe Market Value (US$ Million) Analysis by Deployment, 2018 to 2033
Figure 88: Europe Market Value Share (%) and BPS Analysis by Deployment, 2023 to 2033
Figure 89: Europe Market Y-o-Y Growth (%) Projections by Deployment, 2023 to 2033
Figure 90: Europe Market Value (US$ Million) Analysis by Organization Size, 2018 to 2033
Figure 91: Europe Market Value Share (%) and BPS Analysis by Organization Size, 2023 to 2033
Figure 92: Europe Market Y-o-Y Growth (%) Projections by Organization Size, 2023 to 2033
Figure 93: Europe Market Value (US$ Million) Analysis by End-user, 2018 to 2033
Figure 94: Europe Market Value Share (%) and BPS Analysis by End-user, 2023 to 2033
Figure 95: Europe Market Y-o-Y Growth (%) Projections by End-user, 2023 to 2033
Figure 96: Europe Market Attractiveness by Component, 2023 to 2033
Figure 97: Europe Market Attractiveness by Deployment, 2023 to 2033
Figure 98: Europe Market Attractiveness by Organization Size, 2023 to 2033
Figure 99: Europe Market Attractiveness by End-user, 2023 to 2033
Figure 100: Europe Market Attractiveness by Country, 2023 to 2033
Figure 101: South Asia Market Value (US$ Million) by Component, 2023 to 2033
Figure 102: South Asia Market Value (US$ Million) by Deployment, 2023 to 2033
Figure 103: South Asia Market Value (US$ Million) by Organization Size, 2023 to 2033
Figure 104: South Asia Market Value (US$ Million) by End-user, 2023 to 2033
Figure 105: South Asia Market Value (US$ Million) by Country, 2023 to 2033
Figure 106: South Asia Market Value (US$ Million) Analysis by Country, 2018 to 2033
Figure 107: South Asia Market Value Share (%) and BPS Analysis by Country, 2023 to 2033
Figure 108: South Asia Market Y-o-Y Growth (%) Projections by Country, 2023 to 2033
Figure 109: South Asia Market Value (US$ Million) Analysis by Component, 2018 to 2033
Figure 110: South Asia Market Value Share (%) and BPS Analysis by Component, 2023 to 2033
Figure 111: South Asia Market Y-o-Y Growth (%) Projections by Component, 2023 to 2033
Figure 112: South Asia Market Value (US$ Million) Analysis by Deployment, 2018 to 2033
Figure 113: South Asia Market Value Share (%) and BPS Analysis by Deployment, 2023 to 2033
Figure 114: South Asia Market Y-o-Y Growth (%) Projections by Deployment, 2023 to 2033
Figure 115: South Asia Market Value (US$ Million) Analysis by Organization Size, 2018 to 2033
Figure 116: South Asia Market Value Share (%) and BPS Analysis by Organization Size, 2023 to 2033
Figure 117: South Asia Market Y-o-Y Growth (%) Projections by Organization Size, 2023 to 2033
Figure 118: South Asia Market Value (US$ Million) Analysis by End-user, 2018 to 2033
Figure 119: South Asia Market Value Share (%) and BPS Analysis by End-user, 2023 to 2033
Figure 120: South Asia Market Y-o-Y Growth (%) Projections by End-user, 2023 to 2033
Figure 121: South Asia Market Attractiveness by Component, 2023 to 2033
Figure 122: South Asia Market Attractiveness by Deployment, 2023 to 2033
Figure 123: South Asia Market Attractiveness by Organization Size, 2023 to 2033
Figure 124: South Asia Market Attractiveness by End-user, 2023 to 2033
Figure 125: South Asia Market Attractiveness by Country, 2023 to 2033
Figure 126: East Asia Market Value (US$ Million) by Component, 2023 to 2033
Figure 127: East Asia Market Value (US$ Million) by Deployment, 2023 to 2033
Figure 128: East Asia Market Value (US$ Million) by Organization Size, 2023 to 2033
Figure 129: East Asia Market Value (US$ Million) by End-user, 2023 to 2033
Figure 130: East Asia Market Value (US$ Million) by Country, 2023 to 2033
Figure 131: East Asia Market Value (US$ Million) Analysis by Country, 2018 to 2033
Figure 132: East Asia Market Value Share (%) and BPS Analysis by Country, 2023 to 2033
Figure 133: East Asia Market Y-o-Y Growth (%) Projections by Country, 2023 to 2033
Figure 134: East Asia Market Value (US$ Million) Analysis by Component, 2018 to 2033
Figure 135: East Asia Market Value Share (%) and BPS Analysis by Component, 2023 to 2033
Figure 136: East Asia Market Y-o-Y Growth (%) Projections by Component, 2023 to 2033
Figure 137: East Asia Market Value (US$ Million) Analysis by Deployment, 2018 to 2033
Figure 138: East Asia Market Value Share (%) and BPS Analysis by Deployment, 2023 to 2033
Figure 139: East Asia Market Y-o-Y Growth (%) Projections by Deployment, 2023 to 2033
Figure 140: East Asia Market Value (US$ Million) Analysis by Organization Size, 2018 to 2033
Figure 141: East Asia Market Value Share (%) and BPS Analysis by Organization Size, 2023 to 2033
Figure 142: East Asia Market Y-o-Y Growth (%) Projections by Organization Size, 2023 to 2033
Figure 143: East Asia Market Value (US$ Million) Analysis by End-user, 2018 to 2033
Figure 144: East Asia Market Value Share (%) and BPS Analysis by End-user, 2023 to 2033
Figure 145: East Asia Market Y-o-Y Growth (%) Projections by End-user, 2023 to 2033
Figure 146: East Asia Market Attractiveness by Component, 2023 to 2033
Figure 147: East Asia Market Attractiveness by Deployment, 2023 to 2033
Figure 148: East Asia Market Attractiveness by Organization Size, 2023 to 2033
Figure 149: East Asia Market Attractiveness by End-user, 2023 to 2033
Figure 150: East Asia Market Attractiveness by Country, 2023 to 2033
Figure 151: Oceania Market Value (US$ Million) by Component, 2023 to 2033
Figure 152: Oceania Market Value (US$ Million) by Deployment, 2023 to 2033
Figure 153: Oceania Market Value (US$ Million) by Organization Size, 2023 to 2033
Figure 154: Oceania Market Value (US$ Million) by End-user, 2023 to 2033
Figure 155: Oceania Market Value (US$ Million) by Country, 2023 to 2033
Figure 156: Oceania Market Value (US$ Million) Analysis by Country, 2018 to 2033
Figure 157: Oceania Market Value Share (%) and BPS Analysis by Country, 2023 to 2033
Figure 158: Oceania Market Y-o-Y Growth (%) Projections by Country, 2023 to 2033
Figure 159: Oceania Market Value (US$ Million) Analysis by Component, 2018 to 2033
Figure 160: Oceania Market Value Share (%) and BPS Analysis by Component, 2023 to 2033
Figure 161: Oceania Market Y-o-Y Growth (%) Projections by Component, 2023 to 2033
Figure 162: Oceania Market Value (US$ Million) Analysis by Deployment, 2018 to 2033
Figure 163: Oceania Market Value Share (%) and BPS Analysis by Deployment, 2023 to 2033
Figure 164: Oceania Market Y-o-Y Growth (%) Projections by Deployment, 2023 to 2033
Figure 165: Oceania Market Value (US$ Million) Analysis by Organization Size, 2018 to 2033
Figure 166: Oceania Market Value Share (%) and BPS Analysis by Organization Size, 2023 to 2033
Figure 167: Oceania Market Y-o-Y Growth (%) Projections by Organization Size, 2023 to 2033
Figure 168: Oceania Market Value (US$ Million) Analysis by End-user, 2018 to 2033
Figure 169: Oceania Market Value Share (%) and BPS Analysis by End-user, 2023 to 2033
Figure 170: Oceania Market Y-o-Y Growth (%) Projections by End-user, 2023 to 2033
Figure 171: Oceania Market Attractiveness by Component, 2023 to 2033
Figure 172: Oceania Market Attractiveness by Deployment, 2023 to 2033
Figure 173: Oceania Market Attractiveness by Organization Size, 2023 to 2033
Figure 174: Oceania Market Attractiveness by End-user, 2023 to 2033
Figure 175: Oceania Market Attractiveness by Country, 2023 to 2033
Figure 176: MEA Market Value (US$ Million) by Component, 2023 to 2033
Figure 177: MEA Market Value (US$ Million) by Deployment, 2023 to 2033
Figure 178: MEA Market Value (US$ Million) by Organization Size, 2023 to 2033
Figure 179: MEA Market Value (US$ Million) by End-user, 2023 to 2033
Figure 180: MEA Market Value (US$ Million) by Country, 2023 to 2033
Figure 181: MEA Market Value (US$ Million) Analysis by Country, 2018 to 2033
Figure 182: MEA Market Value Share (%) and BPS Analysis by Country, 2023 to 2033
Figure 183: MEA Market Y-o-Y Growth (%) Projections by Country, 2023 to 2033
Figure 184: MEA Market Value (US$ Million) Analysis by Component, 2018 to 2033
Figure 185: MEA Market Value Share (%) and BPS Analysis by Component, 2023 to 2033
Figure 186: MEA Market Y-o-Y Growth (%) Projections by Component, 2023 to 2033
Figure 187: MEA Market Value (US$ Million) Analysis by Deployment, 2018 to 2033
Figure 188: MEA Market Value Share (%) and BPS Analysis by Deployment, 2023 to 2033
Figure 189: MEA Market Y-o-Y Growth (%) Projections by Deployment, 2023 to 2033
Figure 190: MEA Market Value (US$ Million) Analysis by Organization Size, 2018 to 2033
Figure 191: MEA Market Value Share (%) and BPS Analysis by Organization Size, 2023 to 2033
Figure 192: MEA Market Y-o-Y Growth (%) Projections by Organization Size, 2023 to 2033
Figure 193: MEA Market Value (US$ Million) Analysis by End-user, 2018 to 2033
Figure 194: MEA Market Value Share (%) and BPS Analysis by End-user, 2023 to 2033
Figure 195: MEA Market Y-o-Y Growth (%) Projections by End-user, 2023 to 2033
Figure 196: MEA Market Attractiveness by Component, 2023 to 2033
Figure 197: MEA Market Attractiveness by Deployment, 2023 to 2033
Figure 198: MEA Market Attractiveness by Organization Size, 2023 to 2033
Figure 199: MEA Market Attractiveness by End-user, 2023 to 2033
Figure 200: MEA Market Attractiveness by Country, 2023 to 2033
The market is anticipated to expand at a 10.2% CAGR from 2023 to 2033.
The market in 2023 totals USD 4.3 billion.
North America is expected to be a lucrative market.
Concerns regarding personal data limit the market growth.
From 2018 to 2022, the market rose at a 9.9% CAGR.
Explore Similar Insights
Thank you!
You will receive an email from our Business Development Manager. Please be sure to check your SPAM/JUNK folder too.