Evidence Collection Tubes Market Size and Share Forecast Outlook 2025 to 2035

The Evidence Collection Tubes Market is estimated to be valued at USD 15.0 billion in 2025 and is projected to reach USD 66.4 billion by 2035, registering a compound annual growth rate (CAGR) of 16.0% over the forecast period.
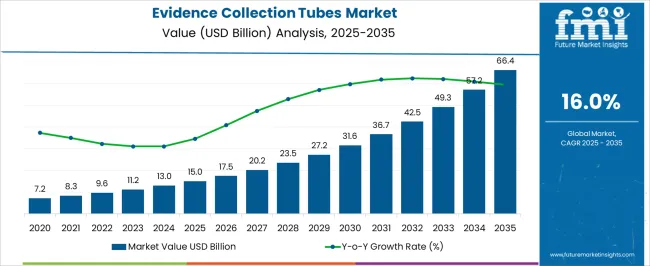
Quick Stats for Evidence Collection Tubes Market

  • Evidence Collection Tubes Market Value (2025): USD 15.0 billion
  • Evidence Collection Tubes Market Forecast Value (2035): USD 66.4 billion
  • Evidence Collection Tubes Market Forecast CAGR: 16.0%
  • Leading Segment in Evidence Collection Tubes Market in 2025: Plasma Separation Tubes (31.5%)
  • Key Growth Regions in Evidence Collection Tubes Market: North America, Asia-Pacific, Europe
  • Top Key Players in Evidence Collection Tubes Market: Thermo Fisher Scientific Inc., BD (Becton, Dickinson and Company), Greiner Bio-One International GmbH, Cardinal Health, VWR International LLC, Medtronic PLC, LabCorp, SteriPack, Kangjian Medic
Evidence Collection Tubes Market Market Value Analysis

Evidence Collection Tubes Market Key Takeaways

Metric Value
Evidence Collection Tubes Market Estimated Value in (2025 E) USD 15.0 billion
Evidence Collection Tubes Market Forecast Value in (2035 F) USD 66.4 billion
Forecast CAGR (2025 to 2035) 16.0%

Why is the Evidence Collection Tubes Market Growing?

The evidence collection tubes market is experiencing steady growth, driven by the increasing demand for reliable and efficient biological sample management in clinical, diagnostic, and research settings. The market is supported by rising healthcare infrastructure investments, particularly in hospitals and diagnostic laboratories, where precise sample collection and preservation are critical for accurate testing.

Technological advancements in tube materials, sealing mechanisms, and anticoagulant formulations are enhancing the stability and integrity of collected specimens, thereby improving test accuracy and reducing contamination risks. The adoption of automated handling and high-throughput processing systems is further encouraging the use of specialized collection tubes.

Additionally, increasing awareness of laboratory safety standards and compliance with regulatory guidelines are influencing procurement decisions, favoring high-quality evidence collection solutions As the global healthcare sector continues to expand and laboratory services grow, the market is positioned for sustained growth, with manufacturers focusing on innovation, product diversification, and distribution expansion to meet the evolving needs of hospitals, clinical laboratories, and research facilities worldwide.

Segmental Analysis

The evidence collection tubes market is segmented by product, application, and geographic regions. By product, evidence collection tubes market is divided into Plasma Separation Tubes, Heparin Tubes, Serum Separating Tubes, EDTA Tubes, Rapid Serum Tubes, and Others. In terms of application, evidence collection tubes market is classified into Hospitals, Blood Testing Centers, and Others. Regionally, the evidence collection tubes industry is classified into North America, Latin America, Western Europe, Eastern Europe, Balkan & Baltic Countries, Russia & Belarus, Central Asia, East Asia, South Asia & Pacific, and the Middle East & Africa.
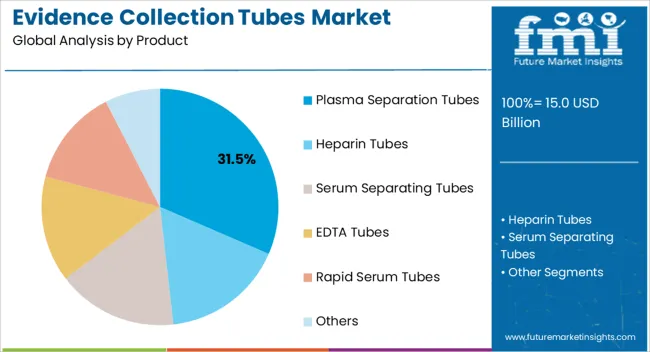
Insights into the Plasma Separation Tubes Product Segment

Evidence Collection Tubes Market Analysis By Product

The plasma separation tubes segment is projected to hold 31.5% of the evidence collection tubes market revenue share in 2025, making it the leading product type. Its dominance is being supported by the ability to efficiently separate plasma from whole blood, ensuring sample integrity for a wide range of diagnostic tests, including biochemistry and immunology assays. The segment benefits from increased demand in hospitals and laboratories that require high-precision, contamination-free samples to improve test reliability.

Advanced tube designs with gel barriers or anticoagulant coatings are enhancing separation efficiency and sample stability, reducing pre-analytical errors and improving overall laboratory workflow. Growing adoption of automated blood collection and processing systems is further reinforcing the segment’s position by allowing seamless integration into high-throughput environments.

Manufacturers focusing on material innovation, such as low-hemolysis plastics and standardized volume formats, are ensuring consistent performance and reliability The combination of technological advancements, operational efficiency, and widespread applicability is sustaining the growth of plasma separation tubes as the preferred choice in clinical and research settings.
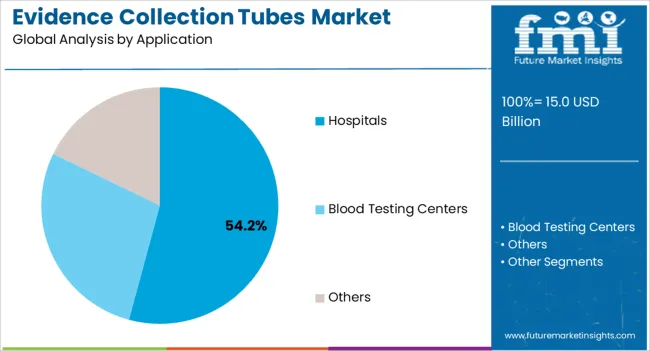
Insights into the Hospitals Application Segment

Evidence Collection Tubes Market Analysis By Application

The hospitals application segment is expected to account for 54.2% of the evidence collection tubes market revenue share in 2025, establishing it as the leading end-use category. Hospitals are increasingly adopting specialized collection tubes due to the high volume of patient samples processed daily, which requires reliable and accurate sample management solutions. The segment’s growth is supported by expanding hospital infrastructure, rising patient admissions, and the growing complexity of diagnostic testing in modern healthcare settings.

Evidence collection tubes provide operational efficiency by ensuring sample integrity, reducing processing errors, and facilitating rapid testing turnaround times. Regulatory compliance and stringent laboratory standards in hospitals are further driving the preference for high-quality, pre-validated collection tubes.

The integration of automated sample handling and testing systems in hospital laboratories has also promoted the adoption of standardized tube formats that are compatible with automated analyzers As hospitals continue to expand services and prioritize laboratory efficiency, the demand for evidence collection tubes is expected to remain strong, reinforcing their market leadership in the healthcare sector.

Market Overview

Evidence Collection Tubes Market Overview

In any kind of crime or untoward incident, evidence from the scene can go a long way in helping law enforcement agencies understand and frame a coherent picture of what transpired. This can include fingerprints, saliva, blood, semen samples, tissues under human fingernails, hair fibres etc. which is then scientifically examined in a forensic laboratory.

It can be critical in linking a suspect or perpetrator to a particular crime scene or victim. (In case of physical or sexual assault). This evidence must be handled with the utmost care as it can be easily contaminated with improper or direct handling. Ensuring that is the responsibility of the evidence collection tube market.

It is said by law enforcement agencies that “A zero crime rate is a hypothetical situation.” Hence, there would also be some form of crime in every country, a highly efficient police force and incorruptible government notwithstanding. That is why the future of the evidence collection tubes market looks very promising indeed.
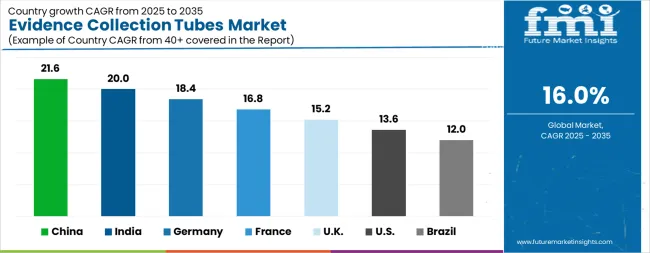
Analysis of Evidence Collection Tubes Market By Key Countries

Evidence Collection Tubes Market Cagr Analysis By Country
Country CAGR
China 21.6%
India 20.0%
Germany 18.4%
France 16.8%
UK 15.2%
USA 13.6%
Brazil 12.0%

Country-wise Analysis

The Evidence Collection Tubes Market is expected to register a CAGR of 16.0% during the forecast period, exhibiting varied country level momentum. China leads with the highest CAGR of 21.6%, followed by India at 20.0%. Developed markets such as Germany, France, and the UK continue to expand steadily, while the USA is likely to grow at consistent rates. Brazil posts the lowest CAGR at 12.0%, yet still underscores a broadly positive trajectory for the global Evidence Collection Tubes Market. In 2024, Germany held a dominant revenue in the Western Europe market and is expected to grow with a CAGR of 18.4%. The USA Evidence Collection Tubes Market is estimated to be valued at USD 5.2 billion in 2025 and is anticipated to reach a valuation of USD 18.5 billion by 2035. Sales are projected to rise at a CAGR of 13.6% over the forecast period between 2025 and 2035. While Japan and South Korea markets are estimated to be valued at USD 746.0 million and USD 443.8 million respectively in 2025.
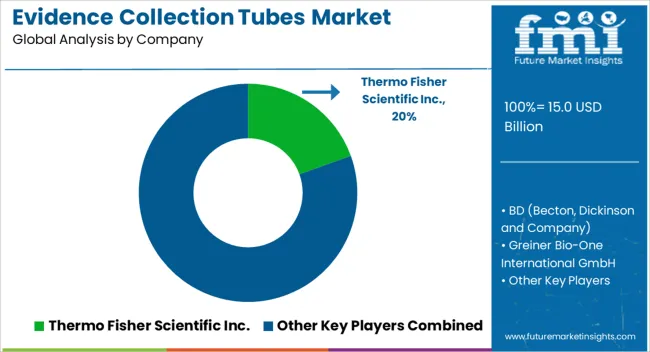
Key Players in the Evidence Collection Tubes Market

Evidence Collection Tubes Market Analysis By Company

  • Thermo Fisher Scientific Inc.
  • BD (Becton, Dickinson and Company)
  • Greiner Bio-One International GmbH
  • Cardinal Health
  • VWR International LLC
  • Medtronic PLC
  • LabCorp
  • SteriPack
  • Kangjian Medic

Scope of the Report

Item Value
Quantitative Units USD 15.0 Billion
Product Plasma Separation Tubes, Heparin Tubes, Serum Separating Tubes, EDTA Tubes, Rapid Serum Tubes, and Others
Application Hospitals, Blood Testing Centers, and Others
Regions Covered North America, Europe, Asia-Pacific, Latin America, Middle East & Africa
Country Covered United States, Canada, Germany, France, United Kingdom, China, Japan, India, Brazil, South Africa
Key Companies Profiled Thermo Fisher Scientific Inc., BD (Becton, Dickinson and Company), Greiner Bio-One International GmbH, Cardinal Health, VWR International LLC, Medtronic PLC, LabCorp, SteriPack, and Kangjian Medic

Evidence Collection Tubes Market by Segments

Product:

  • Plasma Separation Tubes
  • Heparin Tubes
  • Serum Separating Tubes
  • EDTA Tubes
  • Rapid Serum Tubes
  • Others

Application:

  • Hospitals
  • Blood Testing Centers
  • Others

Region:

  • North America
    • USA
    • Canada
    • Mexico
  • Latin America
    • Brazil
    • Chile
    • Rest of Latin America
  • Western Europe
    • Germany
    • UK
    • Italy
    • Spain
    • France
    • Nordic
    • BENELUX
    • Rest of Western Europe
  • Eastern Europe
    • Russia
    • Poland
    • Hungary
    • Balkan & Baltic
    • Rest of Eastern Europe
  • East Asia
    • China
    • Japan
    • South Korea
  • South Asia and Pacific
    • India
    • ASEAN
    • Australia & New Zealand
    • Rest of South Asia and Pacific
  • Middle East & Africa
    • Kingdom of Saudi Arabia
    • Other GCC Countries
    • Turkiye
    • South Africa
    • Other African Union
    • Rest of Middle East & Africa

Table of Content

  1. Executive Summary
    • Global Market Outlook
    • Demand-side Trends
    • Supply-side Trends
    • Technology Roadmap Analysis
    • Analysis and Recommendations
  2. Market Overview
    • Market Coverage / Taxonomy
    • Market Definition / Scope / Limitations
  3. Market Background
    • Market Dynamics
      • Drivers
      • Restraints
      • Opportunity
      • Trends
    • Scenario Forecast
      • Demand in Optimistic Scenario
      • Demand in Likely Scenario
      • Demand in Conservative Scenario
    • Opportunity Map Analysis
    • Product Life Cycle Analysis
    • Supply Chain Analysis
    • Investment Feasibility Matrix
    • Value Chain Analysis
    • PESTLE and Porter’s Analysis
    • Regulatory Landscape
    • Regional Parent Market Outlook
    • Production and Consumption Statistics
    • Import and Export Statistics
  4. Global Market Analysis 2020 to 2024 and Forecast, 2025 to 2035
    • Historical Market Size Value (USD Million) Analysis, 2020 to 2024
    • Current and Future Market Size Value (USD Million) Projections, 2025 to 2035
      • Y-o-Y Growth Trend Analysis
      • Absolute $ Opportunity Analysis
  5. Global Market Pricing Analysis 2020 to 2024 and Forecast 2025 to 2035
  6. Global Market Analysis 2020 to 2024 and Forecast 2025 to 2035, By Product
    • Introduction / Key Findings
    • Historical Market Size Value (USD Million) Analysis By Product , 2020 to 2024
    • Current and Future Market Size Value (USD Million) Analysis and Forecast By Product , 2025 to 2035
      • Plasma Separation Tubes
      • Heparin Tubes
      • Serum Separating Tubes
      • EDTA Tubes
      • Rapid Serum Tubes
      • Others
    • Y-o-Y Growth Trend Analysis By Product , 2020 to 2024
    • Absolute $ Opportunity Analysis By Product , 2025 to 2035
  7. Global Market Analysis 2020 to 2024 and Forecast 2025 to 2035, By Application
    • Introduction / Key Findings
    • Historical Market Size Value (USD Million) Analysis By Application, 2020 to 2024
    • Current and Future Market Size Value (USD Million) Analysis and Forecast By Application, 2025 to 2035
      • Hospitals
      • Blood Testing Centers
      • Others
    • Y-o-Y Growth Trend Analysis By Application, 2020 to 2024
    • Absolute $ Opportunity Analysis By Application, 2025 to 2035
  8. Global Market Analysis 2020 to 2024 and Forecast 2025 to 2035, By Region
    • Introduction
    • Historical Market Size Value (USD Million) Analysis By Region, 2020 to 2024
    • Current Market Size Value (USD Million) Analysis and Forecast By Region, 2025 to 2035
      • North America
      • Latin America
      • Western Europe
      • Eastern Europe
      • East Asia
      • South Asia and Pacific
      • Middle East & Africa
    • Market Attractiveness Analysis By Region
  9. North America Market Analysis 2020 to 2024 and Forecast 2025 to 2035, By Country
    • Historical Market Size Value (USD Million) Trend Analysis By Market Taxonomy, 2020 to 2024
    • Market Size Value (USD Million) Forecast By Market Taxonomy, 2025 to 2035
      • By Country
        • USA
        • Canada
        • Mexico
      • By Product
      • By Application
    • Market Attractiveness Analysis
      • By Country
      • By Product
      • By Application
    • Key Takeaways
  10. Latin America Market Analysis 2020 to 2024 and Forecast 2025 to 2035, By Country
    • Historical Market Size Value (USD Million) Trend Analysis By Market Taxonomy, 2020 to 2024
    • Market Size Value (USD Million) Forecast By Market Taxonomy, 2025 to 2035
      • By Country
        • Brazil
        • Chile
        • Rest of Latin America
      • By Product
      • By Application
    • Market Attractiveness Analysis
      • By Country
      • By Product
      • By Application
    • Key Takeaways
  11. Western Europe Market Analysis 2020 to 2024 and Forecast 2025 to 2035, By Country
    • Historical Market Size Value (USD Million) Trend Analysis By Market Taxonomy, 2020 to 2024
    • Market Size Value (USD Million) Forecast By Market Taxonomy, 2025 to 2035
      • By Country
        • Germany
        • UK
        • Italy
        • Spain
        • France
        • Nordic
        • BENELUX
        • Rest of Western Europe
      • By Product
      • By Application
    • Market Attractiveness Analysis
      • By Country
      • By Product
      • By Application
    • Key Takeaways
  12. Eastern Europe Market Analysis 2020 to 2024 and Forecast 2025 to 2035, By Country
    • Historical Market Size Value (USD Million) Trend Analysis By Market Taxonomy, 2020 to 2024
    • Market Size Value (USD Million) Forecast By Market Taxonomy, 2025 to 2035
      • By Country
        • Russia
        • Poland
        • Hungary
        • Balkan & Baltic
        • Rest of Eastern Europe
      • By Product
      • By Application
    • Market Attractiveness Analysis
      • By Country
      • By Product
      • By Application
    • Key Takeaways
  13. East Asia Market Analysis 2020 to 2024 and Forecast 2025 to 2035, By Country
    • Historical Market Size Value (USD Million) Trend Analysis By Market Taxonomy, 2020 to 2024
    • Market Size Value (USD Million) Forecast By Market Taxonomy, 2025 to 2035
      • By Country
        • China
        • Japan
        • South Korea
      • By Product
      • By Application
    • Market Attractiveness Analysis
      • By Country
      • By Product
      • By Application
    • Key Takeaways
  14. South Asia and Pacific Market Analysis 2020 to 2024 and Forecast 2025 to 2035, By Country
    • Historical Market Size Value (USD Million) Trend Analysis By Market Taxonomy, 2020 to 2024
    • Market Size Value (USD Million) Forecast By Market Taxonomy, 2025 to 2035
      • By Country
        • India
        • ASEAN
        • Australia & New Zealand
        • Rest of South Asia and Pacific
      • By Product
      • By Application
    • Market Attractiveness Analysis
      • By Country
      • By Product
      • By Application
    • Key Takeaways
  15. Middle East & Africa Market Analysis 2020 to 2024 and Forecast 2025 to 2035, By Country
    • Historical Market Size Value (USD Million) Trend Analysis By Market Taxonomy, 2020 to 2024
    • Market Size Value (USD Million) Forecast By Market Taxonomy, 2025 to 2035
      • By Country
        • Kingdom of Saudi Arabia
        • Other GCC Countries
        • Turkiye
        • South Africa
        • Other African Union
        • Rest of Middle East & Africa
      • By Product
      • By Application
    • Market Attractiveness Analysis
      • By Country
      • By Product
      • By Application
    • Key Takeaways
  16. Key Countries Market Analysis
    • USA
      • Pricing Analysis
      • Market Share Analysis, 2024
        • By Product
        • By Application
    • Canada
      • Pricing Analysis
      • Market Share Analysis, 2024
        • By Product
        • By Application
    • Mexico
      • Pricing Analysis
      • Market Share Analysis, 2024
        • By Product
        • By Application
    • Brazil
      • Pricing Analysis
      • Market Share Analysis, 2024
        • By Product
        • By Application
    • Chile
      • Pricing Analysis
      • Market Share Analysis, 2024
        • By Product
        • By Application
    • Germany
      • Pricing Analysis
      • Market Share Analysis, 2024
        • By Product
        • By Application
    • UK
      • Pricing Analysis
      • Market Share Analysis, 2024
        • By Product
        • By Application
    • Italy
      • Pricing Analysis
      • Market Share Analysis, 2024
        • By Product
        • By Application
    • Spain
      • Pricing Analysis
      • Market Share Analysis, 2024
        • By Product
        • By Application
    • France
      • Pricing Analysis
      • Market Share Analysis, 2024
        • By Product
        • By Application
    • India
      • Pricing Analysis
      • Market Share Analysis, 2024
        • By Product
        • By Application
    • ASEAN
      • Pricing Analysis
      • Market Share Analysis, 2024
        • By Product
        • By Application
    • Australia & New Zealand
      • Pricing Analysis
      • Market Share Analysis, 2024
        • By Product
        • By Application
    • China
      • Pricing Analysis
      • Market Share Analysis, 2024
        • By Product
        • By Application
    • Japan
      • Pricing Analysis
      • Market Share Analysis, 2024
        • By Product
        • By Application
    • South Korea
      • Pricing Analysis
      • Market Share Analysis, 2024
        • By Product
        • By Application
    • Russia
      • Pricing Analysis
      • Market Share Analysis, 2024
        • By Product
        • By Application
    • Poland
      • Pricing Analysis
      • Market Share Analysis, 2024
        • By Product
        • By Application
    • Hungary
      • Pricing Analysis
      • Market Share Analysis, 2024
        • By Product
        • By Application
    • Kingdom of Saudi Arabia
      • Pricing Analysis
      • Market Share Analysis, 2024
        • By Product
        • By Application
    • Turkiye
      • Pricing Analysis
      • Market Share Analysis, 2024
        • By Product
        • By Application
    • South Africa
      • Pricing Analysis
      • Market Share Analysis, 2024
        • By Product
        • By Application
  17. Market Structure Analysis
    • Competition Dashboard
    • Competition Benchmarking
    • Market Share Analysis of Top Players
      • By Regional
      • By Product
      • By Application
  18. Competition Analysis
    • Competition Deep Dive
      • Thermo Fisher Scientific Inc.
        • Overview
        • Product Portfolio
        • Profitability by Market Segments (Product/Age /Sales Channel/Region)
        • Sales Footprint
        • Strategy Overview
          • Marketing Strategy
          • Product Strategy
          • Channel Strategy
      • BD (Becton, Dickinson and Company)
      • Greiner Bio-One International GmbH
      • Cardinal Health
      • VWR International LLC
      • Medtronic PLC
      • LabCorp
      • SteriPack
      • Kangjian Medic
  19. Assumptions & Acronyms Used
  20. Research Methodology

List of Tables

  • Table 1: Global Market Value (USD Million) Forecast by Region, 2020-2035
  • Table 2: Global Market Value (USD Million) Forecast by Product , 2020-2035
  • Table 3: Global Market Value (USD Million) Forecast by Application, 2020-2035
  • Table 4: North America Market Value (USD Million) Forecast by Country, 2020-2035
  • Table 5: North America Market Value (USD Million) Forecast by Product , 2020-2035
  • Table 6: North America Market Value (USD Million) Forecast by Application, 2020-2035
  • Table 7: Latin America Market Value (USD Million) Forecast by Country, 2020-2035
  • Table 8: Latin America Market Value (USD Million) Forecast by Product , 2020-2035
  • Table 9: Latin America Market Value (USD Million) Forecast by Application, 2020-2035
  • Table 10: Western Europe Market Value (USD Million) Forecast by Country, 2020-2035
  • Table 11: Western Europe Market Value (USD Million) Forecast by Product , 2020-2035
  • Table 12: Western Europe Market Value (USD Million) Forecast by Application, 2020-2035
  • Table 13: Eastern Europe Market Value (USD Million) Forecast by Country, 2020-2035
  • Table 14: Eastern Europe Market Value (USD Million) Forecast by Product , 2020-2035
  • Table 15: Eastern Europe Market Value (USD Million) Forecast by Application, 2020-2035
  • Table 16: East Asia Market Value (USD Million) Forecast by Country, 2020-2035
  • Table 17: East Asia Market Value (USD Million) Forecast by Product , 2020-2035
  • Table 18: East Asia Market Value (USD Million) Forecast by Application, 2020-2035
  • Table 19: South Asia and Pacific Market Value (USD Million) Forecast by Country, 2020-2035
  • Table 20: South Asia and Pacific Market Value (USD Million) Forecast by Product , 2020-2035
  • Table 21: South Asia and Pacific Market Value (USD Million) Forecast by Application, 2020-2035
  • Table 22: Middle East & Africa Market Value (USD Million) Forecast by Country, 2020-2035
  • Table 23: Middle East & Africa Market Value (USD Million) Forecast by Product , 2020-2035
  • Table 24: Middle East & Africa Market Value (USD Million) Forecast by Application, 2020-2035

List of Figures

  • Figure 1: Global Market Pricing Analysis
  • Figure 2: Global Market Value (USD Million) Forecast 2020-2035
  • Figure 3: Global Market Value Share and BPS Analysis by Product , 2025 and 2035
  • Figure 4: Global Market Y-o-Y Growth Comparison by Product , 2025-2035
  • Figure 5: Global Market Attractiveness Analysis by Product
  • Figure 6: Global Market Value Share and BPS Analysis by Application, 2025 and 2035
  • Figure 7: Global Market Y-o-Y Growth Comparison by Application, 2025-2035
  • Figure 8: Global Market Attractiveness Analysis by Application
  • Figure 9: Global Market Value (USD Million) Share and BPS Analysis by Region, 2025 and 2035
  • Figure 10: Global Market Y-o-Y Growth Comparison by Region, 2025-2035
  • Figure 11: Global Market Attractiveness Analysis by Region
  • Figure 12: North America Market Incremental Dollar Opportunity, 2025-2035
  • Figure 13: Latin America Market Incremental Dollar Opportunity, 2025-2035
  • Figure 14: Western Europe Market Incremental Dollar Opportunity, 2025-2035
  • Figure 15: Eastern Europe Market Incremental Dollar Opportunity, 2025-2035
  • Figure 16: East Asia Market Incremental Dollar Opportunity, 2025-2035
  • Figure 17: South Asia and Pacific Market Incremental Dollar Opportunity, 2025-2035
  • Figure 18: Middle East & Africa Market Incremental Dollar Opportunity, 2025-2035
  • Figure 19: North America Market Value Share and BPS Analysis by Country, 2025 and 2035
  • Figure 20: North America Market Value Share and BPS Analysis by Product , 2025 and 2035
  • Figure 21: North America Market Y-o-Y Growth Comparison by Product , 2025-2035
  • Figure 22: North America Market Attractiveness Analysis by Product
  • Figure 23: North America Market Value Share and BPS Analysis by Application, 2025 and 2035
  • Figure 24: North America Market Y-o-Y Growth Comparison by Application, 2025-2035
  • Figure 25: North America Market Attractiveness Analysis by Application
  • Figure 26: Latin America Market Value Share and BPS Analysis by Country, 2025 and 2035
  • Figure 27: Latin America Market Value Share and BPS Analysis by Product , 2025 and 2035
  • Figure 28: Latin America Market Y-o-Y Growth Comparison by Product , 2025-2035
  • Figure 29: Latin America Market Attractiveness Analysis by Product
  • Figure 30: Latin America Market Value Share and BPS Analysis by Application, 2025 and 2035
  • Figure 31: Latin America Market Y-o-Y Growth Comparison by Application, 2025-2035
  • Figure 32: Latin America Market Attractiveness Analysis by Application
  • Figure 33: Western Europe Market Value Share and BPS Analysis by Country, 2025 and 2035
  • Figure 34: Western Europe Market Value Share and BPS Analysis by Product , 2025 and 2035
  • Figure 35: Western Europe Market Y-o-Y Growth Comparison by Product , 2025-2035
  • Figure 36: Western Europe Market Attractiveness Analysis by Product
  • Figure 37: Western Europe Market Value Share and BPS Analysis by Application, 2025 and 2035
  • Figure 38: Western Europe Market Y-o-Y Growth Comparison by Application, 2025-2035
  • Figure 39: Western Europe Market Attractiveness Analysis by Application
  • Figure 40: Eastern Europe Market Value Share and BPS Analysis by Country, 2025 and 2035
  • Figure 41: Eastern Europe Market Value Share and BPS Analysis by Product , 2025 and 2035
  • Figure 42: Eastern Europe Market Y-o-Y Growth Comparison by Product , 2025-2035
  • Figure 43: Eastern Europe Market Attractiveness Analysis by Product
  • Figure 44: Eastern Europe Market Value Share and BPS Analysis by Application, 2025 and 2035
  • Figure 45: Eastern Europe Market Y-o-Y Growth Comparison by Application, 2025-2035
  • Figure 46: Eastern Europe Market Attractiveness Analysis by Application
  • Figure 47: East Asia Market Value Share and BPS Analysis by Country, 2025 and 2035
  • Figure 48: East Asia Market Value Share and BPS Analysis by Product , 2025 and 2035
  • Figure 49: East Asia Market Y-o-Y Growth Comparison by Product , 2025-2035
  • Figure 50: East Asia Market Attractiveness Analysis by Product
  • Figure 51: East Asia Market Value Share and BPS Analysis by Application, 2025 and 2035
  • Figure 52: East Asia Market Y-o-Y Growth Comparison by Application, 2025-2035
  • Figure 53: East Asia Market Attractiveness Analysis by Application
  • Figure 54: South Asia and Pacific Market Value Share and BPS Analysis by Country, 2025 and 2035
  • Figure 55: South Asia and Pacific Market Value Share and BPS Analysis by Product , 2025 and 2035
  • Figure 56: South Asia and Pacific Market Y-o-Y Growth Comparison by Product , 2025-2035
  • Figure 57: South Asia and Pacific Market Attractiveness Analysis by Product
  • Figure 58: South Asia and Pacific Market Value Share and BPS Analysis by Application, 2025 and 2035
  • Figure 59: South Asia and Pacific Market Y-o-Y Growth Comparison by Application, 2025-2035
  • Figure 60: South Asia and Pacific Market Attractiveness Analysis by Application
  • Figure 61: Middle East & Africa Market Value Share and BPS Analysis by Country, 2025 and 2035
  • Figure 62: Middle East & Africa Market Value Share and BPS Analysis by Product , 2025 and 2035
  • Figure 63: Middle East & Africa Market Y-o-Y Growth Comparison by Product , 2025-2035
  • Figure 64: Middle East & Africa Market Attractiveness Analysis by Product
  • Figure 65: Middle East & Africa Market Value Share and BPS Analysis by Application, 2025 and 2035
  • Figure 66: Middle East & Africa Market Y-o-Y Growth Comparison by Application, 2025-2035
  • Figure 67: Middle East & Africa Market Attractiveness Analysis by Application
  • Figure 68: Global Market - Tier Structure Analysis
  • Figure 69: Global Market - Company Share Analysis

Frequently Asked Questions

How big is the evidence collection tubes market in 2025?

The global evidence collection tubes market is estimated to be valued at USD 15.0 billion in 2025.

What will be the size of evidence collection tubes market in 2035?

The market size for the evidence collection tubes market is projected to reach USD 66.4 billion by 2035.

How much will be the evidence collection tubes market growth between 2025 and 2035?

The evidence collection tubes market is expected to grow at a 16.0% CAGR between 2025 and 2035.

What are the key product types in the evidence collection tubes market?

The key product types in evidence collection tubes market are plasma separation tubes, heparin tubes, serum separating tubes, edta tubes, rapid serum tubes and others.

Which application segment to contribute significant share in the evidence collection tubes market in 2025?

In terms of application, hospitals segment to command 54.2% share in the evidence collection tubes market in 2025.

Explore Similar Insights

Future Market Insights

Evidence Collection Tubes Market

Chat With MaRIA

Chat With

MaRIA

Hi There, I am MaRIA, Your Market Research Intelligence Assistant. How may I help you?