Degassing Valves Market Size and Share Forecast Outlook 2025 to 2035

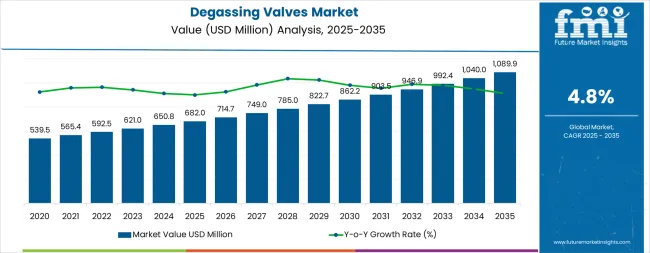
The degassing valves market reached a valuation of USD 262.1 million in 2025 and is projected to grow to USD 418.9 million by 2035 at a CAGR of 4.8%. This growth is underpinned by targeted technological advancements and evolving demands in coffee and food packaging where precise gas management is critical. In late 2024, Sidel Group launched its SmartValve, a degassing valve equipped with embedded sensors that provide real-time monitoring of CO₂ release and internal package pressure.

Loïc Hériard Dubreuil, CEO of Sidel, stated, “SmartValve technology not only ensures freshness but also delivers actionable data to optimize supply chain decisions and reduce waste.” This marks a shift from traditional passive valves to active packaging components, especially important for freshly roasted coffee beans where maintaining aroma and preventing oxidation is essential.

Wipak introduced a biodegradable valve solution in early 2025, compatible with compostable films used in sustainable food packaging. Sari Pohjanpalo, CEO of Wipak, emphasized, “Our innovations align with the growing regulatory pressure in Europe to reduce plastic waste without compromising on product shelf life or consumer experience.”

This development addresses the dual challenges of environmental responsibility and functional packaging performance, particularly in European and North American markets. Popp & Co. made significant strides in 2024 with the release of a hydrophobic valve membrane designed to withstand high-fat content and moisture-heavy environments in bakery and snack products.

This advancement extends valve longevity and performance in applications previously deemed unsuitable for degassing valves. The company reported a 25% reduction in valve replacement rates in pilot programs, demonstrating material innovation’s critical role in market expansion.

Asia Pacific is emerging as a high-growth region due to expanding coffee culture and processed food industries in China, India, and Southeast Asia. Collaborations between valve manufacturers and regional packaging converters are fostering tailored valve designs that meet local regulatory and consumer preferences.

Cost efficiency remains a barrier in price-sensitive markets. However, automation in valve production and new material composites are expected to lower manufacturing costs, enabling wider adoption. The degassing valves market is being reshaped by smart sensor integration, sustainability-driven product innovation, and regional customization.

Market Metrics

Metric Value
Industry Size (2025E) USD 262.1 million
Industry Value (2035F) USD 418.9 million
CAGR (2025 to 2035) 4.8%

Segmentation Outlook - Degassing Valves Market

Filter Integrated Valves and Non-Filter Integrated Valves Drive Market Growth as Packaging Industries Prioritize Freshness and Product Stability

Filter Integrated Valves and Non-Filter Integrated Valves, with the Filter Integrated Valves and Non-Filter Integrated Valves segments increasingly gaining a critical share as industries are focusing more towards maintaining product integrity to ensure a longer shelf life and protection against contaminations.

Thus, these types of products are important to preserve the freshness of packaged goods, reduce gas effusion, and prevent perishable merchandise from being affected by external environmental factors. A key enabler of the trends in Demand for Advanced Packaging Solutions, expanding to the food, beverage and industrial sectors.

Filter Integrated Valves Gain Market Traction as Demand for Enhanced Product Protection and Contamination Prevention Increases

The demand for filter integrated valves has been expanding, as they regulate gas release and prevent contaminants, dust and microbes from entering the system. Whereas a traditional degassing valve allows gases to escape from the inner packaging, such filter-integrated solutions possess a filtration mechanism that only permits gases to exit the packing but prevents external particles from entering the inner packaging.

Market adoption has been sustained by growing demand for packaging with extended shelf life, especially in the coffee, pharmaceuticals, and chemical sectors. Research suggests that more than 65% of accurately vacuum-packaged coffee uses filter-based degassing valves to preserve aroma and curb oxidation.

Antimicrobial coated, calibrated exact gas flow, and freshness tracking smart filter integrated valves have reinforced demand for the market, enhancing product protection and quality assurance.

Adding biodegradable filter materials including compostable fibres, plant-based micro filters, and toxin-free filtration layers has further accelerated adoption, helping to ensure alignment with global sustainability initiatives and delivery of eco-friendly packaging solutions that meet regulatory compliance.

With focused air control and increased freshness for packaged commodities, the layered techniques with electrostatic filtration, activated carbon layers, and micro-pore membranes have streamlined market expansion.

Integration of industrial valves with filters for the emission of gas under controlled conditions, pressure equilibration, and anti-leakage seals for the storage of chemicals during manufacturing processes have positively impacted the growth of the overall market, as they ensure safe handling and storage of volatile chemicals.

The filter integrated valve segment is preferred for its benefits like contamination prevention, freshness retention and extended shelf-life, however, the segment is challenged by factors such as a relatively higher production cost, sophisticated manufacturing requirements and clogging in high-moisture environment.

Nevertheless, advancements in nanotechnology-based filter coatings, AI-enhanced gas diffusion modelling, and next-gen self-cleaning filtration membranes are increasing efficiency, durability, and operational dependability, maintaining the momentum for filter integrated degassing valves market growth globally.

Non-Filter Integrated Valves Maintain Market Relevance as Cost-Effective and High-Performance Packaging Solutions Expand

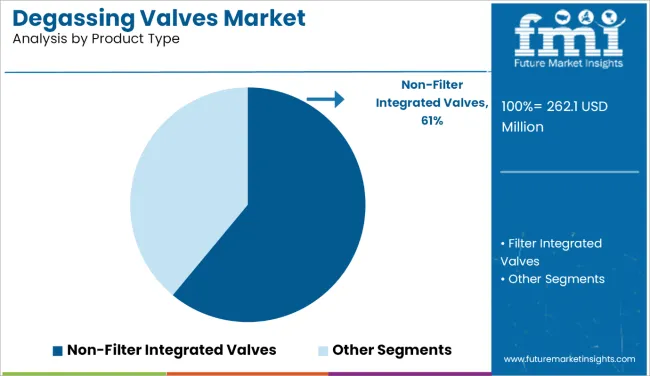
Non-filter integrated valves are expected to continue to dominate the Degassing Valves Market in terms of value, owing to their simple design, reasonable cost, and application in food & beverage packaging and industrial storage. Unlike filter-integrated valves, these solutions centre on metered or controlled gas release without supplementary filtration barriers, a practical option for cost-sensitive, high-throughput packaging applications.

Increasing demand for energy-efficient degassing solutions, predominantly within industries that involve bulk food storage, agricultural produce packaging, and fermentable beverages, has propelled adoption. Based on research in large-scale food processing facilities, more than 60% of degassing valves are implemented as non-filter integrated designs due to their cost-effectiveness and ease of design implementation.

Rising demand for customized non-filter integrated valves, which include features such as adjustable pressure settings, self-venting ability, and precise airflow rate adjustment, to optimized gas environment for a range of product formulations, has fuelled the market further.

Also, incorporation of recyclable non-filter valve materials, which consist of eco-friendly polyethylene structures, compostable valve membranes, and toxin-free plastic composites, has radically enhanced adoption, particularly as producers scramble to meet new sustainability mandates and evolving environmental packaging standards.

Dual-function non-filter integrated valves with gas and moisture regulation mechanisms, pressure relief configurations with adjustable pressure, and adaptive ventilation enable optimal design development, leading to market growth through improved product stability and shelf-life.

The growing demand for pressure-sensitive venting, which is frequently used in diverse applications such as temperature-responsive activation, the increasingly integrated installation configuration of non-filter integrated valves, among others, in industrial and pharmaceutical pouch packaging has positively impacted the growth of the global market, enhancing operational performance and product safety.

While advantageous in cost, simplicity of design, and high compatibility, the segment of integrated non-filter valve has increased microbial exposure risk, greater susceptibility to external contaminants and airflow inconsistencies amid variable environmental conditions.

Nonetheless, with new advancements in AI-powered gas flow optimization, bio-based valve material development and dynamic pressure-adaptive venting mechanisms are driving enhancements to efficiency, performance, and market competitiveness, continued growth for non-filter integrated degassing valves around the globe is still assured.

Polypropylene (PP) and Bio-Based Valves Drive Market Growth as Industries Shift Towards Sustainable and High-Performance Material Solutions

The Degassing Valves Market growth is sustained by the Polypropylene (PP) Valves and Bio-Based Valves segments, as the manufacturers, packaging companies, and food processors encourage efficiency, sustainability, and durability to make the production process of the degassing valves more robust. Valve longevity, environmental impact, and operational performance across a number of applications are all significantly influenced by these material categories.

Polypropylene (PP) Valves Expand as Manufacturers Seek Cost-Effective and Durable Packaging Components

The industry is dominated primarily by polypropylene valves owing to their strong durability, inexpensive nature and high resistance to corrosion. PP is chosen over other plastics for its superior moisture barrier, lightweight nature, and excellent sealing properties, all of which help make it the go-to in degassing valve applications in food packaging and industrial processing.

Growing demand for heat resistance and chemically inert degassing valve materials across industries such as agriculture and pharmaceuticals will further boost adoption. According to studies, more than 65% of all medical-grade packaging degassing valves are made using polypropylene materials, which is an option utilized to bring sterility to the table while maintaining adhesion to high-temperature processing.

Demand in the market has been consolidated with the introduction of high-performance polypropylene valves, which offer UV stable coatings and high-end pressure performance along with their antimicrobial surface in ideal packaging techniques that together improve valve life and package integrity.

Although you would think with its advantages of being less expensive, chemically resistant, and mechanically robust, the polypropylene valve segment would flourish but are subjected to challenges such as environmental issues of plastic waste, non-biodegradability, and stringent regulations against plastic usage.

Yet, advancements in PP recycling processes, bio-based polypropylene substitutes, and high-strength lightweight PP composites are enhancing sustainability, effectiveness and regulatory adherence, guaranteeing to intensify the growth of global polypropylene-based degassing valves further.

Bio-Based Valves Maintain Growth as Industries Embrace Sustainable and Eco-Friendly Packaging Solutions

There is continued positive growth in the bio-based degassing valves market, as manufacturers increasingly focus on renewable, compost and environmentally friendly packaging material. In contrast to conventional plastic valves, bio-based materials utilize polymers from natural plants, biodegradable composites, and compostable components for the least environmental harm.

Adoption has been fuelled by a growing need for sustainable packaging solutions in the organic food packaging, specialty coffee, and eco-conscious consumer product segments. Research found that over 50% of new-generation degassing valves found in top-of-the-line coffee bags do in fact use bio-based materials in order to fit sustainable branding strategies.

Starch-based polymers, cellulose-derived composite materials, and biodegradable sealing mechanisms have fostered a stronger market demand for high-performance bio-based valves, with lower environmental impact and higher material recyclability.

The bio-based valve segment has sustainable, lower carbon footprint, and regulatory compliance advantages, but high production costs, limited scalability towards mass manufacturing, and durability concerns in high moisture environments remain major challenges.

Nonetheless, the introduction of cutting-edge technologies like bio-polymer reinforcement, AI-driven material optimization, and enzyme-assisted degradation control, are enhancing performance, making them more price competitive, and ensuring that they are environmentally sustainable, which will drive bio-based degassing valves adoption across the global market.

Regional Market Trends

North America

North America is a prominent region in the degassing valves market, with the adoption in the USA and Canada attributed to high demand across the specialty coffee industry as well as improved food packaging solutions. Innovation in valve technology, including compostable and recyclable degassing valves, is also being driven by the region’s growing focus on premium and sustainable packaging.

Moreover, the growth of the e-commerce industry is increasing the need for protective packaging solutions that ensure product quality. Alternative packaging technologies may threaten these smart packaging solutions, but investment in eco-friendly materials is likely to ensure continued growth in the market in North America.

Europe

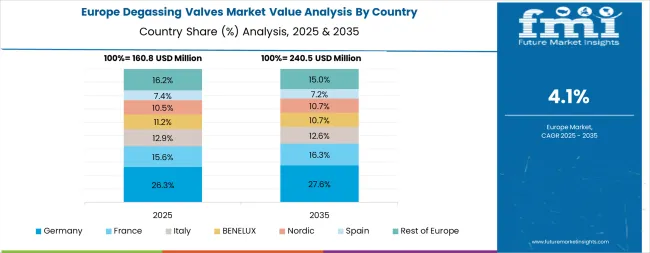
Germany, the UK, and Italy are the main players in the European degassing valves market. Strong regulatory framework in the region working towards promoting sustainable packaging solutions is prompting manufacturers to introduce biodegradable and non-plastic valve alternatives. Demand for high-performance degassing valves is being driven by the coffee culture across Europe, especially for specialty coffee and artisanal brands.

Moreover, the growing presence of stringent food safety regulations is further stimulating the uptake of advanced packaging solutions. The European market for fresh-packaged goods is expected to experience robust growth due to the growing demand for premium, fresh-packaged products among consumers, despite challenges in regulatory barriers and high manufacturing costs.

Asia-Pacific

The degassing valves market is expected to be fully grown in the Asia-pacific region with growing coffee consumption, growing food processing industries and increasing demand for extended shelf-life packaging in countries like China, Japan, India and South Korea. Demand for the market is being further fuelled by a growing urban population in the region and shifting consumer preferences toward convenience foods and ready-to-drink beverages.

Some challenges, such as price sensitivity and lack of awareness of degassing valve technology in some emerging markets are likely to have an impact on adoption rate. However, increasing investments in food packaging innovations, as well as the establishment of regional packaging manufacturers, are likely to contribute to overall market growth in the region.

Challenges and Opportunities

Challenge: High Production Costs and Material Compatibility Issues

High production cost, with developing advanced valve materials, is challenge in the market for degassing vails to manufacture and deliver these products compatible with different packaging format and Advancements in the valve technology, or as a result, the resources are highly invested. They are faced with balancing performance, sustainability and cost-effectiveness against strict food safety regulations.

Moreover, the ultimate manufacturing landscape becomes more complex due to the requirement of specialized manufacturing processes and compliance with regional standards. Overcoming these hurdles will need continued investment in research about materials, automating production processes and forging partnerships with packaging companies.

Opportunity: Expansion of Smart Packaging and Sustainable Degassing Valve Solutions

Growing deployment of smart packaging technologies and sustainable degassing valve solutions boom the market growth opportunity. Green innovations such as biodegradable valves, sensor-ready packaging for monitoring freshness in real-time, and customizable degassing valve designs are becoming popular among eco-friendly businesses and consumers.

Furthermore, the increasing preference for specialty coffee and natural food trade is boosting the investment for quality-based packaging solutions that prolong the shelf-life of products. With rising sustainability and food safety concerns, the demand for advanced, eco-friendly degassing valves is projected to witness substantial growth in the following decade.

Shifts in the Degassing Valves Market from 2020 to 2024 and Future Trends 2025 to 2035

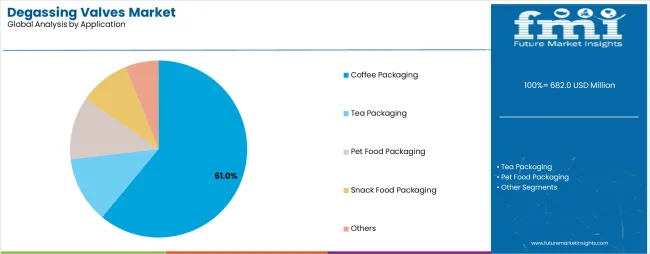
The degassing valves market is growing due to a variety of factors, including increasing demand for extended shelf life for packaged foods and beverages, rising adoption of flexible packaging solutions, and growing emphasis on product freshness. One-way degassing valves were especially crucial in industries like coffee packaging, food processing, and pharmaceutical storage, where controlled gas release is needed to preserve the quality of the product.

Pressure-sensitive valve mechanisms, improved oxygen barrier performance and multi-layer valve membranes are innovations that gave the product higher efficiency. In contrast, the use of plastic-based valves presented challenges including varying raw material prices, regulatory compliance issues, and environmental concerns that acted as barriers to sustainable growth.

By 2025 to 2035, bioplastic degassing valves, Artificial Intelligence (AI) supported gas detection systems, and block chain for packaging transparency will emerge. Innovative technology like smart degassing valves that can indicate real-time freshness, filtration membranes enhanced with nanotechnology and self-regulating adaptive valving mechanisms will extend product longevity and sustainability.

3D printed biodegradable valve components, sensor-integrated active packaging, and gas diffusion control optimised through AI will all contribute to increasing the efficiency of the process.

Emerging trends of zero-waste packaging solutions, AI-driven predictive shelf-life analytics to determine and extend the actual lifespan of perishable goods, and the use of block chain for decentralized supply chain verification will set new benchmarks in the marketplace thereby guaranteeing better-tasting and fresher products with improved freshness, less waste, and better consumer confidence.

Market Shifts: A Comparative Analysis (2020 to 2024 vs. 2025 to 2035)

Market Shift 2020 to 2024 Trends
Regulatory Landscape Compliance with FDA, EFSA, and food-grade material safety regulations.
Material Innovation Use of plastic-based one-way degassing valves with basic gas release functions.
Industry Adoption Growth in coffee packaging, food storage, pharmaceutical packaging, and industrial gas control.
Smart & AI-Enabled Valves Early adoption of pressure-sensitive gas release mechanisms and high-barrier protective films.
Market Competition Dominated by food packaging suppliers, valve technology manufacturers, and flexible packaging firms.
Market Growth Drivers Demand fuelled by rising consumer preference for fresh products, growing coffee and specialty food markets, and sustainability concerns.
Sustainability and Environmental Impact Early adoption of recyclable plastic valves, low-emission manufacturing, and eco-friendly adhesive technology.
Integration of AI & Digitalization Limited AI use in manual valve testing and basic gas release optimization.
Advancements in Manufacturing Use of standard injection-moulded polymer valves, silicone membranes, and mechanical pressure regulators.
Market Shift 2025 to 2035 Projections
Regulatory Landscape Stricter sustainability mandates, AI-driven compliance monitoring, and block chain-backed supply chain transparency.
Material Innovation Adoption of biodegradable, plant-based, and nanotechnology-enhanced degassing valve materials.
Industry Adoption Expansion into smart AI-assisted packaging, real-time freshness tracking, and sensor-integrated degassing technology.
Smart & AI-Enabled Valves Large-scale deployment of self-regulating gas diffusion valves, AI-driven spoilage detection, and IoT-enabled freshness monitoring systems.
Market Competition Increased competition from AI-driven packaging innovators, biodegradable material developers, and block chain-based traceability platforms.
Market Growth Drivers Growth driven by smart packaging integration, AI-assisted quality control, and large-scale adoption of bio-based degassing valve solutions.
Sustainability and Environmental Impact Large-scale transition to carbon-neutral degassing valve production, zero-waste packaging, and self-degrading valve components.
Integration of AI & Digitalization AI-powered real-time spoilage alerts, machine-learning-based gas diffusion control, and predictive freshness analysis.
Advancements in Manufacturing Evolution of 3D-printed degassing valves, graphene-enhanced gas filtration membranes, and fully autonomous AI-regulated packaging solutions.

Country-wise Outlook

United States

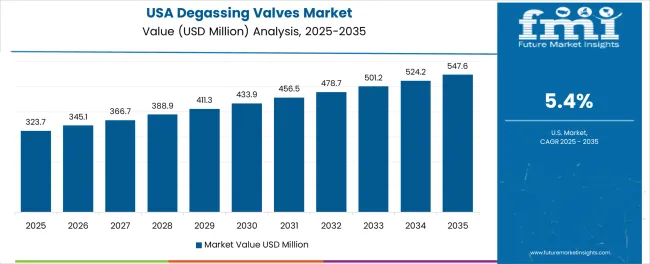
USA continues to be a key market for degassing valves, as rising demand for extended shelf-life packaging, growing applications in food and beverage packaging, and an increase in coffee consumption contribute to a broader market. Market growth is driven by the presence of major coffee roasters, specialty coffee brands, and food packaging companies.

Industry Trends Is Changing the World of Packaging Technology that is biodegradable and recyclable degassing valves. The growing need for vacuum-sealable and airtight packaging in pharmaceuticals and industrial applications also drives the growth of the market. The booming e-commerce and direct-to-consumer coffee brands are also fuelling demand for packaging solutions with degassing capabilities.

Country CAGR (2025 to 2035)
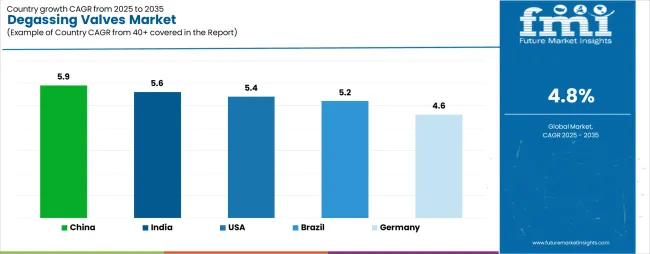
United States 5.1%

United Kingdom

The UK degassing valves market is growing at a steady pace owing to several factors, including growing demand for premium coffee packaging, increasing adoption of sustainable packaging solutions, and growing interest in flexible food storage. Eco-friendly and compostable packaging materials are vital to the growing shift, which is also driving innovation in the design of degassing valves.

Moreover, the growing specialty coffee market and the rising impact of home brewing trends are further driving demand for high-quality packaging with freshness preservation. Market expansion is also influenced by the growth and acceptance of degassing valves in pharmaceutical and industrial sectors.

Country CAGR (2025 to 2035)
United Kingdom 4.5%

European Union

The European Union is dominated by Germany, France, and Italy in the degassing valves market, which is owing to stringent food packaging regulations, a surge in the demand for enhanced quality of coffee packaging, and a growth in investments in sustainable packaging technology. The EU’s drive for recyclable and compostable packaging solutions is driving manufacturers to engineer innovative degassing valves having reduced environmental impact.

Furthermore, growth of specialty coffee chains, private-label coffee brands, and premium food packaging solutions also propelling its market. Further, increasing usage of degassing valves in Modified Atmosphere Packaging for extending food freshness is additionally promoting market growth.

Country CAGR (2025 to 2035)
European Union 4.7%

Japan

The Japan degassing valves market is growing due to rising demand for high-quality packaged food, increasing consumer interest in premium coffee, and advances in the technology of vacuum sealed packaging. The focus on preserving freshness and reducing food waste will drive the use of degassing valves in coffee, tea and snack packages, the country said.

Further, market innovation is driven by the use of smart packaging solutions, including oxygen-scavenging films and interactive packaging. The growing ready-to-drink beverage market in Japan and rising preference for re-sealable packaging solutions is also boosting market growth.

Country CAGR (2025 to 2035)
Japan 4.4%

South Korea

Increasing consumption of specialty coffee, rising investments on sustainable packaging, as well as growing demand for high performance food preservation solutions are triggering the demand for degassing valve in South Korea. Increasing café culture in the region coupled with premium coffee brands demand is driving the market for advanced degassing valve technologies.

Furthermore, the use of degassing valves in novel packaging for fermented food, pet food, and health supplements is opening up market opportunities. Market trends are also being influenced in emerging economies where the acute rise in eco-conscious consumer preferences and government regulations supporting biodegradable packaging solutions are applicable.

Country CAGR (2025 to 2035)
South Korea 4.9%

Competitive Outlook

Factors such as growing demand for extended product shelf life in the food and beverage sector, rising adoption of degassing solutions in coffee packaging, and advancements in valve technology for the control of pressure are all driving the Degassing Valves Market.

The market is witnessing moderate growth driven by increasing emphasis on sustainable packaging and improved product freshness. Driving trends in this industry include demand for bio-based degassing valves, smart pressure-regulating technology, and advancements in one-way venting mechanisms.

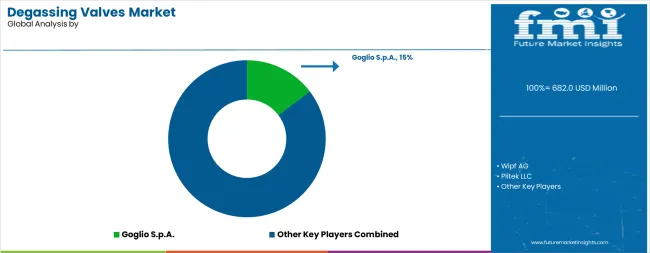
Market Share Analysis by Company

Company Name Estimated Market Share (%)
Goglio S.p.A. 12-16%
Wipf AG 10-14%
Plitek, LLC 8-12%
Syntegon Technology 6-10%
TricorBraun Flex 4-8%
Other Companies (combined) 45-55%

Key Company Offerings and Activities

Company Name Key Offerings/Activities
Goglio S.p.A. Develops high-quality one-way degassing valves for coffee and specialty food packaging.
Wipf AG Specializes in bio-based and recyclable degassing valve solutions for sustainable packaging.
Plitek, LLC Offers customized degassing valves with pressure-controlled venting for industrial and food applications.
Syntegon Technology Provides integrated degassing valve systems for automated food packaging lines.
TricorBraun Flex Focuses on flexible packaging solutions with innovative degassing valve technologies.

Key Company Insights

Goglio S.p.A. (12-16%)

Goglio leads the degassing valve market with high-performance, pressure-controlled venting solutions for coffee and food packaging.

Wipf AG (10-14%)

Wipf specializes in eco-friendly degassing valves, focusing on sustainability and regulatory compliance.

Plitek, LLC (8-12%)

Plitek offers customized venting solutions, enhancing freshness and shelf-life stability in food and industrial packaging.

Syntegon Technology (6-10%)

Syntegon provides automated degassing valve systems integrated into high-speed packaging machinery.

TricorBraun Flex (4-8%)

TricorBraun Flex innovates in flexible packaging solutions, incorporating advanced degassing valve technologies.

Other Key Players (45-55% Combined)

Several packaging and venting solution manufacturers contribute to the expanding Degassing Valves Market. These include:

  • Pacific Bag, Inc. Develops high-barrier packaging with integrated degassing valves.
  • Fres-co System USA, Inc. Specializes in airtight packaging solutions with pressure-regulated venting.
  • Swisspack Europe Provides re-sealable bags with customized degassing valve integration.
  • Gualapack Group Manufactures degassing valves for pouch and flexible packaging applications.
  • Amcor Plc Focuses on sustainable degassing valve solutions for food and beverage packaging.

Report Coverage for Global Degassing Valves Market

Report Attributes Details
Industry Size (2025E) USD 262.1 million
Projected Market Size (2035F) USD 418.9 million
CAGR (2025 to 2035) 4.8%
Base Year for Estimation 2024
Historical Period 2020 to 2024
Forecast Period 2025 to 2035
Quantitative Units Revenue in USD million and Volume in units
By Product Type Filter Integrated Valves, Non-Filter Integrated Valves
By Material Type Polyethylene (PE) Valves, Polypropylene (PP) Valves, Bio-based Valves, Silicone Valves, Other Valves
By Packaging Format Bags, Pouches
By End Use Coffee Making, Dairy Products, Pet Food Production, Fermented Foods Processing, Dry Powder Chemicals Preparation, Other End Uses
By Region North America, Latin America, Western Europe, Eastern Europe, East Asia, South Asia Pacific, Middle East and Africa
Key Players Goglio S.p.A., Wipf AG, Plitek, LLC, Syntegon Technology, TricorBraun Flex, Pacific Bag, Inc., Fres-co System USA, Inc., Swisspack Europe, Gualapack Group, Amcor Plc
Countries Covered United States, Canada, Mexico, Brazil, Argentina, Germany, France, United Kingdom, Italy, Spain, Netherlands, China, India, Japan, South Korea, ANZ, GCC Countries, South Africa
Additional Attributes Dollar sales by product type (filter integrated, non-filter integrated), Dollar sales by packaging format (bags, pouches), Dollar sales by material (PE, PP, bio-based, silicone), Trends in modified atmosphere packaging and degassing efficiency, Technological innovations in valve integration and sealing, Regional growth patterns in specialty food packaging
Customization and Pricing Customization and Pricing Available on Request

Degassing Valves Market Segmentation

By Product Type:

  • Filter Integrated Valves
  • Non-Filter Integrated Valves

By Material Type:

  • Polyethylene (PE) Valves
  • Polypropylene (PP) Valves
  • Bio-based Valves
  • Silicone Valves
  • Other Valves

By Packaging Format:

  • Bags
  • Pouches

By End Use:

  • Coffee Making
  • Dairy Products
  • Pet Food Production
  • Fermented Foods Processing
  • Dry Powder Chemicals Preparation
  • Other End Uses

By Region:

  • North America
  • Latin America
  • Western Europe
  • Eastern Europe
  • East Asia
  • South Asia Pacific
  • Middle East and Africa

Table of Content

  1. Executive Summary
  2. Industry Introduction, including Taxonomy and Market Definition
  3. Market Trends and Success Factors, including Macro-Economic Factors, Market Dynamics, and Recent Industry Developments
  4. Global Market Demand Analysis 2020 to 2024 and Forecast 2025 to 2035, including Historical Analysis and Future Projections
  5. Global Market Analysis 2020 to 2024 and Forecast 2025 to 2035
    • Product Type
    • Material Type
    • Packaging Format
    • End Use
  6. Global Market Analysis 2020 to 2024 and Forecast 2025 to 2035, By Product Type
    • Filter Integrated Valves
    • Non-Filter Integrated Valves
  7. Global Market Analysis 2020 to 2024 and Forecast 2025 to 2035, By Material Type
    • Polyethylene (PE) Valves
    • Polypropylene (PP) Valves
    • Bio-based Valves
    • Silicone Valves
    • Other Valves
  8. Global Market Analysis 2020 to 2024 and Forecast 2025 to 2035, By Packaging Format
    • Bags
    • Pouches
  9. Global Market Analysis 2020 to 2024 and Forecast 2025 to 2035, By End Use
    • Coffee Making
    • Dairy Products
    • Pet Food Production
    • Fermented Foods Processing
    • Dry Powder Chemicals Preparation
    • Other End Uses
  10. Global Market Analysis 2020 to 2024 and Forecast 2025 to 2035, By Region
    • North America
    • Latin America
    • Western Europe
    • Eastern Europe
    • East Asia
    • South Asia Pacific
    • Middle East and Africa
  11. North America Sales Analysis 2020 to 2024 and Forecast 2025 to 2035, by Key Segments and Countries
  12. Latin America Sales Analysis 2020 to 2024 and Forecast 2025 to 2035, by Key Segments and Countries
  13. Western Europe Sales Analysis 2020 to 2024 and Forecast 2025 to 2035, by Key Segments and Countries
  14. Eastern Europe Sales Analysis 2020 to 2024 and Forecast 2025 to 2035, by Key Segments and Countries
  15. East Asia Sales Analysis 2020 to 2024 and Forecast 2025 to 2035, by Key Segments and Countries
  16. South Asia Pacific Sales Analysis 2020 to 2024 and Forecast 2025 to 2035, by Key Segments and Countries
  17. Middle East and Africa Sales Analysis 2020 to 2024 and Forecast 2025 to 2035, by Key Segments and Countries
  18. Sales Forecast 2025 to 2035 by Product Type, Material Type, Packaging Format, and End Use for 30 Countries
  19. Competition Outlook, including Market Structure Analysis, Company Share Analysis by Key Players, and Competition Dashboard
  20. Company Profile
    • Goglio S.p.A.
    • Wipf AG
    • Plitek, LLC
    • Syntegon Technology
    • TricorBraun Flex
    • Pacific Bag, Inc.
    • Fres-co System USA, Inc.
    • Swisspack Europe
    • Gualapack Group
    • Amcor Plc

List of Tables

Table 1: Global Market Value (US$ Million) Forecast by Region, 2018 to 2033

Table 2: Global Market Volume (Units) Forecast by Region, 2018 to 2033

Table 3: Global Market Value (US$ Million) Forecast by Product Type, 2018 to 2033

Table 4: Global Market Volume (Units) Forecast by Product Type, 2018 to 2033

Table 5: Global Market Value (US$ Million) Forecast by Material, 2018 to 2033

Table 6: Global Market Volume (Units) Forecast by Material, 2018 to 2033

Table 7: Global Market Value (US$ Million) Forecast by Packaging Format, 2018 to 2033

Table 8: Global Market Volume (Units) Forecast by Packaging Format, 2018 to 2033

Table 9: Global Market Value (US$ Million) Forecast by End Use, 2018 to 2033

Table 10: Global Market Volume (Units) Forecast by End Use, 2018 to 2033

Table 11: North America Market Value (US$ Million) Forecast by Country, 2018 to 2033

Table 12: North America Market Volume (Units) Forecast by Country, 2018 to 2033

Table 13: North America Market Value (US$ Million) Forecast by Product Type, 2018 to 2033

Table 14: North America Market Volume (Units) Forecast by Product Type, 2018 to 2033

Table 15: North America Market Value (US$ Million) Forecast by Material, 2018 to 2033

Table 16: North America Market Volume (Units) Forecast by Material, 2018 to 2033

Table 17: North America Market Value (US$ Million) Forecast by Packaging Format, 2018 to 2033

Table 18: North America Market Volume (Units) Forecast by Packaging Format, 2018 to 2033

Table 19: North America Market Value (US$ Million) Forecast by End Use, 2018 to 2033

Table 20: North America Market Volume (Units) Forecast by End Use, 2018 to 2033

Table 21: Latin America Market Value (US$ Million) Forecast by Country, 2018 to 2033

Table 22: Latin America Market Volume (Units) Forecast by Country, 2018 to 2033

Table 23: Latin America Market Value (US$ Million) Forecast by Product Type, 2018 to 2033

Table 24: Latin America Market Volume (Units) Forecast by Product Type, 2018 to 2033

Table 25: Latin America Market Value (US$ Million) Forecast by Material, 2018 to 2033

Table 26: Latin America Market Volume (Units) Forecast by Material, 2018 to 2033

Table 27: Latin America Market Value (US$ Million) Forecast by Packaging Format, 2018 to 2033

Table 28: Latin America Market Volume (Units) Forecast by Packaging Format, 2018 to 2033

Table 29: Latin America Market Value (US$ Million) Forecast by End Use, 2018 to 2033

Table 30: Latin America Market Volume (Units) Forecast by End Use, 2018 to 2033

Table 31: Europe Market Value (US$ Million) Forecast by Country, 2018 to 2033

Table 32: Europe Market Volume (Units) Forecast by Country, 2018 to 2033

Table 33: Europe Market Value (US$ Million) Forecast by Product Type, 2018 to 2033

Table 34: Europe Market Volume (Units) Forecast by Product Type, 2018 to 2033

Table 35: Europe Market Value (US$ Million) Forecast by Material, 2018 to 2033

Table 36: Europe Market Volume (Units) Forecast by Material, 2018 to 2033

Table 37: Europe Market Value (US$ Million) Forecast by Packaging Format, 2018 to 2033

Table 38: Europe Market Volume (Units) Forecast by Packaging Format, 2018 to 2033

Table 39: Europe Market Value (US$ Million) Forecast by End Use, 2018 to 2033

Table 40: Europe Market Volume (Units) Forecast by End Use, 2018 to 2033

Table 41: Asia Pacific Market Value (US$ Million) Forecast by Country, 2018 to 2033

Table 42: Asia Pacific Market Volume (Units) Forecast by Country, 2018 to 2033

Table 43: Asia Pacific Market Value (US$ Million) Forecast by Product Type, 2018 to 2033

Table 44: Asia Pacific Market Volume (Units) Forecast by Product Type, 2018 to 2033

Table 45: Asia Pacific Market Value (US$ Million) Forecast by Material, 2018 to 2033

Table 46: Asia Pacific Market Volume (Units) Forecast by Material, 2018 to 2033

Table 47: Asia Pacific Market Value (US$ Million) Forecast by Packaging Format, 2018 to 2033

Table 48: Asia Pacific Market Volume (Units) Forecast by Packaging Format, 2018 to 2033

Table 49: Asia Pacific Market Value (US$ Million) Forecast by End Use, 2018 to 2033

Table 50: Asia Pacific Market Volume (Units) Forecast by End Use, 2018 to 2033

Table 51: MEA Market Value (US$ Million) Forecast by Country, 2018 to 2033

Table 52: MEA Market Volume (Units) Forecast by Country, 2018 to 2033

Table 53: MEA Market Value (US$ Million) Forecast by Product Type, 2018 to 2033

Table 54: MEA Market Volume (Units) Forecast by Product Type, 2018 to 2033

Table 55: MEA Market Value (US$ Million) Forecast by Material, 2018 to 2033

Table 56: MEA Market Volume (Units) Forecast by Material, 2018 to 2033

Table 57: MEA Market Value (US$ Million) Forecast by Packaging Format, 2018 to 2033

Table 58: MEA Market Volume (Units) Forecast by Packaging Format, 2018 to 2033

Table 59: MEA Market Value (US$ Million) Forecast by End Use, 2018 to 2033

Table 60: MEA Market Volume (Units) Forecast by End Use, 2018 to 2033

List of Figures

Figure 1: Global Market Value (US$ Million) by Product Type, 2023 to 2033

Figure 2: Global Market Value (US$ Million) by Material, 2023 to 2033

Figure 3: Global Market Value (US$ Million) by Packaging Format, 2023 to 2033

Figure 4: Global Market Value (US$ Million) by End Use, 2023 to 2033

Figure 5: Global Market Value (US$ Million) by Region, 2023 to 2033

Figure 6: Global Market Value (US$ Million) Analysis by Region, 2018 to 2033

Figure 7: Global Market Volume (Units) Analysis by Region, 2018 to 2033

Figure 8: Global Market Value Share (%) and BPS Analysis by Region, 2023 to 2033

Figure 9: Global Market Y-o-Y Growth (%) Projections by Region, 2023 to 2033

Figure 10: Global Market Value (US$ Million) Analysis by Product Type, 2018 to 2033

Figure 11: Global Market Volume (Units) Analysis by Product Type, 2018 to 2033

Figure 12: Global Market Value Share (%) and BPS Analysis by Product Type, 2023 to 2033

Figure 13: Global Market Y-o-Y Growth (%) Projections by Product Type, 2023 to 2033

Figure 14: Global Market Value (US$ Million) Analysis by Material, 2018 to 2033

Figure 15: Global Market Volume (Units) Analysis by Material, 2018 to 2033

Figure 16: Global Market Value Share (%) and BPS Analysis by Material, 2023 to 2033

Figure 17: Global Market Y-o-Y Growth (%) Projections by Material, 2023 to 2033

Figure 18: Global Market Value (US$ Million) Analysis by Packaging Format, 2018 to 2033

Figure 19: Global Market Volume (Units) Analysis by Packaging Format, 2018 to 2033

Figure 20: Global Market Value Share (%) and BPS Analysis by Packaging Format, 2023 to 2033

Figure 21: Global Market Y-o-Y Growth (%) Projections by Packaging Format, 2023 to 2033

Figure 22: Global Market Value (US$ Million) Analysis by End Use, 2018 to 2033

Figure 23: Global Market Volume (Units) Analysis by End Use, 2018 to 2033

Figure 24: Global Market Value Share (%) and BPS Analysis by End Use, 2023 to 2033

Figure 25: Global Market Y-o-Y Growth (%) Projections by End Use, 2023 to 2033

Figure 26: Global Market Attractiveness by Product Type, 2023 to 2033

Figure 27: Global Market Attractiveness by Material, 2023 to 2033

Figure 28: Global Market Attractiveness by Packaging Format, 2023 to 2033

Figure 29: Global Market Attractiveness by End Use, 2023 to 2033

Figure 30: Global Market Attractiveness by Region, 2023 to 2033

Figure 31: North America Market Value (US$ Million) by Product Type, 2023 to 2033

Figure 32: North America Market Value (US$ Million) by Material, 2023 to 2033

Figure 33: North America Market Value (US$ Million) by Packaging Format, 2023 to 2033

Figure 34: North America Market Value (US$ Million) by End Use, 2023 to 2033

Figure 35: North America Market Value (US$ Million) by Country, 2023 to 2033

Figure 36: North America Market Value (US$ Million) Analysis by Country, 2018 to 2033

Figure 37: North America Market Volume (Units) Analysis by Country, 2018 to 2033

Figure 38: North America Market Value Share (%) and BPS Analysis by Country, 2023 to 2033

Figure 39: North America Market Y-o-Y Growth (%) Projections by Country, 2023 to 2033

Figure 40: North America Market Value (US$ Million) Analysis by Product Type, 2018 to 2033

Figure 41: North America Market Volume (Units) Analysis by Product Type, 2018 to 2033

Figure 42: North America Market Value Share (%) and BPS Analysis by Product Type, 2023 to 2033

Figure 43: North America Market Y-o-Y Growth (%) Projections by Product Type, 2023 to 2033

Figure 44: North America Market Value (US$ Million) Analysis by Material, 2018 to 2033

Figure 45: North America Market Volume (Units) Analysis by Material, 2018 to 2033

Figure 46: North America Market Value Share (%) and BPS Analysis by Material, 2023 to 2033

Figure 47: North America Market Y-o-Y Growth (%) Projections by Material, 2023 to 2033

Figure 48: North America Market Value (US$ Million) Analysis by Packaging Format, 2018 to 2033

Figure 49: North America Market Volume (Units) Analysis by Packaging Format, 2018 to 2033

Figure 50: North America Market Value Share (%) and BPS Analysis by Packaging Format, 2023 to 2033

Figure 51: North America Market Y-o-Y Growth (%) Projections by Packaging Format, 2023 to 2033

Figure 52: North America Market Value (US$ Million) Analysis by End Use, 2018 to 2033

Figure 53: North America Market Volume (Units) Analysis by End Use, 2018 to 2033

Figure 54: North America Market Value Share (%) and BPS Analysis by End Use, 2023 to 2033

Figure 55: North America Market Y-o-Y Growth (%) Projections by End Use, 2023 to 2033

Figure 56: North America Market Attractiveness by Product Type, 2023 to 2033

Figure 57: North America Market Attractiveness by Material, 2023 to 2033

Figure 58: North America Market Attractiveness by Packaging Format, 2023 to 2033

Figure 59: North America Market Attractiveness by End Use, 2023 to 2033

Figure 60: North America Market Attractiveness by Country, 2023 to 2033

Figure 61: Latin America Market Value (US$ Million) by Product Type, 2023 to 2033

Figure 62: Latin America Market Value (US$ Million) by Material, 2023 to 2033

Figure 63: Latin America Market Value (US$ Million) by Packaging Format, 2023 to 2033

Figure 64: Latin America Market Value (US$ Million) by End Use, 2023 to 2033

Figure 65: Latin America Market Value (US$ Million) by Country, 2023 to 2033

Figure 66: Latin America Market Value (US$ Million) Analysis by Country, 2018 to 2033

Figure 67: Latin America Market Volume (Units) Analysis by Country, 2018 to 2033

Figure 68: Latin America Market Value Share (%) and BPS Analysis by Country, 2023 to 2033

Figure 69: Latin America Market Y-o-Y Growth (%) Projections by Country, 2023 to 2033

Figure 70: Latin America Market Value (US$ Million) Analysis by Product Type, 2018 to 2033

Figure 71: Latin America Market Volume (Units) Analysis by Product Type, 2018 to 2033

Figure 72: Latin America Market Value Share (%) and BPS Analysis by Product Type, 2023 to 2033

Figure 73: Latin America Market Y-o-Y Growth (%) Projections by Product Type, 2023 to 2033

Figure 74: Latin America Market Value (US$ Million) Analysis by Material, 2018 to 2033

Figure 75: Latin America Market Volume (Units) Analysis by Material, 2018 to 2033

Figure 76: Latin America Market Value Share (%) and BPS Analysis by Material, 2023 to 2033

Figure 77: Latin America Market Y-o-Y Growth (%) Projections by Material, 2023 to 2033

Figure 78: Latin America Market Value (US$ Million) Analysis by Packaging Format, 2018 to 2033

Figure 79: Latin America Market Volume (Units) Analysis by Packaging Format, 2018 to 2033

Figure 80: Latin America Market Value Share (%) and BPS Analysis by Packaging Format, 2023 to 2033

Figure 81: Latin America Market Y-o-Y Growth (%) Projections by Packaging Format, 2023 to 2033

Figure 82: Latin America Market Value (US$ Million) Analysis by End Use, 2018 to 2033

Figure 83: Latin America Market Volume (Units) Analysis by End Use, 2018 to 2033

Figure 84: Latin America Market Value Share (%) and BPS Analysis by End Use, 2023 to 2033

Figure 85: Latin America Market Y-o-Y Growth (%) Projections by End Use, 2023 to 2033

Figure 86: Latin America Market Attractiveness by Product Type, 2023 to 2033

Figure 87: Latin America Market Attractiveness by Material, 2023 to 2033

Figure 88: Latin America Market Attractiveness by Packaging Format, 2023 to 2033

Figure 89: Latin America Market Attractiveness by End Use, 2023 to 2033

Figure 90: Latin America Market Attractiveness by Country, 2023 to 2033

Figure 91: Europe Market Value (US$ Million) by Product Type, 2023 to 2033

Figure 92: Europe Market Value (US$ Million) by Material, 2023 to 2033

Figure 93: Europe Market Value (US$ Million) by Packaging Format, 2023 to 2033

Figure 94: Europe Market Value (US$ Million) by End Use, 2023 to 2033

Figure 95: Europe Market Value (US$ Million) by Country, 2023 to 2033

Figure 96: Europe Market Value (US$ Million) Analysis by Country, 2018 to 2033

Figure 97: Europe Market Volume (Units) Analysis by Country, 2018 to 2033

Figure 98: Europe Market Value Share (%) and BPS Analysis by Country, 2023 to 2033

Figure 99: Europe Market Y-o-Y Growth (%) Projections by Country, 2023 to 2033

Figure 100: Europe Market Value (US$ Million) Analysis by Product Type, 2018 to 2033

Figure 101: Europe Market Volume (Units) Analysis by Product Type, 2018 to 2033

Figure 102: Europe Market Value Share (%) and BPS Analysis by Product Type, 2023 to 2033

Figure 103: Europe Market Y-o-Y Growth (%) Projections by Product Type, 2023 to 2033

Figure 104: Europe Market Value (US$ Million) Analysis by Material, 2018 to 2033

Figure 105: Europe Market Volume (Units) Analysis by Material, 2018 to 2033

Figure 106: Europe Market Value Share (%) and BPS Analysis by Material, 2023 to 2033

Figure 107: Europe Market Y-o-Y Growth (%) Projections by Material, 2023 to 2033

Figure 108: Europe Market Value (US$ Million) Analysis by Packaging Format, 2018 to 2033

Figure 109: Europe Market Volume (Units) Analysis by Packaging Format, 2018 to 2033

Figure 110: Europe Market Value Share (%) and BPS Analysis by Packaging Format, 2023 to 2033

Figure 111: Europe Market Y-o-Y Growth (%) Projections by Packaging Format, 2023 to 2033

Figure 112: Europe Market Value (US$ Million) Analysis by End Use, 2018 to 2033

Figure 113: Europe Market Volume (Units) Analysis by End Use, 2018 to 2033

Figure 114: Europe Market Value Share (%) and BPS Analysis by End Use, 2023 to 2033

Figure 115: Europe Market Y-o-Y Growth (%) Projections by End Use, 2023 to 2033

Figure 116: Europe Market Attractiveness by Product Type, 2023 to 2033

Figure 117: Europe Market Attractiveness by Material, 2023 to 2033

Figure 118: Europe Market Attractiveness by Packaging Format, 2023 to 2033

Figure 119: Europe Market Attractiveness by End Use, 2023 to 2033

Figure 120: Europe Market Attractiveness by Country, 2023 to 2033

Figure 121: Asia Pacific Market Value (US$ Million) by Product Type, 2023 to 2033

Figure 122: Asia Pacific Market Value (US$ Million) by Material, 2023 to 2033

Figure 123: Asia Pacific Market Value (US$ Million) by Packaging Format, 2023 to 2033

Figure 124: Asia Pacific Market Value (US$ Million) by End Use, 2023 to 2033

Figure 125: Asia Pacific Market Value (US$ Million) by Country, 2023 to 2033

Figure 126: Asia Pacific Market Value (US$ Million) Analysis by Country, 2018 to 2033

Figure 127: Asia Pacific Market Volume (Units) Analysis by Country, 2018 to 2033

Figure 128: Asia Pacific Market Value Share (%) and BPS Analysis by Country, 2023 to 2033

Figure 129: Asia Pacific Market Y-o-Y Growth (%) Projections by Country, 2023 to 2033

Figure 130: Asia Pacific Market Value (US$ Million) Analysis by Product Type, 2018 to 2033

Figure 131: Asia Pacific Market Volume (Units) Analysis by Product Type, 2018 to 2033

Figure 132: Asia Pacific Market Value Share (%) and BPS Analysis by Product Type, 2023 to 2033

Figure 133: Asia Pacific Market Y-o-Y Growth (%) Projections by Product Type, 2023 to 2033

Figure 134: Asia Pacific Market Value (US$ Million) Analysis by Material, 2018 to 2033

Figure 135: Asia Pacific Market Volume (Units) Analysis by Material, 2018 to 2033

Figure 136: Asia Pacific Market Value Share (%) and BPS Analysis by Material, 2023 to 2033

Figure 137: Asia Pacific Market Y-o-Y Growth (%) Projections by Material, 2023 to 2033

Figure 138: Asia Pacific Market Value (US$ Million) Analysis by Packaging Format, 2018 to 2033

Figure 139: Asia Pacific Market Volume (Units) Analysis by Packaging Format, 2018 to 2033

Figure 140: Asia Pacific Market Value Share (%) and BPS Analysis by Packaging Format, 2023 to 2033

Figure 141: Asia Pacific Market Y-o-Y Growth (%) Projections by Packaging Format, 2023 to 2033

Figure 142: Asia Pacific Market Value (US$ Million) Analysis by End Use, 2018 to 2033

Figure 143: Asia Pacific Market Volume (Units) Analysis by End Use, 2018 to 2033

Figure 144: Asia Pacific Market Value Share (%) and BPS Analysis by End Use, 2023 to 2033

Figure 145: Asia Pacific Market Y-o-Y Growth (%) Projections by End Use, 2023 to 2033

Figure 146: Asia Pacific Market Attractiveness by Product Type, 2023 to 2033

Figure 147: Asia Pacific Market Attractiveness by Material, 2023 to 2033

Figure 148: Asia Pacific Market Attractiveness by Packaging Format, 2023 to 2033

Figure 149: Asia Pacific Market Attractiveness by End Use, 2023 to 2033

Figure 150: Asia Pacific Market Attractiveness by Country, 2023 to 2033

Figure 151: MEA Market Value (US$ Million) by Product Type, 2023 to 2033

Figure 152: MEA Market Value (US$ Million) by Material, 2023 to 2033

Figure 153: MEA Market Value (US$ Million) by Packaging Format, 2023 to 2033

Figure 154: MEA Market Value (US$ Million) by End Use, 2023 to 2033

Figure 155: MEA Market Value (US$ Million) by Country, 2023 to 2033

Figure 156: MEA Market Value (US$ Million) Analysis by Country, 2018 to 2033

Figure 157: MEA Market Volume (Units) Analysis by Country, 2018 to 2033

Figure 158: MEA Market Value Share (%) and BPS Analysis by Country, 2023 to 2033

Figure 159: MEA Market Y-o-Y Growth (%) Projections by Country, 2023 to 2033

Figure 160: MEA Market Value (US$ Million) Analysis by Product Type, 2018 to 2033

Figure 161: MEA Market Volume (Units) Analysis by Product Type, 2018 to 2033

Figure 162: MEA Market Value Share (%) and BPS Analysis by Product Type, 2023 to 2033

Figure 163: MEA Market Y-o-Y Growth (%) Projections by Product Type, 2023 to 2033

Figure 164: MEA Market Value (US$ Million) Analysis by Material, 2018 to 2033

Figure 165: MEA Market Volume (Units) Analysis by Material, 2018 to 2033

Figure 166: MEA Market Value Share (%) and BPS Analysis by Material, 2023 to 2033

Figure 167: MEA Market Y-o-Y Growth (%) Projections by Material, 2023 to 2033

Figure 168: MEA Market Value (US$ Million) Analysis by Packaging Format, 2018 to 2033

Figure 169: MEA Market Volume (Units) Analysis by Packaging Format, 2018 to 2033

Figure 170: MEA Market Value Share (%) and BPS Analysis by Packaging Format, 2023 to 2033

Figure 171: MEA Market Y-o-Y Growth (%) Projections by Packaging Format, 2023 to 2033

Figure 172: MEA Market Value (US$ Million) Analysis by End Use, 2018 to 2033

Figure 173: MEA Market Volume (Units) Analysis by End Use, 2018 to 2033

Figure 174: MEA Market Value Share (%) and BPS Analysis by End Use, 2023 to 2033

Figure 175: MEA Market Y-o-Y Growth (%) Projections by End Use, 2023 to 2033

Figure 176: MEA Market Attractiveness by Product Type, 2023 to 2033

Figure 177: MEA Market Attractiveness by Material, 2023 to 2033

Figure 178: MEA Market Attractiveness by Packaging Format, 2023 to 2033

Figure 179: MEA Market Attractiveness by End Use, 2023 to 2033

Figure 180: MEA Market Attractiveness by Country, 2023 to 2033

Frequently Asked Questions

What was the overall size of the degassing valves market in 2025?

The overall market size for the degassing valves market was USD 262.1 Million in 2025.

How big is the Degassing Valves market expected to be in 2035?

The degassing valves market is expected to reach USD 418.9 Million in 2035.

What will drive the demand for the degassing valves market during the forecast period?

The demand for degassing valves will be driven by increasing demand for extended shelf-life packaging in the food and beverage industry, rising adoption in coffee packaging solutions, growing need for pressure control in flexible packaging, and advancements in sustainable and biodegradable packaging materials.

List the top 5 countries contributing to the degassing valves market?

The top 5 countries driving the development of the Degassing Valves market are the USA, China, Germany, Italy, and Brazil.

Which segment in type is expected to lead in the degassing valves market?

The filter integrated valves segment is expected to command a significant share over the assessment period.

Explore Packaging Technology Insights

Future Market Insights

Degassing Valves Market