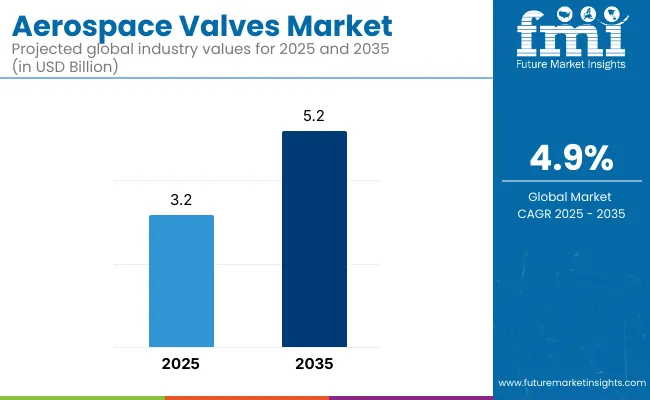
The aerospace valves Market is expected to amount to USD 3.2 billion by 2025. It is also predicted that it will grow to USD 5.2 billion by 2035, at a Compound Annual Growth Rate (CAGR) of 4.9% throughout the forecast period.

Key Market Metrics
| Metric | Value |
|---|---|
| Market Size in 2025 | USD 3.2 Billion |
| Projected Market Size in 2035 | USD 5.2 Billion |
| CAGR (2025 to 2035) | 4.9% |
The aerospace valves are mechanical devices employed for controlling the flow and pressure of fluids, gases, and slurries in aerospace systems. Aerospace valves are essential elements in fluid control systems that enable efficient fluid regulation and play a role in aircraft performance and safety.
Aerospace valves are used in various applications, including fuel systems, hydraulic systems, pneumatic systems, and environmental control systems. The increasing need for fuel-efficient and lightweight aerospace systems is anticipated to drive the demand for sophisticated valve technologies in different aerospace applications.
Market Drivers Technological advancements in association with the fluid control systems, rising demand for lightweight materials, and the growing number of investments in aerospace engineering innovations considerably contribute to the growth of the market
The aerospace valves market in North America is driven by a robust aviation and defense industry, widespread adoption of innovative fluid control systems, and substantial R&D investments. The USA and Canada also take the lead in next-generation valve technology development and commercialization.
The European market is characterized by growing demand for fuel-efficient aircraft, stringent regulatory standards, and advancements in aerospace technologies. Countries like Germany, France, and the UK are now on a sustainability course, and valve developments are increasingly directed toward better-performing aircraft.
The aerospace valves market in the Asia-Pacific region is growing at the fastest rate, driven by the region's rapid growth in commercial aviation and defense programs. Aerospace manufacturing and infrastructure development is ramping up in China, India and Japan in response to growing demand.
This market in Latin America is expected to grow at a steady rate, owing to increasing investments in the aerospace industry along with the rising demand for regional air travel. With Brazil and Mexico as Leading Enabler Countries, to enhance aerospace production capability and integrate advanced fluid control systems.
The aerospace valves industry in the Middle East & Africa is also gradually increasing its footprint with growing investments in defense, space programs, and aircraft modernization. This is in the context of the UAE and South Africa spearheading initiatives to develop and strengthen aerospace manufacturing capabilities within the region.
Looking ahead, continuous evolution in aerospace valve technologies and rising adoption rate across various applications hold long-term growth prospects in the aerospace valves market, introducing new business avenues for aerospace engineers, component manufacturers, and defense contractors.
Stringent Regulatory Compliance and Certification Requirements
The complexity of international regulatory frameworks poses a significant barrier to entry, particularly for companies developing new valve technologies. These valves, which control the flow of fluids and gases in critical aircraft systems such as fuel, hydraulic, pneumatic, and environmental control systems, must adhere to rigorous safety, reliability, and performance standards set by aviation authorities like the Federal Aviation Administration (FAA), European Union Aviation Safety Agency (EASA), and various defense and space organizations.
To ensure compliance with these regulations, manufacturers must engage in rigorous testing, validation, and certification procedures, which significantly increase both the costs and timeframes associated with product development.
These procedures involve multiple stages of stress testing under extreme conditions, material certification, and functional testing across various simulated flight scenarios to demonstrate reliability, redundancy, and fail-safe capabilities.
To overcome these formidable regulatory barriers, companies in the aerospace valve sector are increasingly investing in in-house regulatory expertise by hiring dedicated compliance officers, aeronautical engineers, and safety auditors who specialize in international aviation standards.
These professionals guide product development teams through the intricacies of certification requirements, ensuring that valves are designed with compliance in mind from the outset, thereby reducing costly redesigns and delays.
Supply Chain Disruptions and Raw Material Constraints
High-performance materials, such as titanium, stainless steel, and composite alloys, used for valve manufacturing, play a significant role in the aerospace industry and ensure a stable supply. Geopolitical tensions, trade restrictions, and disruptions from events such as the pandemic and economic downturns have led to supply chain bottlenecks, material shortages, and rising procurement costs. To remain strong operationally and cost-effectively, the industry shall need to build plans that are resilient to newer, more local sourcing and alternative materials.
Increasing Demand for Fuel-Efficient and Next-Generation Aircraft
Aerospace valves are going to witness highly attractive market opportunities in the coming years, as engineers are now focusing more on fuel economy, lightweight, and innovative propulsion systems. Sophisticated solutions such as fluid control, gaseous management and fuel management are required in next-generation solutions, including electric, hybrid and the likes of aircraft, presenting lucrative opportunities for manufacturers operating in the aerospace valve market.
The valves market is evolving with a focus on energy-efficient, lightweight, and long-lasting products. Companies investing in the development of these products will experience a competitive edge.
Advancements in Smart Valve Technologies and Predictive Maintenance
Smart sensors and IoT-enabled aerospace valves are revolutionizing aircraft performance monitoring and maintenance procedures. This technology also enables quicker responses to potential failures, thereby minimizing equipment downtime. Smart valves with integrated real-time data analytics, predictive diagnostics, and automated control systems can help drive efficiencies, reduce downtime, and create safer systems.
For manufacturers, leveraging digitalization, real-time AI-based monitoring system and predictive maintenance technologies enables them to tap into new markets and to meet the constant demand for smart aerospace components.
Aerospace Valves Market report is to recognize, explain and forecast the Aerospace Valves Market by type, application, and region. The COVID-19 pandemic, however, had an enormous impact on industrial sectors across the globe, resulting in further delays in supply and manufacturing of aircraft, influencing demand for aerospace valves. To mitigate supply chain risks and maintain production speed, industry players have turned to automation, digital manufacturing, and strategic partnerships.
Between 2025 and 2035, the future trends in the market are forecasted to undergo significant changes, including AI-based valve diagnostics, 3D-printed aerospace components, and green valves. The move to electric and hybrid propulsion systems, featuring landing gear valves on the wing and integration with turbine systems, will encourage innovation in lightweight and high-efficiency valve systems.
Moreover, the rise of autonomous flight systems, along with stricter safety regulations, will drive the need for sophisticated aerospace valves with higher levels of reliability and the ability to be monitored in real-time, thereby fueling the growth of this market.
Market Shifts: A Comparative Analysis (2020 to 2024 vs. 2025 to 2035)
| Market Shift | 2020 to 2024 Trends |
|---|---|
| Regulatory Landscape | Compliance with existing aviation safety regulations |
| Technological Advancements | Growth in automation and precision valve manufacturing |
| Industry Adoption | Increased use of lightweight materials and fuel-efficient designs |
| Supply Chain and Sourcing | Dependence on traditional aerospace material suppliers |
| Market Competition | Dominance of established aerospace valve manufacturers |
| Market Growth Drivers | Rising aircraft deliveries and demand for fuel-efficient systems |
| Sustainability and Energy Efficiency | Initial focus on lightweight, durable valve materials |
| Integration of Smart Monitoring | Limited use of AI and predictive maintenance |
| Advancements in Aerospace Innovation | Adoption of improved hydraulic and pneumatic valve designs |
| Market Shift | 2025 to 2035 Projections |
|---|---|
| Regulatory Landscape | AI-driven compliance monitoring, real-time safety validation, and sustainable valve material mandates |
| Technological Advancements | Expansion of smart aerospace valves with AI-driven diagnostics and IoT-enabled monitoring |
| Industry Adoption | Widespread adoption of electric and hybrid propulsion valves, autonomous flight fluid control systems |
| Supply Chain and Sourcing | Diversification into advanced composites, additive manufacturing, and localized production strategies |
| Market Competition | Rise of startups specializing in smart fluid control solutions and digital twin technology |
| Market Growth Drivers | Expansion of next-generation aircraft, autonomous air mobility, and green aviation initiatives |
| Sustainability and Energy Efficiency | Full-scale transition to eco-friendly, energy-efficient valve solutions with minimal carbon footprint |
| Integration of Smart Monitoring | Full-scale deployment of AI-driven, self-learning aerospace valves with real-time analytics |
| Advancements in Aerospace Innovation | Development of autonomous fluid management systems, bio-inspired valve mechanisms, and AI-powered control systems |

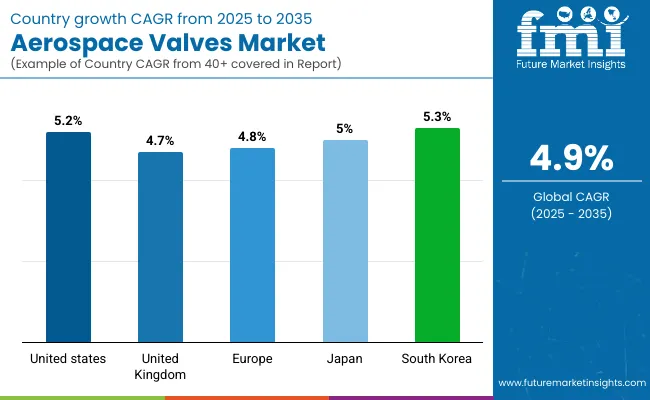
The United States dominates the aerospace valves market in North America owing to its leading aviation and defense industries. Leading aircraft manufacturers and continual improvements in fuel-efficient technologies support the demand for market growth.
The expansion of aircraft valve applications can be attributed to government initiatives aimed at modernizing aircraft fleets and the rising demand for next-generation aerospace components.
| Country | CAGR (2025 to 2035) |
|---|---|
| USA | 5.2% |
In the United Kingdom, the aerospace valves market is driven by the country's robust aerospace sector and commitment to sustainable aviation technologies. The market is also growing due to investments in advanced hydraulic and pneumatic valve systems.
Aerospace Manufacturers are Safer by Collaborating with Research Institutes: To avoid being left behind in the development of aerospace components, research is also proving successful through collaboration between aerospace manufacturers and research institutions.
| Country | CAGR (2025 to 2035) |
|---|---|
| UK | 4.7% |
The European aerospace valves market is dominated by Germany, France and Italy. An uptick in demand for cutting-edge valve technologies is further driven by the region's focus on producing fuel-efficient as well as electric aircraft.
Research funding and carbon-neutral initiatives from the European Union are encouraging next-generation aerospace systems. Furthermore, increasing demand for commercial aircrafts also drives the market growth.
| Region | CAGR (2025 to 2035) |
|---|---|
| European Union (EU) | 4.8% |
Japan, a giant in the fields of aerospace, produces a wide variety of custom-engineered high-precision components for the world valves market. The ever-growing investments in the manufacture of aircraft components and the automation of aerospace systems fuels the demand for advanced valves.
Market growth is a result of the country's strategic cooperation with top aerospace manufacturers and R&D efforts in lightweight valve materials.
| Country | CAGR (2025 to 2035) |
|---|---|
| Japan | 5.0% |
An expanding defense budget and a growing commercial aviation sector are driving growth in South Korea’s aerospace valves market. The country is also heavily investing in domestic aircraft production and high-performance valve technologies.
Additionally, partnerships with global aerospace firms and the introduction of intelligent valve systems for fuel management and hydraulic applications are contributing to market development.
| Country | CAGR (2025 to 2035) |
|---|---|
| South Korea | 5.3% |
Steel and titanium are the primary materials of choice for aerospace valves, due to their exceptional strength, durability, and ability to withstand extreme environments. These are commonly used in commercial and military airframe hydraulic and fuel system components, providing excellent resistance to corrosion and pressure.
They are relatively low-cost and easy to fabricate, making them a favorite for many aerospace applications. Furthermore, steel valves enable precise control of fluid flow, which can prevent many hazardous situations.
Titanium Values As for high-performance applications, and for its benefits in strength-to-weight and high-temperature environments, titanium valves are undoubtedly trending. These valves are essential elements for contemporary aerospace development, particularly found in high-end military aircraft and advanced commercial jet airliners.
Titanium as a durable material with lightweight characteristics allows for resistance to extreme environments, making it an excellent material for the next generation of aerospace valves. Increasing demand for lightweight components in aircraft for fuel efficiency is also a contributing factor for the adoption of titanium valves.
In the aerospace sector, they play a crucial role in preventing reverse fluid flow in hydraulic and fuel systems. Their automated actions minimize the incidence of system failures and enhance the overall efficiency of the aircraft. The aerospace industry uses check valves which are fit for use with fuel lines, hydraulic circuits, as well as environmental control systems. Need for high-performance check valves rising as aircraft become more complex
Pressure control valves are another essential aerospace component, keeping the right amount of fluid pressure within hydraulic, fuel, and pneumatic systems. Selected the range of industrial valves that increase aircraft safety, constant controls drastic variations in pressure, and stability during crucial flight operations, including landing gear, braking systems, and fuel management in engines.
With the introduction of pressure control technology, intelligent, electronically controlled valves have been introduced, broadening the technical application margin of aviation valves.
Increased focus on safety, reliability, and efficiency in aerospace systems drives the growth of the aerospace valves market. For commercial and military aircraft, companies are targeting innovations in electromechanical valves, smart monitoring systems and high-performance materials to improve reliability and efficiency. The main trends include AI-powered diagnostics, additive manufacturing, and the integration of hydraulic and fuel valve systems.
Market Share Analysis by Company
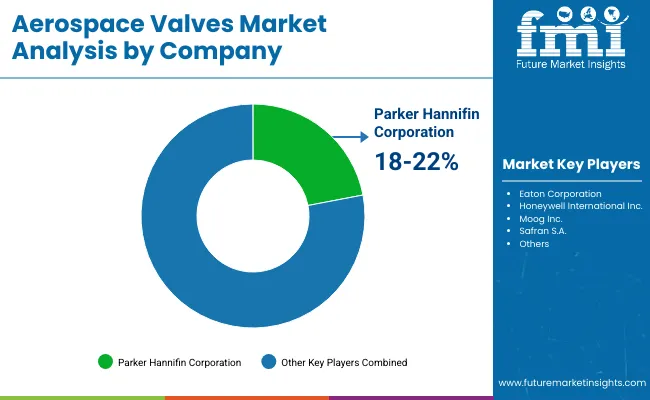
| Company Name | Estimated Market Share (%) |
|---|---|
| Parker Hannifin Corporation | 18-22% |
| Eaton Corporation | 14-18% |
| Honeywell International Inc. | 10-14% |
| Moog Inc. | 8-12% |
| Safran S.A. | 6-10% |
| Other Companies (combined) | 40-50% |
| Company Name | Key Offerings/Activities |
|---|---|
| Parker Hannifin Corporation | Leading provider of hydraulic, pneumatic, and fuel system valves with high durability and efficiency. |
| Eaton Corporation | Focusing on advanced fluid control solutions, utilizes high-performance aerospace valves that serve commercial and military aerospace. |
| Honeywell International Inc. | Creates intelligent valves equipped with artificial intelligence diagnostics, sensors and monitoring systems to improve operational safety. |
| Moog Inc. | Focuses on precision-engineered electromechanical and hydraulic valves for aerospace applications. |
| Safran S.A. | Innovates in lightweight and high-performance aircraft valve solutions with enhanced efficiency. |
Key Company Insights

Parker Hannifin Corporation (18-22%)
Parker Hannifin holds the largest share of the aerospace valves market with an extensive range of hydraulic, fuel, and pneumatic control valves developed for maximum reliability and ruggedness.
Eaton Corporation (14-18%)
Ballast System Solutions | NEW | Eaton offers leading-edge Fluid Management solutions integrated with Smart valve technologies to deliver enhanced efficiency and safety.
Honeywell International Inc. (10-14%)
Honeywell: Leading the way for intelligent aerospace valves with an AI-based predictive maintenance and real-time diagnostics.
Moog Inc. (8-12%)
Moog is your leader in precision-engineered electromechanical and hydraulic systems, providing high-performance and dependable valve systems for a wide range of industrial applications.
Safran S.A. (6-10%)
Lighter, More Efficient Aircraft - the lightweight, aerospace valve solutions from Safran increase fuel efficiency and decrease the weight of the aircraft.
Other Key Players (40-50% Combined)
A number of global and regional aerospace component makers are advancing innovations in fluid control, high-performance materials and smart valve technology. Key players include:
The overall market size for Aerospace valves market is USD 3.2 Billion in 2025.
The Aerospace valves market expected to reach USD 5.2 Billion in 2035.
Factors such as growth in aircraft production, increasing need of fuel-efficient systems, enhancement in hydraulic and pneumatic technologies, increasing air passenger traffic and growing applications in commercial, military and space aviation sectors are driving the growth of the aerospace valves market.
The top 5 countries which drives the development of Aerospace valves market are USA, UK, Europe Union, Japan and South Korea.
Steel and titanium valves growth to command significant share over the assessment period.


Full Research Suite comprises of:
Market outlook & trends analysis
Interviews & case studies
Strategic recommendations
Vendor profiles & capabilities analysis
5-year forecasts
8 regions and 60+ country-level data splits
Market segment data splits
12 months of continuous data updates
DELIVERED AS:
PDF EXCEL ONLINE
Aerospace Fastener Manufacturing Solution Market Size and Share Forecast Outlook 2025 to 2035
Aerospace Fluid Conveyance System Market Size and Share Forecast Outlook 2025 to 2035
Aerospace Adhesives and Sealants Market Size and Share Forecast Outlook 2025 to 2035
Aerospace Forging Materials Market Size and Share Forecast Outlook 2025 to 2035
Aerospace and Defense Cyber Security Market Size and Share Forecast Outlook 2025 to 2035
Aerospace Cold Forgings Market Size and Share Forecast Outlook 2025 to 2035
Aerospace Defense Ducting Market Size and Share Forecast Outlook 2025 to 2035
Aerospace Defense C Class Parts Market Size and Share Forecast Outlook 2025 to 2035
Aerospace Electrical Inserts Market Size and Share Forecast Outlook 2025 to 2035
Aerospace Foams Market Size and Share Forecast Outlook 2025 to 2035
Aerospace Robotics Market Size and Share Forecast Outlook 2025 to 2035
Aerospace Engineering Services Outsourcing (ESO) Market Analysis - Size, Share, and Forecast Outlook (025 to 2035
Aerospace DC-DC Converter Market Analysis - Size, Share, and Forecast Outlook 2025 to 2035
Aerospace Fastener Market Analysis Size Share and Forecast Outlook 2025 to 2035
Aerospace 3D Printing Materials Market Size and Share Forecast Outlook 2025 to 2035
Aerospace Radome Market Size and Share Forecast Outlook 2025 to 2035
Aerospace Interior Market Size and Share Forecast Outlook 2025 to 2035
Aerospace Floor Panels Market Size and Share Forecast Outlook 2025 to 2035
Aerospace Tester Market Size and Share Forecast Outlook 2025 to 2035
Aerospace Landing Gear Market Size and Share Forecast Outlook 2025 to 2035

Thank you!
You will receive an email from our Business Development Manager. Please be sure to check your SPAM/JUNK folder too.
Chat With
MaRIA