

- Market Size (2026)
- USD 720.7 Mn
- Forecast (2036)
- USD 2159.7 Mn
- CAGR (2026 to 2036)
- 11.6%
How big is the Digital GRN Platforms Market in 2026?
USD 720.7 million in 2026 and USD 2,159.7 million by 2036 at a 11.6% CAGR.
Demand for digital GRN platforms is tied to data accuracy and the cost of weak process visibility, with operations leaders, IT teams, and plant managers paying closer attention to integration burden alongside accuracy as they weigh which tools reduce manual reconciliation without adding new complexity to existing systems. Fleet operators and warehouse teams sit alongside these buyers in the same evaluation, since a platform's value depends on whether it turns raw receiving data into a check that operations staff can actually act on day to day. Static reporting or a dashboard nobody references after go-live does little to earn renewed budget the following year.
Uptime and support accountability shape which suppliers make it past initial evaluation, since a platform that goes down during receiving hours creates exactly the manual workaround it was meant to eliminate. Integration cost and the burden of connecting a new platform to existing ERP, warehouse, and fleet systems slow faster adoption, and public installed-base data can frame market size, but individual buyers still need direct proof of deployment quality before committing budget. The clearer opportunities lie in platforms built for lighter integration footprints, mobile-first receiving workflows, and tools that surface exceptions automatically rather than requiring manual review of every record. By deployment model, end-use industry, and platform type, integration complexity and adoption pace differ enough to warrant separate treatment. Regionally, adoption concentrates where warehouse and fleet digitization is already underway, since that existing infrastructure lowers the integration cost of adding a GRN layer on top.
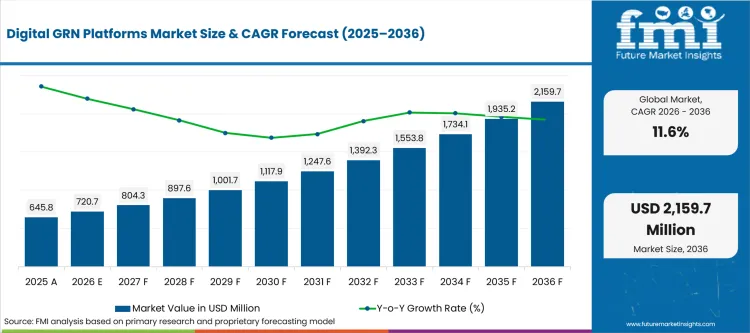
Key Takeaways of Digital GRN Platforms Market
- Demand for digital GRN platforms is driven by operations and procurement teams prioritizing receiving workflow visibility, audit-ready goods documentation, and procurement efficiency.
- By sales channel, direct vendor delivery is expected to lead with 61.8% share in 2026, supported by stronger service response and implementation support.
- Cloud SaaS is the dominant deployment segment, projected to hold 49.5% share in 2026, driven by deployment flexibility and easier system management.
- Standalone GRN platforms are estimated to lead the product category with 38.0% share in 2026, supported by streamlined goods receipt and documentation workflows.
- Documentation quality and post-implementation support remain critical to supplier evaluation, as businesses expand adoption when platforms reduce rework and improve receiving accuracy.
- India and China are expected to form the higher-growth country tier, advancing at 13.88% and 12.88% CAGR respectively through 2036, supported by expanding enterprise digitization and manufacturing scale.
- Competition centers on SAP, Oracle, Microsoft, Infor, Ivalua, Coupa, Basware, GEP, Zycus, and Epicor, with vendors differentiating through workflow automation, platform integration, and enterprise support services.
Analyst Perspective
"The digital GRN platforms market is evolving as organizations modernize goods receipt processes to improve inventory accuracy and operational visibility. Buyers are looking for platforms that integrate smoothly with ERP and warehouse management systems, simplify audit compliance, and reduce manual processing across receiving operations. Vendors that deliver reliable workflow automation, seamless implementation, and ongoing customer success support are well placed to establish long-term relationships as digital supply chain transformation accelerates."
- Nikhil Kaitwade, Principal Consultant for Technology at Future Market Insights
How is the Digital GRN Platforms Market segmented?
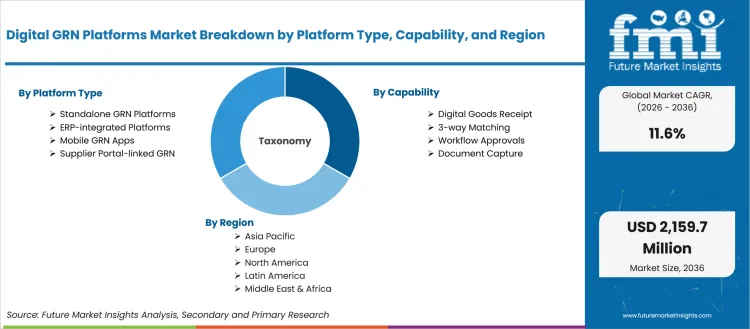
The digital GRN platforms industry is segmented by Platform Type, By Capability and By Deployment; End Use and By Sales Channel complete the forecast structure.
In digital GRN platforms market, segmentation starts with By Platform Type, By Capability and By Deployment. By End Use and By Sales Channel then show where use case, channel role, and geography change the buying case. Shares stay in the segment questions, so this view stays focused on how the market is organized.
How does direct vendor influence buying within by sales channel?
Direct Vendor should be read through buying route and support control. The segment matters when the channel can manage order continuity and service response.
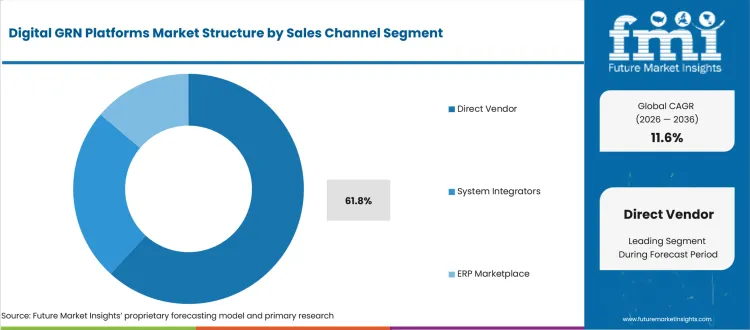
- Direct Vendor represents 61.8% of By Sales Channel in 2026, equal to USD 445.4 million. The segment rises from USD 399.1 million in 2025 to USD 1,334.7 million by 2036. The number matters when the buying route can support service response.
- The executive question is service control in Digital GRN Platforms Market. Buyers need a route that supports receiving workflow visibility and audit-ready goods documentation without slowing adoption.
Where does cloud SaaS create value in the by deployment category?
Cloud SaaS should be read through buying route and support control. The segment matters when the channel can manage order continuity and service response.
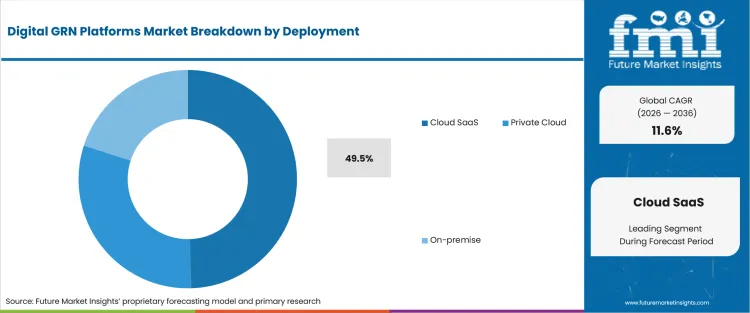
- At USD 356.7 million in 2026, Cloud SaaS holds 49.5% of By Deployment. The value moves from USD 319.7 million in 2025 to USD 1,069.1 million by 2036. Procurement value depends on whether the channel can protect order continuity.
- Digital GRN platforms market sourcing should check who owns the buyer relationship after approval. Weak channel accountability can limit repeat demand.
What keeps standalone GRN platforms relevant within by platform Type?
Standalone GRN Platforms should be read as a handling and usage choice within By Platform Type. Buyers look at storage, blending needs and repeat-order routines before treating the share as a procurement priority.
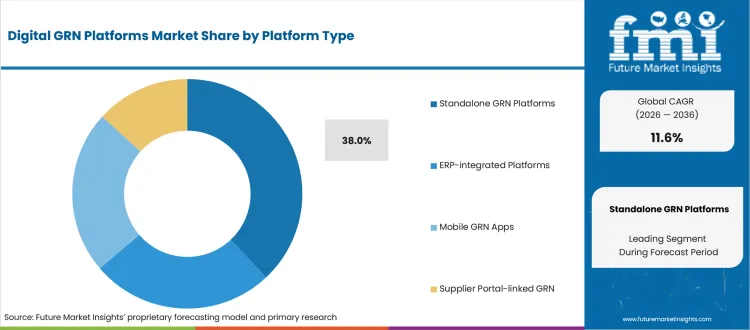
- Standalone GRN Platforms contributes USD 273.9 million in 2026, or 38% of By Platform Type, after a 2025 base of USD 245.4 million. By 2036, the segment is projected at USD 820.7 million. Procurement value depends on whether the format reduces handling friction.
- Procurement should treat the format as an operating choice. Repeat buying depends on handling guidance and stable delivery.
How should buyers read Digital Goods Receipt demand within By Capability?
Digital Goods Receipt demand within By Capability is tied to the workflow the platform is expected to control. Buyers need a defined operating use case before spending expands.
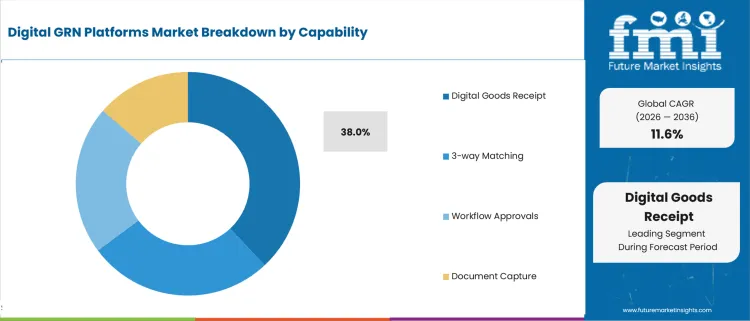
- Digital Goods Receipt accounts for 38% of By Capability in 2026. Its value increases from USD 245.4 million in 2025 to USD 273.9 million in 2026. By 2036, the value is projected at USD 820.7 million. The number matters when it connects to a real buyer problem.
- The buying test is practical in Digital GRN Platforms Market. Procurement needs evidence that the segment solves a real problem tied to receiving workflow visibility and audit-ready goods documentation.
Why is Manufacturing still important in By End Use?
Manufacturing matters within By End Use because the buyer group decides how the product must perform in use. Procurement depends on operating risk and service support after approval.
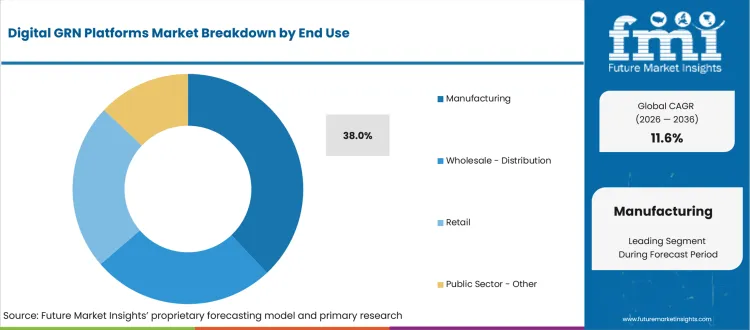
- Manufacturing stands at USD 273.9 million in 2026, equal to 38% of By End Use. It moves from USD 245.4 million in 2025 to USD 820.7 million by 2036. The number matters when the buyer group has a clear operating reason to shift spend.
- Management teams should test whether the segment changes Digital GRN Platforms Market risk or cost. Share alone is weak guidance unless it connects to receiving workflow visibility and audit-ready goods documentation.
What factors shape the Digital GRN Platforms Market?
Digital GRN Platforms Market purchases are being shaped by uptime risk, compliance pressure, lifecycle cost; and integration burden.
- Driver: receiving workflow visibility and audit-ready goods documentation. Demand strengthens when buyers can connect the purchase to a measurable operating, formulation, compliance; or cost outcome in Digital GRN Platforms Market.
- Restraint: proof burden and implementation risk. Adoption slows when Digital GRN Platforms Market buyers cannot validate receiving workflow visibility and audit-ready goods documentation under their own operating conditions.
- Opportunity: supplier programs built around receiving workflow visibility and audit-ready goods documentation. The better opening is with vendors that make approval easier through field support, clear proof, and repeatable execution.
Digital GRN Platforms Market demand is strongest where the product reduces an operating risk that buyers can measure. Engineering and procurement teams need proof that the system improves uptime, compliance, inspection; data accuracy; or service cost before it becomes a standard purchase.
The pressure in Digital GRN Platforms Market is visible when procurement compares technical files with service coverage. Buyers need proof that receiving workflow visibility and audit-ready goods documentation will hold after supplier change.
The friction in Digital GRN Platforms Market appears after approval when ownership is unclear. Suppliers that define support responsibility early can protect receiving workflow visibility and audit-ready goods documentation and compete despite unit-price pressure.
Which country CAGRs are profiled in the Digital GRN Platforms Market?
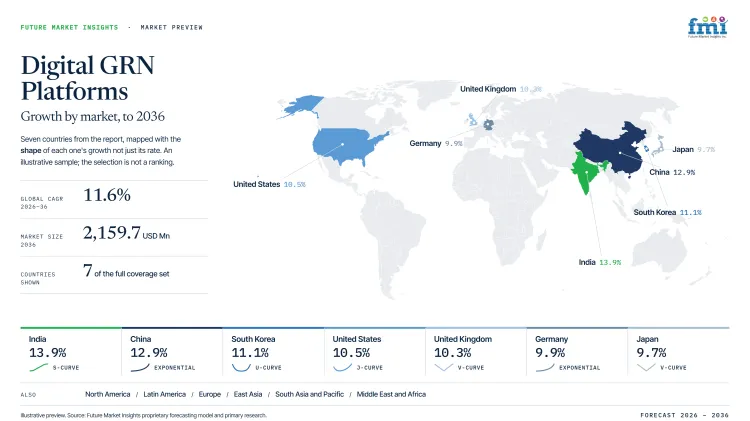
| Country | CAGR |
|---|---|
| United States | 10.48% |
| China | 12.88% |
| India | 13.88% |
| Germany | 9.88% |
| United Kingdom | 10.28% |
| Japan | 9.68% |
| South Korea | 11.08% |
| Rest of World | 12.28% |
How do country-level CAGRs compare in the Digital GRN Platforms Market?
The country comparison stretches across 4.2 percentage points and reveals four identifiable growth bands in the digital GRN platforms market. India and China occupy the highest tier with a 1.0-point difference between them. Rest of World and South Korea follow as the next cluster, separated by 1.2 percentage points. The United States and the United Kingdom remain almost level, while Germany and Japan complete the comparison with only 0.2 percentage points between them. The differences reflect varying levels of warehouse digitalization, ERP integration and adoption of electronic goods receipt workflows.
- India leads the comparison with a CAGR of 13.88%. Expansion of digital supply chain operations and increasing adoption of warehouse management software are encouraging organizations to replace paper-based goods receipt processes with integrated digital GRN platforms.
- Only 1.0 percentage point behind, China records a CAGR of 12.88%. Large manufacturing networks, high warehouse throughput and broader deployment of connected logistics systems continue to strengthen demand for platforms that automate goods receipt verification and inventory updates.
- Rest of World posts a CAGR of 12.28%, standing 0.6 percentage points below China. The combined outlook reflects steady migration toward digital warehouse operations as businesses modernize inventory management and improve visibility across inbound material flows.
- South Korea reaches 11.08%, placing it 1.2 percentage points behind Rest of World. Advanced manufacturing facilities and highly connected distribution networks are creating opportunities for digital GRN solutions that improve receiving accuracy and synchronize warehouse data with enterprise systems.
- The United States registers a CAGR of 10.48%, trailing South Korea by 0.6 percentage points. Demand is associated with wider use of cloud-based warehouse platforms, automated receiving workflows and real-time inventory management across manufacturing, retail and logistics operations.
- Just 0.2 percentage points separate the United Kingdom from the United States, with the market reaching 10.28%. Continued investment in warehouse digitalization and integrated inventory control is supporting the transition toward electronic goods receipt documentation.
- Germany records a CAGR of 9.88%, while Japan follows closely at 9.68%, leaving a gap of only 0.2 percentage points. Germany's position reflects continued investment in industrial digitalization and enterprise software integration, whereas Japan's outlook is linked to automation of warehouse operations and improved inventory traceability across manufacturing facilities.
Comparable CAGRs can still produce different market entry conditions. Differences in warehouse automation, enterprise software adoption, inventory management practices and digital transformation priorities influence implementation timelines and long-term commercial opportunities. The full report provides country-level CAGR analysis across North America, Latin America, Europe, East Asia, South Asia, Oceania and the Middle East and Africa.
Country-wise Analysis
Digital GRN Platforms Market country growth differs by infrastructure maturity, regulatory pressure, installed-base age; and service capability. Mature markets place more weight on specification control and lifecycle cost. Faster-growth markets still need local partners and reliable implementation support.
- Digital GRN platforms market revenue in the United States climbs from USD 155.0 million in 2025 to USD 173.0 million in 2026 and is expected to expand to USD 468.7 million by 2036 at a 10.48% CAGR. This trajectory reflects a market where buyers treat purchasing as a receiving workflow visibility and audit-ready goods documentation decision. Approval typically hinges on measurable operating proof before volume moves away from incumbent suppliers.
- A steady climb marks China's trajectory, from USD 129.2 million in 2025 to USD 144.1 million in 2026, reaching USD 484.3 million in 2036 at a 12.88% CAGR. That pace indicates a market shaped by scale alongside execution discipline. Suppliers here face pressure on availability and channel control, with buyers looking for evidence that receiving workflow visibility and audit-ready goods documentation can hold up across accounts that are ramping quickly.
- In India, the market is estimated at USD 51.66 million in 2025, rising to USD 57.66 million in 2026, and is projected to grow to USD 211.6 million by 2036 at a 13.88% CAGR. Growth here is closely tied to formal procurement cycles and broader production activity, though cost remains a persistent filter for buyers. A supplier's price case has to hold up while still delivering credible receiving workflow visibility and audit-ready goods documentation.
- From USD 58.12 million in 2025, Germany's revenue rises to USD 64.86 million in 2026 and is set to reach USD 166.4 million by 2036 at a 9.88% CAGR. This is a qualification-led market, where technical review determines whether receiving workflow visibility and audit-ready goods documentation can be demonstrated before commercial terms are even discussed.
- Revenue in the United Kingdom advances from USD 32.29 million in 2025 to USD 36.04 million in 2026 and climbs further to USD 95.89 million by 2036 at a 10.28% CAGR. This growth pattern reinforces a buying culture centered on vendor accountability and delivery reliability, where switching costs increase once receiving workflow visibility weakens after a sale closes.
- A gradual expansion defines Japan's market, moving from USD 51.66 million in 2025 to USD 57.66 million in 2026 and forecast to progress to USD 145.3 million by 2036 at a 9.68% CAGR. This steady movement mirrors an approval cycle that favors suppliers able to reduce inspection burden while keeping receiving workflow visibility and audit-ready documentation consistent through repeat orders.
- Between 2025 and 2036, South Korea's revenue moves from USD 25.83 million to USD 28.83 million in 2026 and is likely to advance to USD 82.47 million, at an 11.08% CAGR. Compact domestic supply chains mean feedback loops here move fast, creating conditions where responsive supplier support becomes important since weak execution on receiving workflow visibility could disrupt production schedules.
- Across Rest of World, revenue is set to scale from USD 142.1 million in 2025 and USD 158.6 million in 2026 to USD 505.1 million by 2036 at a 12.28% CAGR. This spread reflects highly uneven regional demand, where local service access and import reliability become decisive in markets where buyers lack mature support networks to draw on for proving audit-ready goods documentation.
Who are the notable companies in the Digital GRN Platforms Market?
SAP; Oracle; Microsoft; Infor; Ivalua; Coupa; Basware; GEP; Zycus and Epicor are the notable companies assessed in this market.
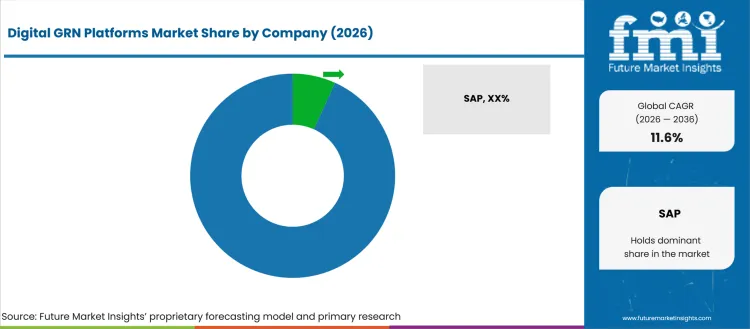
Digital GRN Platforms Market competition is strongest where suppliers can connect technical performance with operating accountability. Buyers compare who can reduce downtime, compliance exposure, inspection burden; or integration risk after purchase.
- ERP and enterprise platforms such as SAP, Oracle, Microsoft and Infor matter when buyers compare supplier fit against the approval burden. Their value depends on evidence quality and service response after selection.
- Procurement and AP automation platforms such as Ivalua, Coupa, Basware and GEP are useful where procurement needs a supplier role that is clear before volume expands. Buyers check whether the group can support the use case after approval.
- Source-to-pay and mid-market platforms such as Zycus and Epicor matter when buyers compare supplier fit against the approval burden. Their value depends on evidence quality and service response after selection.
Competitive Benchmarking: Digital GRN Platforms Market
| Company | Integration Fit | Data Workflow Support | Service Capability | Geographic Footprint |
|---|---|---|---|---|
| SAP | High | High | Strong | Global |
| Oracle | High | Medium | Strong | Global |
| Microsoft | Strong | High | Medium | Global or regional |
| Infor | Medium | High | Medium | Regional |
| Ivalua | Strong | Medium | Medium | Regional or global |
| Coupa | High | High | Strong | Global |
| Basware | High | Medium | Strong | Global |
| GEP | Strong | High | Medium | Global or regional |
| Zycus | Medium | High | Medium | Regional |
| Epicor | Strong | Medium | Medium | Regional or global |
Source: Future Market Insights competitive analysis, 2026. Ratings for Digital GRN Platforms Market reflect specification fit, implementation support, lifecycle service capability; channel reach; and relevance to operating-risk reduction.
Key Players in the Digital GRN Platforms Market
ERP and enterprise platforms
- SAP
- Oracle
- Microsoft
- Infor
Procurement and AP automation platforms
- Ivalua
- Coupa
- Basware
- GEP
Source-to-pay and mid-market platforms
- Zycus
- Epicor
Digital GRN Platforms Market - Report Scope
| Coverage field | Report scope |
|---|---|
| Market breakdown | Digital GRN Platforms Market Breakdown By By Platform Type, By Capability and By Deployment; End Use and By Sales Channel |
| Market Definition | Commercial demand for products; services covered under Digital GRN Platforms Market; including country demand; segment demand; and supplier-selection context |
| Regions Covered | North America; Latin America; Europe; East Asia; South Asia and Pacific; Middle East and Africa |
| Countries Covered | United States; United Kingdom; Germany; France; Japan; China; South Korea; India; and 30+ countries |
| Key Companies Profiled | SAP; Oracle; Microsoft; Infor; Ivalua; Coupa; Basware; GEP; Zycus; and Epicor |
| Forecast Period | 2026 to 2036 |
| Approach | Digital GRN Platforms Market: Installed-base demand, project and replacement cycles, country infrastructure context; segment shares; and supplier relevance were used to build the sizing approach. |
Digital GRN Platforms Market - Research Methodology
| Method | Approach |
|---|---|
| Primary Research | FMI analysts gathered input from manufacturers, service providers, technology developers, distributors, end users, procurement teams, and subject-matter experts. Interviews examined purchasing decisions, product or service evaluation, adoption barriers, approval requirements, pricing considerations, and expectations for technical or commercial support. Respondents were also asked what evidence is required before a trial, pilot, or initial order develops into regular purchasing. |
| Desk Research | Desk research covered government statistics, regulatory publications, trade data, industry associations, technical literature, standards, company filings, product information, and official corporate announcements. Sources were reviewed for relevance, publication date, geographic coverage, and consistency with the defined market scope. Claims relating to performance, applications, approvals, capacity, investment, and commercial activity were retained only when supported by credible public evidence. |
| Market Sizing and Forecasting | The market model combined the baseline value with historical performance, segment structure, pricing and volume indicators, adoption levels, company participation, and country-level demand conditions. Forecast assumptions considered economic activity, investment trends, regulatory developments, technology adoption, purchasing cycles, supply availability, and barriers to wider market use. Segment and regional estimates were reconciled before the final market total was calculated. |
| Data Validation | Estimates were checked against multiple independent indicators, including public data, company activity, trade patterns, industry developments, and findings from primary interviews. Validation also tested whether products, services, applications, and company revenues fell within the defined market boundaries. Adjacent categories, unsupported claims, overlapping revenues, and activities without direct market relevance were excluded to reduce double counting and maintain consistency across segments and countries. |
Digital GRN Platforms Market by Segments
Digital GRN Platforms Market segmented by Platform Type:
- Standalone GRN Platforms
- ERP-integrated Platforms
- Mobile GRN Apps
- Supplier Portal-linked GRN
Digital GRN Platforms Market segmented by Capability:
- Digital Goods Receipt
- 3-way Matching
- Workflow Approvals
- Document Capture
Digital GRN Platforms Market segmented by Deployment:
- Cloud SaaS
- Private Cloud
- On-premise
Digital GRN Platforms Market segmented by End Use:
- Manufacturing
- Wholesale / Distribution
- Retail
- Public Sector / Other
Digital GRN Platforms Market segmented by Sales Channel:
- Direct Vendor
- System Integrators
- ERP Marketplace
Research Sources and Bibliography
Secondary validation for Digital GRN Platforms Market uses logistics evidence, trade facilitation, digital adoption and enterprise-operation sources together. World Bank, WTO, OECD and UNCTAD sources explain why receiving workflows matter. Enterprise data helps test whether digital adoption can support the forecast.
- 1. World Bank Logistics Performance Index. https://lpi.worldbank.org/. Logistics performance context used to compare receiving and supply-chain pressure.
- 2. WTO Trade Facilitation Agreement Facility. https://www.tfafacility.org/. Trade facilitation context used to frame documentation and goods-receipt pressure.
- 3. OECD Digital Economy Outlook. https://www.oecd.org/digital/oecd-digital-economy-outlook-2024-3adf705b-en.htm. Digital adoption context used to read platform readiness.
- 4. UNCTAD Digital Economy. https://unctad.org/topic/ecommerce-and-digital-economy. Digital trade context used to frame enterprise workflow modernization.
- 5. World Bank Enterprise Surveys. https://www.enterprisesurveys.org/. Firm-level operating context used to test digitization and process constraints.
- 6. GS1 Standards. https://www.gs1.org/standards. Non-commercial standards context used to frame goods identification and receiving data consistency.
- 7. SAP. https://www.sap.com/. Official company and product portfolio information used for competitive context.
- 8. Oracle. https://www.oracle.com/. Official company and product portfolio information used for competitive context.
- 9. Microsoft. https://www.microsoft.com/. Official company and product portfolio information used for competitive context.
- 10. Infor. https://www.infor.com/. Official company and product portfolio information used for competitive context.
- 11. Ivalua. https://www.ivalua.com/. Official company and product portfolio information used for competitive context.
- 12. Coupa. https://www.coupa.com/. Official company and product portfolio information used for competitive context.
- 13. Basware. https://www.basware.com/. Official company and product portfolio information used for competitive context.
This Report Answers
- What value is forecast for the Digital GRN Platforms Market in 2026 and by 2036?
- What CAGR is forecast for the Digital GRN Platforms Market during the 2026 to 2036 period?
- Which segment groups are used to assess demand across Digital GRN Platforms Market?
- Which buyer problems are creating procurement interest in Digital GRN Platforms Market?
- How do the main segment shares shape Digital GRN Platforms Market decisions in the 2026 base?
- Which countries are profiled in the Digital GRN Platforms Market forecast and how do their CAGRs differ?
- Which companies are assessed in this market?
- What should Digital GRN Platforms Market buyers evaluate before changing suppliers?
- How does FMI size and validate Digital GRN Platforms Market country and segment demand?
- What risks could delay Digital GRN Platforms Market adoption, qualification, or repeat purchasing?
Frequently Asked Questions
Why should executives track the Digital GRN Platforms Market?
Executives should track Digital GRN Platforms Market because receiving workflow visibility and audit-ready goods documentation affects procurement risk and operating performance. The value is in knowing where the purchase can reduce cost, avoid disruption, or improve buyer confidence.
What business problem does the Digital GRN Platforms Market address?
Digital GRN Platforms Market addresses receiving workflow visibility and audit-ready goods documentation. Buyers use the category when routine procurement cannot protect operating visibility or service accountability.
What should Digital GRN Platforms Market procurement leaders evaluate before selecting suppliers?
Digital GRN Platforms Market procurement leaders should test specification fit, installation burden, service coverage; lifecycle cost; and integration risk. A lower unit price is weak if downtime, commissioning, or maintenance cost rises after purchase.
What can limit return on investment for buyers?
Digital GRN Platforms Market payback depends on whether the product lowers downtime, inspection effort, compliance exposure; rework; or lifecycle cost. Buyers reduce risk by setting acceptance tests and service responsibilities before rollout.
How can suppliers build executive confidence?
Digital GRN Platforms Market suppliers build confidence when they can support specification review, installation, commissioning; and service response after approval. Buyers value partners that keep the system usable in the field.
Preview the report firsthand - request a free sample
Get SampleGet the brochure for pricing and purchase details.
Get PDFTable of Content
- Key Takeaways
- Market Size and CAGR
- Top Growth Driver
- Fastest Growing Segment
- Leading Region
- Key Companies
- Emerging Opportunities
- Executive Summary
- Global Market Outlook
- Demand-side Trends
- Supply-side Trends
- Technology Roadmap Analysis
- Analysis and Recommendations
- Analyst Perspective (What is happening? Why now? What should investors know?)
- Key Questions Answered
- How large is the market?
- What is the CAGR?
- What are key trends?
- Which region dominates?
- Who are the leaders?
- Market Overview
- Market Coverage / Taxonomy
- Market Definition / Scope / Limitations
- Research Methodology
- Chapter Orientation
- Analytical Lens and Working Hypotheses
- Market Structure, Signals, and Trend Drivers
- Benchmarking and Cross-market Comparability
- Market Sizing, Forecasting, and Opportunity Mapping
- Research Design and Evidence Framework
- Desk Research Programme (Secondary Evidence)
- Expert Input and Fieldwork (Primary Evidence)
- Tooling, Models, and Reference Databases
- Data Engineering and Model Build
- Quality Assurance and Audit Trail
- Market Background
- Market Dynamics (Drivers, Restraints, Opportunity, Trends)
- Scenario Forecast (Optimistic, Likely, Conservative)
- Impact Analysis
- AI Impact
- Sustainability Impact
- Regulatory Impact
- Technology Impact
- Consumer / Buyer Analysis
- Purchase Drivers
- Adoption Barriers
- Buyer Journey
- Opportunity Map Analysis
- Product Life Cycle Analysis
- Supply Chain Analysis
- Investment Feasibility Matrix
- Value Chain Analysis
- PESTLE and Porter's Analysis
- Regulatory Landscape
- Regional Parent Market Outlook
- Production and Consumption Statistics
- Import and Export Statistics
- Global Market Analysis and Forecast, 2021 to 2036
- Historical Market Size Value (USD Million) Analysis, 2021 to 2025
- Current and Future Market Size Value (USD Million) Projections, 2026 to 2036
- Y-o-Y Growth Trend Analysis
- Absolute $ Opportunity Analysis
- Global Market Pricing Analysis, 2021 to 2036
- Global Market Analysis and Forecast, By Platform Type, 2021 to 2036
- Introduction / Key Findings
- Historical Market Size Value (USD Million) Analysis By Platform Type, 2021 to 2025
- Current and Future Market Size Value (USD Million) Analysis and Forecast By Platform Type, 2026 to 2036
- Standalone GRN Platforms
- ERP-integrated Platforms
- Mobile GRN Apps
- Supplier Portal-linked GRN
- Standalone GRN Platforms
- Y-o-Y Growth Trend Analysis By Platform Type, 2021 to 2025
- Absolute $ Opportunity Analysis By Platform Type, 2026 to 2036
- Global Market Analysis and Forecast, By Capability, 2021 to 2036
- Introduction / Key Findings
- Historical Market Size Value (USD Million) Analysis By Capability, 2021 to 2025
- Current and Future Market Size Value (USD Million) Analysis and Forecast By Capability, 2026 to 2036
- Digital Goods Receipt
- 3-way Matching
- Workflow Approvals
- Document Capture
- Digital Goods Receipt
- Y-o-Y Growth Trend Analysis By Capability, 2021 to 2025
- Absolute $ Opportunity Analysis By Capability, 2026 to 2036
- Global Market Analysis and Forecast, By Deployment, 2021 to 2036
- Introduction / Key Findings
- Historical Market Size Value (USD Million) Analysis By Deployment, 2021 to 2025
- Current and Future Market Size Value (USD Million) Analysis and Forecast By Deployment, 2026 to 2036
- Cloud SaaS
- Private Cloud
- On-premise
- Cloud SaaS
- Y-o-Y Growth Trend Analysis By Deployment, 2021 to 2025
- Absolute $ Opportunity Analysis By Deployment, 2026 to 2036
- Global Market Analysis and Forecast, By End Use, 2021 to 2036
- Introduction / Key Findings
- Historical Market Size Value (USD Million) Analysis By End Use, 2021 to 2025
- Current and Future Market Size Value (USD Million) Analysis and Forecast By End Use, 2026 to 2036
- Manufacturing
- Wholesale - Distribution
- Retail
- Public Sector - Other
- Manufacturing
- Y-o-Y Growth Trend Analysis By End Use, 2021 to 2025
- Absolute $ Opportunity Analysis By End Use, 2026 to 2036
- Global Market Analysis and Forecast, By Sales Channel, 2021 to 2036
- Introduction / Key Findings
- Historical Market Size Value (USD Million) Analysis By Sales Channel, 2021 to 2025
- Current and Future Market Size Value (USD Million) Analysis and Forecast By Sales Channel, 2026 to 2036
- Direct Vendor
- System Integrators
- ERP Marketplace
- Direct Vendor
- Y-o-Y Growth Trend Analysis By Sales Channel, 2021 to 2025
- Absolute $ Opportunity Analysis By Sales Channel, 2026 to 2036
- Global Market Analysis and Forecast, By Region, 2021 to 2036
- Introduction
- Historical Market Size Value (USD Million) Analysis By Region, 2021 to 2025
- Current Market Size Value (USD Million) Analysis and Forecast By Region, 2026 to 2036
- North America
- Latin America
- Western Europe
- Eastern Europe
- East Asia
- South Asia and Pacific
- Middle East & Africa
- Market Attractiveness Analysis By Region
- North America Market Analysis and Forecast, By Country, 2021 to 2036
- Historical Market Size Value (USD Million) Trend Analysis By Market Taxonomy, 2021 to 2025
- Market Size Value (USD Million) Forecast By Market Taxonomy, 2026 to 2036
- By Country
- USA
- Canada
- By Platform Type
- By Capability
- By Deployment
- By End Use
- By Sales Channel
- By Country
- Market Attractiveness Analysis
- By Country
- By Platform Type
- By Capability
- By Deployment
- By End Use
- By Sales Channel
- Key Takeaways
- Latin America Market Analysis and Forecast, By Country
- Historical Market Size Value (USD Million) Trend Analysis By Market Taxonomy, 2021 to 2025
- Market Size Value (USD Million) Forecast By Market Taxonomy, 2026 to 2036
- By Country
- Brazil
- Mexico
- Chile
- Rest of Latin America
- By Platform Type
- By Capability
- By Deployment
- By End Use
- By Sales Channel
- By Country
- Market Attractiveness Analysis
- By Country
- By Platform Type
- By Capability
- By Deployment
- By End Use
- By Sales Channel
- Key Takeaways
- Western Europe Market Analysis and Forecast, By Country
- Historical Market Size Value (USD Million) Trend Analysis By Market Taxonomy, 2021 to 2025
- Market Size Value (USD Million) Forecast By Market Taxonomy, 2026 to 2036
- By Country
- Germany
- UK
- Italy
- Spain
- France
- Nordic
- BENELUX
- Rest of Western Europe
- By Platform Type
- By Capability
- By Deployment
- By End Use
- By Sales Channel
- By Country
- Market Attractiveness Analysis
- By Country
- By Platform Type
- By Capability
- By Deployment
- By End Use
- By Sales Channel
- Key Takeaways
- Eastern Europe Market Analysis and Forecast, By Country
- Historical Market Size Value (USD Million) Trend Analysis By Market Taxonomy, 2021 to 2025
- Market Size Value (USD Million) Forecast By Market Taxonomy, 2026 to 2036
- By Country
- Russia
- Poland
- Hungary
- Balkan & Baltic
- Rest of Eastern Europe
- By Platform Type
- By Capability
- By Deployment
- By End Use
- By Sales Channel
- By Country
- Market Attractiveness Analysis
- By Country
- By Platform Type
- By Capability
- By Deployment
- By End Use
- By Sales Channel
- Key Takeaways
- East Asia Market Analysis and Forecast, By Country
- Historical Market Size Value (USD Million) Trend Analysis By Market Taxonomy, 2021 to 2025
- Market Size Value (USD Million) Forecast By Market Taxonomy, 2026 to 2036
- By Country
- China
- Japan
- South Korea
- By Platform Type
- By Capability
- By Deployment
- By End Use
- By Sales Channel
- By Country
- Market Attractiveness Analysis
- By Country
- By Platform Type
- By Capability
- By Deployment
- By End Use
- By Sales Channel
- Key Takeaways
- South Asia and Pacific Market Analysis and Forecast, By Country
- Historical Market Size Value (USD Million) Trend Analysis By Market Taxonomy, 2021 to 2025
- Market Size Value (USD Million) Forecast By Market Taxonomy, 2026 to 2036
- By Country
- India
- ASEAN
- Australia & New Zealand
- Rest of South Asia and Pacific
- By Platform Type
- By Capability
- By Deployment
- By End Use
- By Sales Channel
- By Country
- Market Attractiveness Analysis
- By Country
- By Platform Type
- By Capability
- By Deployment
- By End Use
- By Sales Channel
- Key Takeaways
- Middle East & Africa Market Analysis and Forecast, By Country
- Historical Market Size Value (USD Million) Trend Analysis By Market Taxonomy, 2021 to 2025
- Market Size Value (USD Million) Forecast By Market Taxonomy, 2026 to 2036
- By Country
- Kingdom of Saudi Arabia
- Other GCC Countries
- Türkiye
- South Africa
- Other African Union
- Rest of Middle East & Africa
- By Platform Type
- By Capability
- By Deployment
- By End Use
- By Sales Channel
- By Country
- Market Attractiveness Analysis
- By Country
- By Platform Type
- By Capability
- By Deployment
- By End Use
- By Sales Channel
- Key Takeaways
- Key Countries Market Analysis
- USA
- Pricing Analysis
- Market Share Analysis, 2025
- By Platform Type
- By Capability
- By Deployment
- By End Use
- By Sales Channel
- Canada
- Pricing Analysis
- Market Share Analysis, 2025
- By Platform Type
- By Capability
- By Deployment
- By End Use
- By Sales Channel
- Mexico
- Pricing Analysis
- Market Share Analysis, 2025
- By Platform Type
- By Capability
- By Deployment
- By End Use
- By Sales Channel
- Brazil
- Pricing Analysis
- Market Share Analysis, 2025
- By Platform Type
- By Capability
- By Deployment
- By End Use
- By Sales Channel
- Chile
- Pricing Analysis
- Market Share Analysis, 2025
- By Platform Type
- By Capability
- By Deployment
- By End Use
- By Sales Channel
- Germany
- Pricing Analysis
- Market Share Analysis, 2025
- By Platform Type
- By Capability
- By Deployment
- By End Use
- By Sales Channel
- UK
- Pricing Analysis
- Market Share Analysis, 2025
- By Platform Type
- By Capability
- By Deployment
- By End Use
- By Sales Channel
- Italy
- Pricing Analysis
- Market Share Analysis, 2025
- By Platform Type
- By Capability
- By Deployment
- By End Use
- By Sales Channel
- Spain
- Pricing Analysis
- Market Share Analysis, 2025
- By Platform Type
- By Capability
- By Deployment
- By End Use
- By Sales Channel
- France
- Pricing Analysis
- Market Share Analysis, 2025
- By Platform Type
- By Capability
- By Deployment
- By End Use
- By Sales Channel
- India
- Pricing Analysis
- Market Share Analysis, 2025
- By Platform Type
- By Capability
- By Deployment
- By End Use
- By Sales Channel
- ASEAN
- Pricing Analysis
- Market Share Analysis, 2025
- By Platform Type
- By Capability
- By Deployment
- By End Use
- By Sales Channel
- Australia & New Zealand
- Pricing Analysis
- Market Share Analysis, 2025
- By Platform Type
- By Capability
- By Deployment
- By End Use
- By Sales Channel
- China
- Pricing Analysis
- Market Share Analysis, 2025
- By Platform Type
- By Capability
- By Deployment
- By End Use
- By Sales Channel
- Japan
- Pricing Analysis
- Market Share Analysis, 2025
- By Platform Type
- By Capability
- By Deployment
- By End Use
- By Sales Channel
- South Korea
- Pricing Analysis
- Market Share Analysis, 2025
- By Platform Type
- By Capability
- By Deployment
- By End Use
- By Sales Channel
- Russia
- Pricing Analysis
- Market Share Analysis, 2025
- By Platform Type
- By Capability
- By Deployment
- By End Use
- By Sales Channel
- Poland
- Pricing Analysis
- Market Share Analysis, 2025
- By Platform Type
- By Capability
- By Deployment
- By End Use
- By Sales Channel
- Hungary
- Pricing Analysis
- Market Share Analysis, 2025
- By Platform Type
- By Capability
- By Deployment
- By End Use
- By Sales Channel
- Kingdom of Saudi Arabia
- Pricing Analysis
- Market Share Analysis, 2025
- By Platform Type
- By Capability
- By Deployment
- By End Use
- By Sales Channel
- Türkiye
- Pricing Analysis
- Market Share Analysis, 2025
- By Platform Type
- By Capability
- By Deployment
- By End Use
- By Sales Channel
- South Africa
- Pricing Analysis
- Market Share Analysis, 2025
- By Platform Type
- By Capability
- By Deployment
- By End Use
- By Sales Channel
- USA
- Market Structure Analysis
- Competition Dashboard
- Competition Benchmarking
- Market Share Analysis of Top Players
- By Regional
- By Platform Type
- By Capability
- By Deployment
- By End Use
- By Sales Channel
- Emerging Startups
- Innovation Benchmarking
- Competition Analysis
- Competition Deep Dive
- SAP
- Overview
- Product Portfolio
- Profitability by Market Segments
- Sales Footprint
- Strategy Overview
- Marketing Strategy
- Product Strategy
- Channel Strategy
- Oracle
- Microsoft
- Infor
- Ivalua
- Coupa
- Basware
- GEP
- Zycus
- Epicor
- SAP
- Case Studies
- Success Stories
- Recent Developments
- Competition Deep Dive
- Assumptions & Acronyms Used


