

- Market Size (2026)
- USD 5.5 Bn
- Forecast (2036)
- USD 9.6 Bn
- CAGR (2026 to 2036)
- 5.7%
Engine Control Unit Replacement Parts Market Outlook for 2026 to 2036
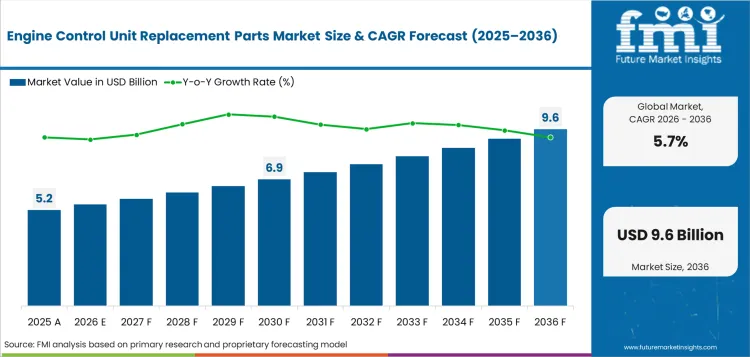
Engine control unit replacement parts market was valued at USD 5.2 billion in 2025 and is expected to reach USD 5.5 billion in 2026. Demand is forecast to reach USD 9.6 billion by 2036 at 5.7% CAGR during the forecast decade. Passenger cars are forecast to account for 58.0% share of vehicle type demand in 2026. Independent aftermarket is anticipated to represent 56.0% share of sales channel demand in 2026.
ECU replacement is becoming a service and software access issue instead of a parts-only sale. Older vehicles are widening the repair base because S&P Global Mobility stated in May 2024 that the average U.S. light vehicle reached 12.6 years and the 6 to 14 year group exceeded 110 million units. Workshops need reliable modules for vehicles that are beyond warranty support.
Regulation shapes the market because 40 CFR §86.1808-01 requires 2004 and later OBD vehicles with reprogramming capability to follow SAE J2534 and makes OEM software applications and calibrations available to aftermarket service providers. That gives independent repair networks a route to replacement work with proper programming capability. Quality proof is becoming the next commercial filter. CARDONE states that critical components are re-soldered or replaced at its Philadelphia plant and each engine control module is 100% computer tested. That supports remanufactured ECU use in repair channels that need lower return risk.
Summary of the Engine Control Unit Replacement Parts Market
- Demand and Growth Drivers
- Engine control units are becoming more important in vehicle repair because they manage fuel use and engine response. A failed unit can affect starting and emissions checks.
- Older vehicles create steady replacement demand as engine bay heat can damage electronic parts over time. Repair workshops need parts that fit correctly and work after coding.
- Service centers are using scan tools before replacing control units. Clear fault checks help them avoid wrong repairs and reduce repeat visits.
- Product and Segment View
- Remanufactured ECUs are useful for older vehicles because they cost less than new units. Workshops prefer tested parts when the repair value must stay reasonable.
- Passenger cars create regular demand because they are used every day and face frequent engine checks. Light commercial vehicles add demand when downtime affects daily operations.
- Independent aftermarket channels serve many older vehicles after warranty coverage ends. Distributors with accurate part matching can support faster repair work.
- Geography and Competitive Outlook
- India and China have stronger demand potential because vehicle ownership is expanding and repair networks are improving. Workshops in both countries need more coded replacement parts.
- The United States has steady replacement demand due to its large vehicle stock and developed service network. Germany and Japan need tested parts because repair quality standards are high.
- Suppliers with tested ECUs and simple coding support will be preferred by repair outlets. Companies with core return programs can control cost better in remanufactured parts.
- Analyst Opinion
- Nikhil Kaitwade, Principal Consultant at FMI says, “Engine control unit replacement has become a coded repair decision for workshops. A module must match the vehicle and clear diagnostic faults after installation. Suppliers with tested reman units and clean core return flow will be preferred by repair outlets during the forecast decade.”
- Engine Control Unit Replacement Parts Market Value Analysis
- The engine control unit replacement parts market is moving from simple module replacement into a more service-focused repair field.
- Market value is supported by older vehicles as heat and moisture can damage engine bay electronics over time.
- The market reflects coded ECU replacement as workshops need modules prepared for immobilizer and emissions checks.
- Remanufactured units add value because repair costs stay lower and distributors get repeat core returns.
- Suppliers with testing and programming support can serve workshops more effectively as ECU replacement becomes more diagnosis based.
Key Takeaways Market Size and Forecast
- Engine control unit replacement parts demand was valued at USD 5.2 billion in 2025.
- Industry value is expected to reach USD 9.6 billion by 2036.
- Market value is forecast to rise at 5.7% CAGR from 2026 to 2036.
- Incremental opportunity is expected to reach USD 4.1 billion over the forecast decade.
- Passenger cars are forecast to account for 58.0% share of vehicle type demand in 2026.
- Independent aftermarket is anticipated to represent 56.0% share of sales channel demand in 2026.
- India at 7.1% CAGR and China at 6.6% CAGR are expected to lead country-level expansion by 2036.
Engine Control Unit Replacement Parts Market Definition
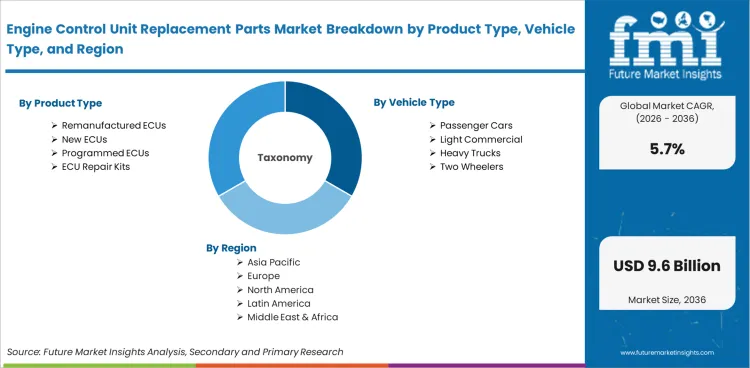
Engine control unit replacement parts cover new, remanufactured, and programmed control modules used to restore engine fuel control, ignition timing, emissions readiness, and drivability after ECU failure in passenger cars, light commercial vehicles, heavy trucks, and two wheelers.
Engine Control Unit Replacement Parts Market Inclusions
Scope includes remanufactured ECUs, new ECUs, programmed ECUs, ECU repair kits, powertrain control modules, module exchange services, board repair, coding support, core return programs, independent aftermarket supply, OEM service parts, online retail, and distributor-led replacement channels. Key stakeholders include automakers, Tier 1 electronics suppliers, remanufacturers, parts distributors, repair workshops, fleet operators, online parts sellers, and diagnostic tool providers.
Engine Control Unit Replacement Parts Market Exclusions
Scope excludes infotainment controllers, body control modules, airbag control units, battery management systems, tuning-only software, general wiring harnesses, loose connectors, sensors sold separately, diagnostic tools, and repair labor unless bundled with a replacement ECU service package.
Engine Control Unit Replacement Parts Market Research Methodology
- Primary Research: FMI analysts reviewed aftermarket suppliers and remanufacturing specialists across major automotive service countries.
- Desk Research: Public data from vehicle production bodies and dealer service sources was checked against replacement activity.
- Market Sizing and Forecasting: Market size was built from vehicles in operation and failure incidence. Average module price and reman share assumptions were used for checks.
- Data Validation: Forecast checks compared ECU replacement value with vehicle registrations and repair order volume.
Why is the Engine Control Unit Replacement Parts Market Expanding?
- Engine control unit replacement demand is expected to rise at a 5.7% CAGR as vehicles depend more on software for fuel use and engine response. A failed ECU can affect starting along with acceleration and emissions readiness.
- Older vehicles create steady replacement need because engine bay heat can damage electronic boards over time. Repair workshops need tested modules since wrong coding can keep the vehicle from starting.
- Hybrid vehicles keep ECU replacement value high because combustion engines still need accurate control. The automotive sensors field supports the same repair route as workshops check sensors before replacing control modules.
Electric vehicle adoption is changing powertrain repair. ECU replacement need will not disappear during the forecast decade. The International Energy Agency reported electric car sales above 20.0 million in 2025, with electric cars representing nearly 25.0% of new car sales. Hybrid vehicles carry combustion engines, so fuel control and emissions checks stay important. Repair outlets need parts that can match software settings after installation. Suppliers with coded modules and clear fitting support reduce return issues for workshops.
Market Segmentation Analysis
- Remanufactured ECUs are expected to hold 46.0% share of product type demand in 2026.
- In 2026, passenger cars are forecast to account for 58.0% share.
- Gasoline engines are anticipated to represent 49.0% share of engine type demand in 2026.
- A 56.0% share is expected for independent aftermarket in 2026.
- Direct replacement is forecast to account for 52.0% share by 2026.
Engine control unit replacement parts demand is segmented by product type including remanufactured ECUs and new ECUs, with programmed ECUs and ECU repair kits included. Vehicle type covers passenger cars and light commercial vehicles, with heavy trucks and two wheelers included. Engine type covers gasoline engines and diesel engines, with hybrid engines and CNG engines included. Sales channel covers independent aftermarket and OEM service, with online retail and core exchange included. Repair type covers direct replacement and reprogramming, with board repair and module exchange included. Region completes the segmentation.
Insights into Engine Control Unit Replacement Parts Market by Product Type
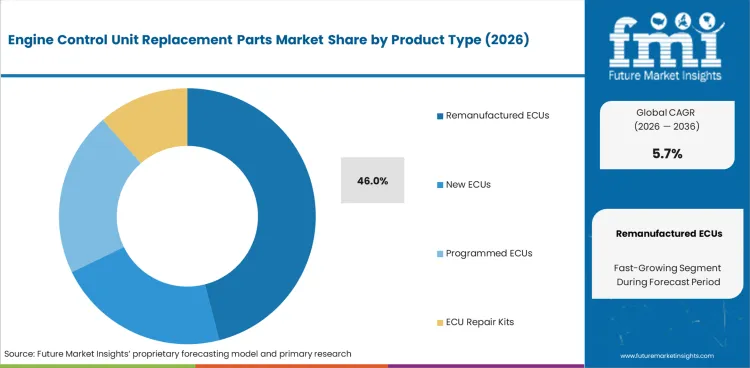
- • Remanufactured ECUs are expected to account for 46.0% share in 2026 as older vehicles need lower-cost modules after warranty support ends. Tested units help workshops complete repairs without adding the full cost of a new ECU.
- • New ECUs and programmed ECUs serve repairs in which coding accuracy is important. Electronic control unit in automotive systems is witnessing demand as newer vehicles depend more on software-led engine control.
Insights into Engine Control Unit Replacement Parts Market by Vehicle Type
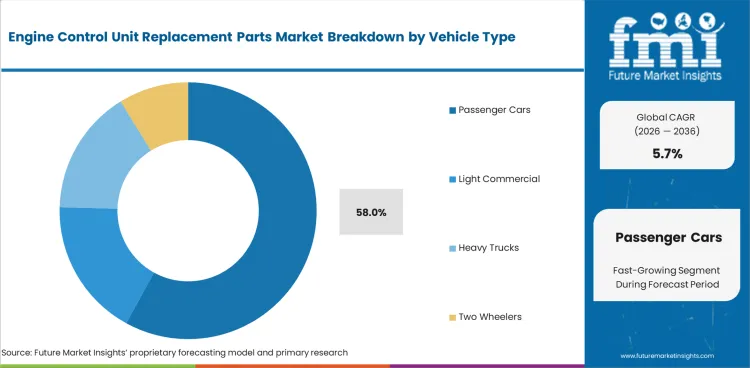
- • Passenger cars are anticipated to hold 58.0% share in 2026 due to daily use and frequent engine checks. Regular driving raises the chance of heat-related ECU failure over time.
- • Light commercial vehicles add steady demand as downtime can affect daily work. Fleet repair outlets need replacement modules that fit quickly and reduce repeat workshop visits.
Insights into Engine Control Unit Replacement Parts Market by Engine Type
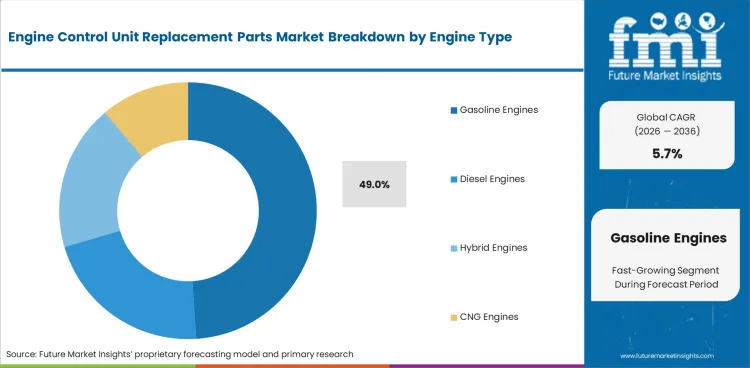
- • Gasoline engines are expected to represent 49.0% share in 2026 as spark ignition vehicles depend on ECU control for fuel timing and engine response. Faulty modules can affect starting and emissions readiness.
- • Diesel and hybrid engines need accurate control because fuel delivery and emissions checks are more sensitive. The role of automotive sensors is important here as workshops often check sensor faults before replacing the ECU.
Insights into Engine Control Unit Replacement Parts Market by Sales Channel
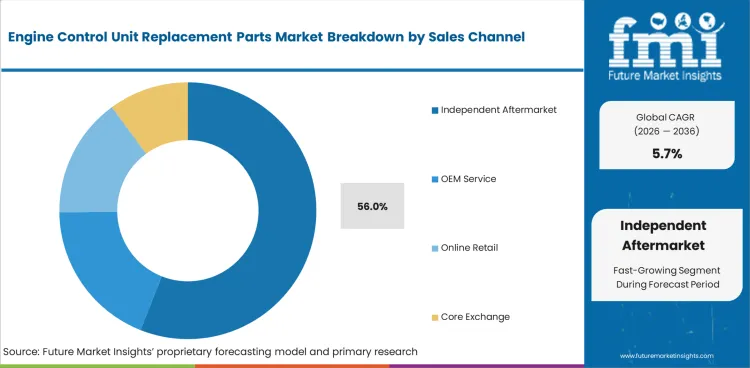
- • Independent aftermarket is forecast to capture 56.0% share in 2026 as many older vehicles move outside dealer service networks. Repair outlets prefer suppliers with clear part matching and simple coding support.
- • OEM service channels remain important for newer vehicles and warranty-linked repair work. Dealer networks need original-fit modules when software matching and vehicle security checks are strict.
Insights into Engine Control Unit Replacement Parts Market by Repair Type
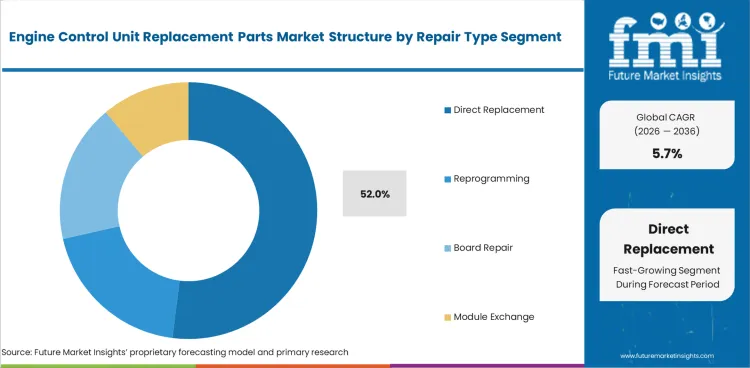
- • Direct replacement is expected to account for 52.0% share in 2026 as workshops prefer service-ready modules. A coded replacement can save time when the vehicle must return to use quickly.
- • Reprogramming and board repair serve cases where the original ECU can still be restored. Automotive performance tuning and engine remapping services is relevant here, as engine software knowledge becomes more useful in repair work.
Engine Control Unit Replacement Parts Market Drivers Restraints and Opportunities
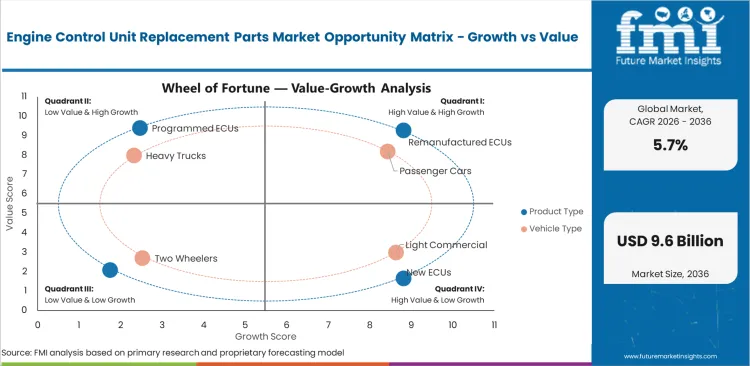
- Diagnostic coding is lifting demand for programmed ECUs because replacement modules must match the vehicle before repair work is complete.
- Security-locked software can slow independent repair because some vehicles need approved access before a new ECU can pair correctly.
- Core return programs allow remanufacturers to control cost because failed modules can be tested and rebuilt for future repair use.
Scan Tool Coding Improves Replacement Accuracy
ECU replacement has become a diagnosis-first repair because modern vehicles use software to control engine behavior. The National Automobile Dealers Association reported more than 276.0 million dealer repair orders in 2025, and service and parts sales above USD 164.0 billion. Large repair activity gives suppliers room to offer coded modules with simple fault-check steps. Scan tools reduce wrong-part orders because workshops can confirm the controller fault before replacement. The automotive performance tuning and engine remapping services field reflects the same shift toward engine software knowledge.
Software Access Can Slow Independent Repair
Modern ECUs often need security approval before the replacement part can work with the vehicle. Immobilizer pairing and emissions readiness checks can delay repair if the workshop lacks the right access. A correct part number alone is no longer enough for many vehicles. Repair outlets need suppliers that provide coding guidance and clean technical documents. The over-the-air engine control module adds more software depth as vehicle updates affect service work.
Core Return Programs Support Remanufactured ECU Supply
Core return programs give remanufacturers a practical supply route. Failed ECUs can be collected and returned to the market as lower-cost replacements. CARDONE uses reverse engineering and computer testing for remanufactured engine control modules. Cost control improves when distributors recover failed units instead of relying only on new parts. Reman suppliers with board testing and coding support can protect margins in older vehicle repair.
Analysis of Engine Control Unit Replacement Parts Market by Key Countries
.webp "Top Country Growth Comparison Engine Control Unit Replacement Parts Market Cagr (2026 2036)")
| Country | CAGR |
|---|---|
| United States | 5.4% |
| China | 6.6% |
| India | 7.1% |
| Germany | 4.8% |
| Japan | 4.5% |
| United Kingdom | 5.0% |
| Brazil | 6.2% |
Source: Future Market Insights, 2026.
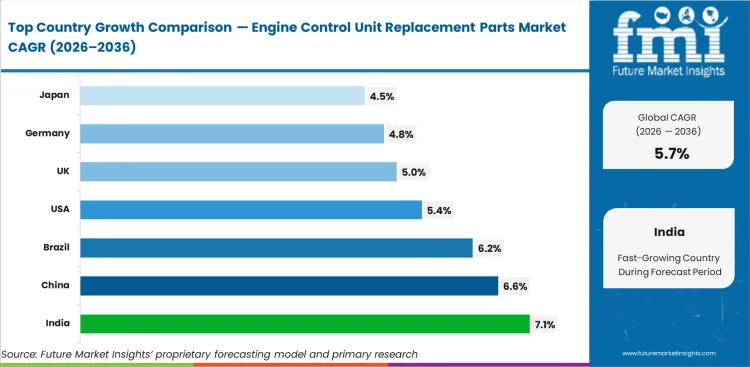
Engine Control Unit Replacement Parts Market CAGR Analysis by Country
- India is expected to record 7.1% CAGR by 2036 as expanding vehicle registrations increase ECU replacement need.
- China is forecast to rise at 6.6% CAGR during the forecast decade as high vehicle output expands the future repair pool.
- Brazil is expected to post 6.2% CAGR by 2036 as flex-fuel fleets support engine electronics service.
- The market in the United States is expected to expand at 5.4% CAGR through 2036.
- United Kingdom is forecast at 5.0% CAGR by 2036 as low-emission diagnostics raise module programming need.
- Germany is expected to advance at 4.8% CAGR through 2036.
- A 4.5% CAGR is anticipated in Japan by 2036 as inspection norms support selective replacement.
Demand Outlook for Engine Control Unit Replacement Parts Market in the United States
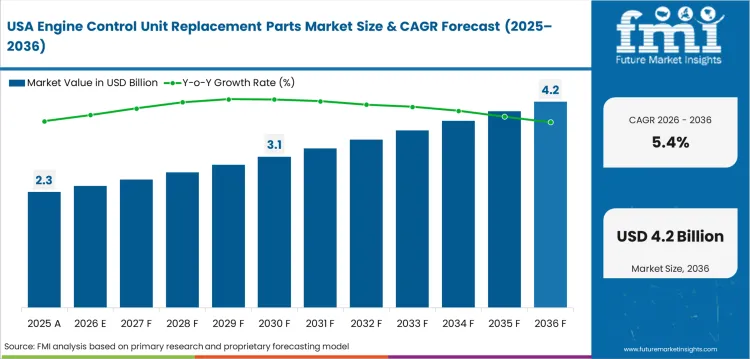
United States demand is supported by a large vehicle stock and a mature repair network. The Federal Highway Administration reported 297.5 million registered motor vehicles in 2024. The market in the United States is expected to expand at 5.4% CAGR through 2036 as older vehicles create more electronic repair work. Dealer service centers handle diagnosis-heavy jobs. Independent garages serve many post-warranty vehicles that need lower-cost reman modules.
- Emissions checks support demand for ECUs that restore onboard diagnostic readiness.
- Light trucks create steady replacement need across gasoline and diesel engine control modules.
- National distributors need accurate catalogs and fast core return handling.
Sales Analysis of Engine Control Unit Replacement Parts Market in China
China has a large repair pool because vehicle production has stayed high. The State Council reported vehicle production above 31.2 million units from January to November 2025. China is forecast to rise at 6.6% CAGR during the forecast decade as more vehicles move into post-warranty repair. Domestic brands are adding more software into engine and powertrain control. ECU suppliers need local application coverage and support for the automotive zonal gateway ECU shift in newer vehicle networks.
- Domestic vehicle brands need wider replacement coverage as older models enter independent repair.
- Connected diagnostics raise the need for clean software matching after ECU installation.
- High vehicle output creates future demand for programmed modules and reman units.
Demand Analysis of Engine Control Unit Replacement Parts Market in India
India is moving toward higher ECU replacement value as vehicle ownership expands and workshops add scan tools. By 2036, India is expected to record 7.1% CAGR as coded module availability improves. The International Organization of Motor Vehicle Manufacturers said India produced 6.49 million vehicles in 2025. Domestic sales crossed 4.6 million passenger vehicles in fiscal 2025 to 2026. Suppliers need affordable reman units with simple fitting notes for small garages.
- Emissions readiness checks support ECU replacement when fault codes affect inspection results.
- Passenger cars and light commercial vehicles create steady repair demand for control modules.
- Small garages need easy coding guidance to reduce wrong repairs and return risk.
Opportunity Analysis of Engine Control Unit Replacement Parts Market in Germany
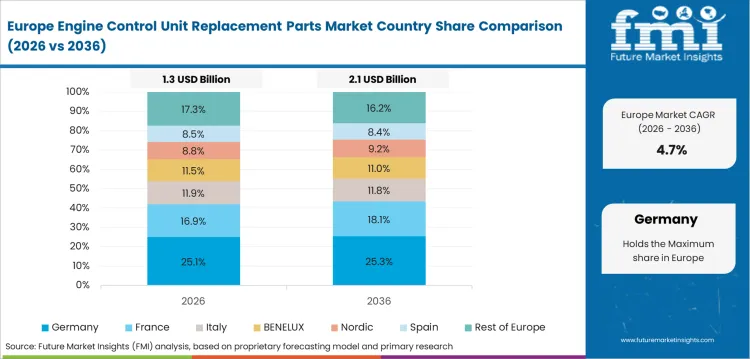
Germany has a service market that values tested parts and clean repair proof. The Association of International Motor Vehicle Manufacturers reported 2.9 million passenger car registrations in 2025, up 1.4% from 2024. Germany is expected to advance at 4.8% CAGR through 2036 as repair outlets handle higher-value engine electronics. Workshops need modules with reliable software matching and fault-free performance after installation. T
- Higher repair standards support demand for tested ECU replacements.
- Gasoline and diesel fleets need modules tied to emissions and drivability faults.
- Reman suppliers must prove reliability before distributors expand stocked coverage.
Future Outlook for Engine Control Unit Replacement Parts Market in Japan
Japan favors precise repair work because service outlets focus on reliability and low repeat faults. Japan is anticipated to expand at a CAGR of 4.5% by 2036 as inspection needs support selective replacement. The Japan Automobile Manufacturers Association reported 8.2 million motor vehicles produced in 2024 in its 2025 industry review. Domestic production depth supports controller knowledge and replacement quality. Compact vehicles create demand for accurate part matching and tested modules.
- Inspection norms support replacement parts that clear fault codes correctly.
- Compact vehicles need accurate catalogs with model-specific ECU coverage.
- Repair outlets prefer tested units because repeat faults can reduce workshop trust.
Demand Outlook for Engine Control Unit Replacement Parts Market in the United Kingdom
The United Kingdom is forecast at 5.0% CAGR by 2036 as repair outlets handle petrol and hybrid vehicles together. United Kingdom demand is shaped by emissions checks and mixed powertrain repair. The Department for Transport reported 124,000 zero-emission cars first registered in the third quarter of 2025. Registrations rose 21.0% from the same quarter in 2024. Workshops need software-aware repair guidance as vehicle control systems become more connected.
- Annual MOT emissions checks make onboard diagnostic readiness important after ECU replacement.
- Independent workshops need accurate part numbers for older passenger car repairs.
- Mixed powertrain fleets increase the need for clear programming support.
In-depth Analysis of Engine Control Unit Replacement Parts Market in Brazil
Brazil offers a distinct replacement route because flex-fuel vehicles need accurate engine control. Adoption in Brazil is anticipated to expand at 6.2% CAGR during the forecast decade. Brazil’s Ministry of Transport listed national vehicle fleet data for 2025 through SENATRAN. A large national fleet creates regular service workshop work as vehicles age beyond warranty. Flex-fuel systems need calibrated control over ethanol blends and cold-start behavior.
- Flex-fuel repair supports ECU replacement tied to fuel trim and cold-start performance.
- Used vehicles create demand for lower-cost reman modules in independent repair outlets.
- Regional service networks need modules matched to local calibration needs.
Competitive Landscape and Strategic Positioning
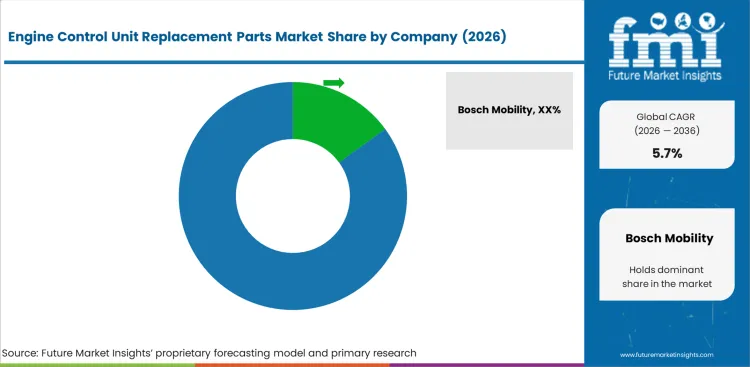
- Competition is centered on accurate part matching and coding support, as a replacement ECU must work with the vehicle after installation.
- Original equipment electronics suppliers hold an advantage through engine control knowledge and access to original vehicle programs.
- Reman specialists build their position with core return handling and tested modules that lower repair cost for older vehicles.
Competitive positioning depends on replacement accuracy and repair support. Bosch Mobility holds a broad position in engine management because its ECU controls fuel and air functions. Original equipment system knowledge supports complex replacement work where calibration and fault checks must match. DENSO competes from a broad vehicle electronics portfolio and supports control systems across many vehicle programs. AUMOVIO supports aftermarket electronics through spare parts suited for vehicle repair needs.
Aftermarket specialists serve repair outlets that need fast part matching and practical support. Standard Motor Products supplies vehicle control parts for repair channels. Dorman Products adds aftermarket repair solutions for older vehicles. CARDONE supports reman ECUs through reverse engineering and computer testing. Suppliers with tested parts and simple coding guidance can reduce returns and protect distributor trust.
Key Companies in the Engine Control Unit Replacement Parts Market
- Global Electronics Suppliers: Bosch Mobility and DENSO Corporation hold strong positions through engine control knowledge and OE program exposure. AUMOVIO SE supports aftermarket electronics after the VDO brand return.
- Aftermarket Replacement Specialists: Standard Motor Products and Dorman Products build their position through broad catalog coverage. CARDONE Industries adds reman testing and distributor access.
- Powertrain Controller Specialists: BorgWarner supports engine and machine controller demand in heavy-duty and off-highway applications.
Competitive Benchmarking: Engine Control Unit Replacement Parts Market
| Company | Calibration Coverage | Core Program Depth | Programming Support | Geographic Footprint |
|---|---|---|---|---|
| Bosch Mobility | High | Medium | High | Global with European strength |
| DENSO Corporation | High | Medium | High | Global with Japanese strength |
| AUMOVIO SE | Medium | Medium | Medium | Europe and global aftermarket |
| Standard Motor Products | Medium | High | Medium | North America centered |
| Dorman Products | Medium | Medium | Medium | North America centered |
| CARDONE Industries | Medium | High | Medium | North America aftermarket |
| BorgWarner Inc. | High | Low | Medium | Global powertrain base |
Source: Future Market Insights competitive analysis, 2026.
Key Developments in Engine Control Unit Replacement Parts Market
- In April 2026, BorgWarner extended a controller business contract with a major off-highway manufacturer.
- In November 2025, AUMOVIO said VDO would return to the automotive aftermarket for electronics and mechatronics spare parts from December 2025.
Key Players in the Engine Control Unit Replacement Parts Market
Major Global Players
- Bosch Mobility
- DENSO Corporation
- AUMOVIO SE
- BorgWarner Inc.
Aftermarket and Remanufacturing Specialists
- Standard Motor Products Inc.
- Dorman Products Inc.
- CARDONE Industries
Report Scope and Coverage
| Parameter | Details |
|---|---|
| Quantitative Units | USD 5.5 billion to USD 9.6 billion at 5.7% CAGR |
| Market Definition | Engine control unit replacement parts used in vehicle repair and service channels |
| Regions Covered | North America, Latin America, Western Europe, Eastern Europe, East Asia, South Asia Pacific, Middle East, Africa. |
| Countries Covered | United States, China, India, Germany, Japan, United Kingdom, Brazil. |
| Key Companies Profiled | Bosch Mobility, DENSO Corporation, AUMOVIO SE, Standard Motor Products, Dorman Products, CARDONE Industries, BorgWarner. |
| Forecast Period | 2026 to 2036 |
| Approach | Hybrid bottom-up and top-down sizing using vehicle parc, failure incidence, reman share and service channel checks |
Source: Future Market Insights, 2026.
Engine Control Unit Replacement Parts Market Breakdown by Product Type Vehicle Type Engine Type Sales Channel Repair Type and Region
Engine Control Unit Replacement Parts Market Segmented by Product Type
- Remanufactured ECUs
- New ECUs
- Programmed ECUs
- ECU Repair Kits
Engine Control Unit Replacement Parts Market Segmented by Vehicle Type
- Passenger Cars
- Light Commercial
- Heavy Trucks
- Two Wheelers
Engine Control Unit Replacement Parts Market Segmented by Engine Type
- Gasoline Engines
- Diesel Engines
- Hybrid Engines
- CNG Engines
Engine Control Unit Replacement Parts Market Segmented by Sales Channel
- Independent Aftermarket
- OEM Service
- Online Retail
- Core Exchange
Engine Control Unit Replacement Parts Market Segmented by Repair Type
- Direct Replacement
- Reprogramming
- Board Repair
- Module Exchange
Engine Control Unit Replacement Parts Market by Region
- North America
- Latin America
- Western Europe
- Eastern Europe
- East Asia
- South Asia and Pacific
- Middle East and Africa
Research Sources and Bibliography
- 40 C.F.R. § 86.1808-01. (2026). Maintenance instructions. Electronic Code of Federal Regulations.
- International Energy Agency. (2026, May 20). Trends in electric cars. In Global EV Outlook 2026. IEA
- National Automobile Dealers Association. (2026). NADA Data: 2025 full-year report. NADA.
- Federal Highway Administration. (2026, January). State motor-vehicle registrations—2024: Table MV-1. U.S. Department of Transportation.
- State Council of the People’s Republic of China. (2025, December 11). China’s auto output, sales both exceed 31 mln units in Jan–Nov.
- International Organization of Motor Vehicle Manufacturers. (2026, April 23). Auto industry growth shifted east in 2025 amid global repositioning. OICA.
- Society of Indian Automobile Manufacturers. (2026, April 14). Auto industry performance of Q4 Jan–March 2026 and FY 2025–26. SIAM.
- Association of International Motor Vehicle Manufacturers. (2026, January 6). New registrations: Strong finish to 2025—significant increase in BEVs among international registrations. VDIK.
- Japan Automobile Manufacturers Association. (2025, September 26). The motor industry of Japan 2025. JAMA.
- Department for Transport. (2026, January 15). Vehicle licensing statistics, United Kingdom: July to September 2025. GOV.UK.
- Ministry of Transport of Brazil. (2025, February 17; updated 2026, March 30). Frota de Veículos - 2025. Gov.br.
- BorgWarner Inc. (2026, April 21). BorgWarner extends controller business with world-leading off-highway manufacturer. BorgWarner.
- AUMOVIO. (2025, November 20). Tradition meets future: AUMOVIO brings VDO back to the automotive aftermarket. AUMOVIO.
This Report Answers
- Which value is expected for engine control unit replacement parts in 2026?
- What value is forecast for engine control unit replacement parts demand by 2036?
- What CAGR is expected for the market from 2026 to 2036?
- Which product type is expected to hold the leading share in 2026?
- Which vehicle type is forecast to account for the strongest replacement demand in 2026?
- Which countries are expected to expand faster than the global average by 2036?
- How do remanufacturing and core exchange affect supplier margins?
- Which companies are active and valid for ECU replacement parts supply?
- How was market size built and checked against public vehicle data?
Frequently Asked Questions
What is the engine control unit replacement parts market size in 2026?
Engine control unit replacement parts demand is expected to reach USD 5.5 billion in 2026.
What is the forecast value of the engine control unit replacement parts market by 2036?
Industry value is forecast to reach USD 9.6 billion by 2036 across replacement and remanufactured ECU demand.
What CAGR is expected for engine control unit replacement parts demand?
Demand is expected to rise at 5.7% CAGR from 2026 to 2036 as coded replacement work carries higher service value.
Which product type leads the market?
Remanufactured ECUs are expected to hold 46.0% share in 2026 due to cost control and tested replacement availability.
Which sales channel leads ECU replacement parts demand?
Independent aftermarket is anticipated to represent 56.0% share in 2026 as older vehicles move into non-dealer repair outlets.
Which countries are forecast to expand faster than global demand?
India and China are forecast above the 5.7% global CAGR by 2036. Brazil is also above the global rate due to fleet expansion.
Preview the report firsthand - request a free sample
Get SampleGet the brochure for pricing and purchase details.
Get PDFTable of Content
- Key Takeaways
- Market Size and CAGR
- Top Growth Driver
- Fastest Growing Segment
- Leading Region
- Key Companies
- Emerging Opportunities
- Executive Summary
- Global Market Outlook
- Demand-side Trends
- Supply-side Trends
- Technology Roadmap Analysis
- Analysis and Recommendations
- Analyst Perspective (What is happening? Why now? What should investors know?)
- Key Questions Answered
- How large is the market?
- What is the CAGR?
- What are key trends?
- Which region dominates?
- Who are the leaders?
- Market Overview
- Market Coverage / Taxonomy
- Market Definition / Scope / Limitations
- Research Methodology
- Chapter Orientation
- Analytical Lens and Working Hypotheses
- Market Structure, Signals, and Trend Drivers
- Benchmarking and Cross-market Comparability
- Market Sizing, Forecasting, and Opportunity Mapping
- Research Design and Evidence Framework
- Desk Research Programme (Secondary Evidence)
- Expert Input and Fieldwork (Primary Evidence)
- Tooling, Models, and Reference Databases
- Data Engineering and Model Build
- Quality Assurance and Audit Trail
- Market Background
- Market Dynamics (Drivers, Restraints, Opportunity, Trends)
- Scenario Forecast (Optimistic, Likely, Conservative)
- Impact Analysis
- AI Impact
- Sustainability Impact
- Regulatory Impact
- Technology Impact
- Consumer / Buyer Analysis
- Purchase Drivers
- Adoption Barriers
- Buyer Journey
- Opportunity Map Analysis
- Product Life Cycle Analysis
- Supply Chain Analysis
- Investment Feasibility Matrix
- Value Chain Analysis
- PESTLE and Porter's Analysis
- Regulatory Landscape
- Regional Parent Market Outlook
- Production and Consumption Statistics
- Import and Export Statistics
- Global Market Analysis and Forecast, 2021 to 2036
- Historical Market Size Value (USD Billion) & Volume (Unit) Analysis, 2021 to 2025
- Current and Future Market Size Value (USD Billion) & Volume (Unit) Projections, 2026 to 2036
- Y-o-Y Growth Trend Analysis
- Absolute $ Opportunity Analysis
- Global Market Pricing Analysis, 2021 to 2036
- Global Market Analysis and Forecast, By Product Type, 2021 to 2036
- Introduction / Key Findings
- Historical Market Size Value (USD Billion) & Volume (Unit) Analysis By Product Type, 2021 to 2025
- Current and Future Market Size Value (USD Billion) & Volume (Unit) Analysis and Forecast By Product Type, 2026 to 2036
- Remanufactured ECUs
- New ECUs
- Programmed ECUs
- ECU Repair Kits
- Remanufactured ECUs
- Y-o-Y Growth Trend Analysis By Product Type, 2021 to 2025
- Absolute $ Opportunity Analysis By Product Type, 2026 to 2036
- Global Market Analysis and Forecast, By Vehicle Type, 2021 to 2036
- Introduction / Key Findings
- Historical Market Size Value (USD Billion) & Volume (Unit) Analysis By Vehicle Type, 2021 to 2025
- Current and Future Market Size Value (USD Billion) & Volume (Unit) Analysis and Forecast By Vehicle Type, 2026 to 2036
- Passenger Cars
- Light Commercial
- Heavy Trucks
- Two Wheelers
- Passenger Cars
- Y-o-Y Growth Trend Analysis By Vehicle Type, 2021 to 2025
- Absolute $ Opportunity Analysis By Vehicle Type, 2026 to 2036
- Global Market Analysis and Forecast, By Engine Type, 2021 to 2036
- Introduction / Key Findings
- Historical Market Size Value (USD Billion) & Volume (Unit) Analysis By Engine Type, 2021 to 2025
- Current and Future Market Size Value (USD Billion) & Volume (Unit) Analysis and Forecast By Engine Type, 2026 to 2036
- Gasoline Engines
- Diesel Engines
- Hybrid Engines
- CNG Engines
- Gasoline Engines
- Y-o-Y Growth Trend Analysis By Engine Type, 2021 to 2025
- Absolute $ Opportunity Analysis By Engine Type, 2026 to 2036
- Global Market Analysis and Forecast, By Sales Channel, 2021 to 2036
- Introduction / Key Findings
- Historical Market Size Value (USD Billion) & Volume (Unit) Analysis By Sales Channel, 2021 to 2025
- Current and Future Market Size Value (USD Billion) & Volume (Unit) Analysis and Forecast By Sales Channel, 2026 to 2036
- Independent Aftermarket
- OEM Service
- Online Retail
- Core Exchange
- Independent Aftermarket
- Y-o-Y Growth Trend Analysis By Sales Channel, 2021 to 2025
- Absolute $ Opportunity Analysis By Sales Channel, 2026 to 2036
- Global Market Analysis and Forecast, By Repair Type, 2021 to 2036
- Introduction / Key Findings
- Historical Market Size Value (USD Billion) & Volume (Unit) Analysis By Repair Type, 2021 to 2025
- Current and Future Market Size Value (USD Billion) & Volume (Unit) Analysis and Forecast By Repair Type, 2026 to 2036
- Direct Replacement
- Reprogramming
- Board Repair
- Module Exchange
- Direct Replacement
- Y-o-Y Growth Trend Analysis By Repair Type, 2021 to 2025
- Absolute $ Opportunity Analysis By Repair Type, 2026 to 2036
- Global Market Analysis and Forecast, By Region, 2021 to 2036
- Introduction
- Historical Market Size Value (USD Billion) & Volume (Unit) Analysis By Region, 2021 to 2025
- Current Market Size Value (USD Billion) & Volume (Unit) Analysis and Forecast By Region, 2026 to 2036
- North America
- Latin America
- Western Europe
- Eastern Europe
- East Asia
- South Asia and Pacific
- Middle East & Africa
- Market Attractiveness Analysis By Region
- North America Market Analysis and Forecast, By Country, 2021 to 2036
- Historical Market Size Value (USD Billion) & Volume (Unit) Trend Analysis By Market Taxonomy, 2021 to 2025
- Market Size Value (USD Billion) & Volume (Unit) Forecast By Market Taxonomy, 2026 to 2036
- By Country
- USA
- Canada
- Mexico
- By Product Type
- By Vehicle Type
- By Engine Type
- By Sales Channel
- By Repair Type
- By Country
- Market Attractiveness Analysis
- By Country
- By Product Type
- By Vehicle Type
- By Engine Type
- By Sales Channel
- By Repair Type
- Key Takeaways
- Latin America Market Analysis and Forecast, By Country
- Historical Market Size Value (USD Billion) & Volume (Unit) Trend Analysis By Market Taxonomy, 2021 to 2025
- Market Size Value (USD Billion) & Volume (Unit) Forecast By Market Taxonomy, 2026 to 2036
- By Country
- Brazil
- Chile
- Rest of Latin America
- By Product Type
- By Vehicle Type
- By Engine Type
- By Sales Channel
- By Repair Type
- By Country
- Market Attractiveness Analysis
- By Country
- By Product Type
- By Vehicle Type
- By Engine Type
- By Sales Channel
- By Repair Type
- Key Takeaways
- Western Europe Market Analysis and Forecast, By Country
- Historical Market Size Value (USD Billion) & Volume (Unit) Trend Analysis By Market Taxonomy, 2021 to 2025
- Market Size Value (USD Billion) & Volume (Unit) Forecast By Market Taxonomy, 2026 to 2036
- By Country
- Germany
- UK
- Italy
- Spain
- France
- Nordic
- BENELUX
- Rest of Western Europe
- By Product Type
- By Vehicle Type
- By Engine Type
- By Sales Channel
- By Repair Type
- By Country
- Market Attractiveness Analysis
- By Country
- By Product Type
- By Vehicle Type
- By Engine Type
- By Sales Channel
- By Repair Type
- Key Takeaways
- Eastern Europe Market Analysis and Forecast, By Country
- Historical Market Size Value (USD Billion) & Volume (Unit) Trend Analysis By Market Taxonomy, 2021 to 2025
- Market Size Value (USD Billion) & Volume (Unit) Forecast By Market Taxonomy, 2026 to 2036
- By Country
- Russia
- Poland
- Hungary
- Balkan & Baltic
- Rest of Eastern Europe
- By Product Type
- By Vehicle Type
- By Engine Type
- By Sales Channel
- By Repair Type
- By Country
- Market Attractiveness Analysis
- By Country
- By Product Type
- By Vehicle Type
- By Engine Type
- By Sales Channel
- By Repair Type
- Key Takeaways
- East Asia Market Analysis and Forecast, By Country
- Historical Market Size Value (USD Billion) & Volume (Unit) Trend Analysis By Market Taxonomy, 2021 to 2025
- Market Size Value (USD Billion) & Volume (Unit) Forecast By Market Taxonomy, 2026 to 2036
- By Country
- China
- Japan
- South Korea
- By Product Type
- By Vehicle Type
- By Engine Type
- By Sales Channel
- By Repair Type
- By Country
- Market Attractiveness Analysis
- By Country
- By Product Type
- By Vehicle Type
- By Engine Type
- By Sales Channel
- By Repair Type
- Key Takeaways
- South Asia and Pacific Market Analysis and Forecast, By Country
- Historical Market Size Value (USD Billion) & Volume (Unit) Trend Analysis By Market Taxonomy, 2021 to 2025
- Market Size Value (USD Billion) & Volume (Unit) Forecast By Market Taxonomy, 2026 to 2036
- By Country
- India
- ASEAN
- Australia & New Zealand
- Rest of South Asia and Pacific
- By Product Type
- By Vehicle Type
- By Engine Type
- By Sales Channel
- By Repair Type
- By Country
- Market Attractiveness Analysis
- By Country
- By Product Type
- By Vehicle Type
- By Engine Type
- By Sales Channel
- By Repair Type
- Key Takeaways
- Middle East & Africa Market Analysis and Forecast, By Country
- Historical Market Size Value (USD Billion) & Volume (Unit) Trend Analysis By Market Taxonomy, 2021 to 2025
- Market Size Value (USD Billion) & Volume (Unit) Forecast By Market Taxonomy, 2026 to 2036
- By Country
- Kingdom of Saudi Arabia
- Other GCC Countries
- Türkiye
- South Africa
- Other African Union
- Rest of Middle East & Africa
- By Product Type
- By Vehicle Type
- By Engine Type
- By Sales Channel
- By Repair Type
- By Country
- Market Attractiveness Analysis
- By Country
- By Product Type
- By Vehicle Type
- By Engine Type
- By Sales Channel
- By Repair Type
- Key Takeaways
- Key Countries Market Analysis
- USA
- Pricing Analysis
- Market Share Analysis, 2025
- By Product Type
- By Vehicle Type
- By Engine Type
- By Sales Channel
- By Repair Type
- Canada
- Pricing Analysis
- Market Share Analysis, 2025
- By Product Type
- By Vehicle Type
- By Engine Type
- By Sales Channel
- By Repair Type
- Mexico
- Pricing Analysis
- Market Share Analysis, 2025
- By Product Type
- By Vehicle Type
- By Engine Type
- By Sales Channel
- By Repair Type
- Brazil
- Pricing Analysis
- Market Share Analysis, 2025
- By Product Type
- By Vehicle Type
- By Engine Type
- By Sales Channel
- By Repair Type
- Chile
- Pricing Analysis
- Market Share Analysis, 2025
- By Product Type
- By Vehicle Type
- By Engine Type
- By Sales Channel
- By Repair Type
- Germany
- Pricing Analysis
- Market Share Analysis, 2025
- By Product Type
- By Vehicle Type
- By Engine Type
- By Sales Channel
- By Repair Type
- UK
- Pricing Analysis
- Market Share Analysis, 2025
- By Product Type
- By Vehicle Type
- By Engine Type
- By Sales Channel
- By Repair Type
- Italy
- Pricing Analysis
- Market Share Analysis, 2025
- By Product Type
- By Vehicle Type
- By Engine Type
- By Sales Channel
- By Repair Type
- Spain
- Pricing Analysis
- Market Share Analysis, 2025
- By Product Type
- By Vehicle Type
- By Engine Type
- By Sales Channel
- By Repair Type
- France
- Pricing Analysis
- Market Share Analysis, 2025
- By Product Type
- By Vehicle Type
- By Engine Type
- By Sales Channel
- By Repair Type
- India
- Pricing Analysis
- Market Share Analysis, 2025
- By Product Type
- By Vehicle Type
- By Engine Type
- By Sales Channel
- By Repair Type
- ASEAN
- Pricing Analysis
- Market Share Analysis, 2025
- By Product Type
- By Vehicle Type
- By Engine Type
- By Sales Channel
- By Repair Type
- Australia & New Zealand
- Pricing Analysis
- Market Share Analysis, 2025
- By Product Type
- By Vehicle Type
- By Engine Type
- By Sales Channel
- By Repair Type
- China
- Pricing Analysis
- Market Share Analysis, 2025
- By Product Type
- By Vehicle Type
- By Engine Type
- By Sales Channel
- By Repair Type
- Japan
- Pricing Analysis
- Market Share Analysis, 2025
- By Product Type
- By Vehicle Type
- By Engine Type
- By Sales Channel
- By Repair Type
- South Korea
- Pricing Analysis
- Market Share Analysis, 2025
- By Product Type
- By Vehicle Type
- By Engine Type
- By Sales Channel
- By Repair Type
- Russia
- Pricing Analysis
- Market Share Analysis, 2025
- By Product Type
- By Vehicle Type
- By Engine Type
- By Sales Channel
- By Repair Type
- Poland
- Pricing Analysis
- Market Share Analysis, 2025
- By Product Type
- By Vehicle Type
- By Engine Type
- By Sales Channel
- By Repair Type
- Hungary
- Pricing Analysis
- Market Share Analysis, 2025
- By Product Type
- By Vehicle Type
- By Engine Type
- By Sales Channel
- By Repair Type
- Kingdom of Saudi Arabia
- Pricing Analysis
- Market Share Analysis, 2025
- By Product Type
- By Vehicle Type
- By Engine Type
- By Sales Channel
- By Repair Type
- Türkiye
- Pricing Analysis
- Market Share Analysis, 2025
- By Product Type
- By Vehicle Type
- By Engine Type
- By Sales Channel
- By Repair Type
- South Africa
- Pricing Analysis
- Market Share Analysis, 2025
- By Product Type
- By Vehicle Type
- By Engine Type
- By Sales Channel
- By Repair Type
- USA
- Market Structure Analysis
- Competition Dashboard
- Competition Benchmarking
- Market Share Analysis of Top Players
- By Regional
- By Product Type
- By Vehicle Type
- By Engine Type
- By Sales Channel
- By Repair Type
- Emerging Startups
- Innovation Benchmarking
- Competition Analysis
- Competition Deep Dive
- Bosch Mobility
- Overview
- Product Portfolio
- Profitability by Market Segments (Product/Region/Sales Channel)
- Sales Footprint
- Strategy Overview
- Marketing Strategy
- Product Strategy
- Channel Strategy
- DENSO Corporation
- AUMOVIO SE
- Standard Motor Products
- Dorman Products
- CARDONE Industries
- BorgWarner Inc.
- Bosch Mobility
- Case Studies
- Success Stories
- Recent Developments
- Competition Deep Dive
- Assumptions & Acronyms Used


