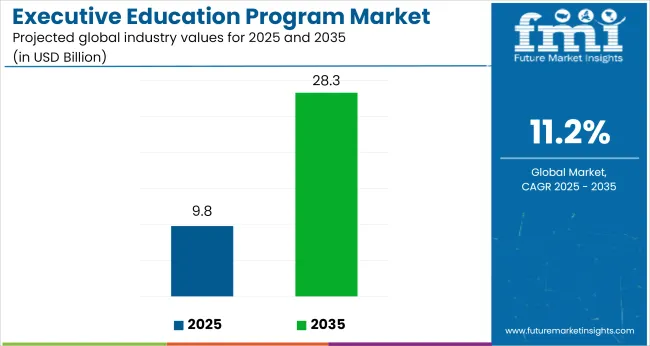
The executive education program market is projected to grow from USD 9.8 billion in 2025 to USD 28.3 billion by 2035, registering a CAGR of 11.2%. Growth is being led by demand for leadership transition tracks, strategic thinking modules, and data-centric decision frameworks tailored for senior executives.
| Metric | Value |
|---|---|
| Industry Value (2025) | USD 9.8 billion |
| Forecast Value (2035) | USD 28.3 billion |
| Global CAGR (2025 to 2035) | 11.2% |
Hybrid formats account for over 40% of delivery, with asynchronous learning forming nearly a third of total instruction time. Face-to-face formats, which dropped to 14% during 2020 to 2021, have rebounded to over 60% by 2024. Internal corporate academies are partnering with universities to deliver modular, credit-bearing programs aligned to enterprise KPIs.
Emeritus, and the Aresty Institute of Executive Education at the University of Pennsylvania's Wharton School announced the start of their six-month Emerging Chief Operating Officer (COO) Program in January 2025. The program's goal is to give prospective COOs the abilities they need to oversee intricate operational tasks, support strategic expansion, and handle changing organizational dynamics.
The cohort's enrollment period began on March 27, 2025. The curriculum covers topics including risk management, leadership communication, and data-driven decision-making, and it combines online learning with optional in-person networking (Wharton Executive Education, 2025).
Driven by leadership-focused programs, the market for executive education programs makes up an estimated 6.2% of the corporate training industry. It accounts for around 4.8% of the professional development market, mostly through C-suite preparedness modules. With a focus on non-degree and certificate offerings, it accounts for over 3.5% of the higher education services industry. Driven by blended and virtual learning formats, it holds a 2.1% market share in EdTech and online learning.
The market share for business consulting and advisory services is roughly 1.6%, mostly due to strategic capability-building and leadership development workshops. The specialized but expanding significance of executive education across overlapping segments is reflected in these shares.
Per-capita spending in executive education is increasingly tied to digital upskilling, global leadership demands, and ROI-based learning objectives. Companies are allocating substantial budgets toward hybrid and outcome-linked executive programs.
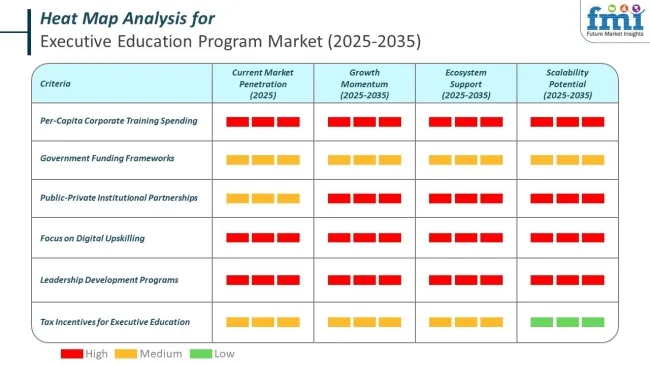
Governments across both developed and developing economies have recognized the strategic importance of executive education in driving productivity, digital transformation, and leadership renewal. Public funding frameworks, tax incentives, and institutional partnerships are being deployed to make high-impact upskilling accessible for mid-to-senior professionals.
The industry will be primarily shaped by demand for customized programs, in-person learning, mid-level leadership development, and finance-focused courses. Programs lasting 1 week to 1 month will remain attractive for working professionals, while group learning formats will dominate delivery methods. Institutions are diversifying formats and curricula to align with corporate talent strategies across sectors such as finance, healthcare, and technology.
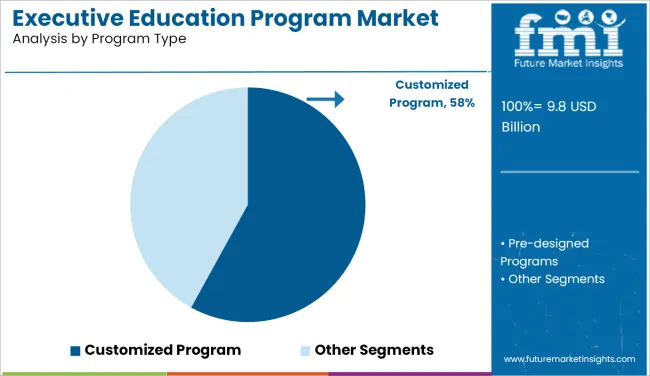
In 2025, customized programs are expected to make up 58% of the market. Because these programs are created with particular organizational objectives in mind, businesses are able to match material with internal strategies, beliefs, and difficulties.
Because they provide flexibility in terms of distribution, location, and duration, they are appealing to businesses that oversee multinational teams. Because of their capacity to produce quantifiable results and their relevance to current business objectives, customized solutions are preferred.
Organizations like Harvard Business School and INSEAD have developed robust portfolios centered on customized programs that offer leadership development pathways that tackle challenging organizational transformations, strategy execution, and innovation cycles.
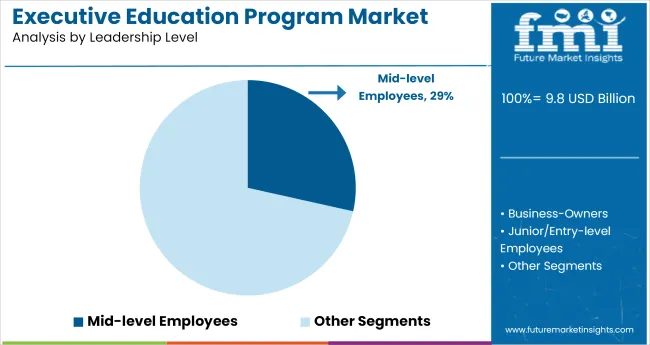
Mid-level employees are expected to hold a 29% share in 2025. Programs that educate employees for more responsibility are receiving funding as businesses create succession pipelines. These programs emphasize critical skills like cross-functional cooperation, people leadership, and operational planning.
The development of mid-level professionals is a strategic objective since they are seen as essential linkages between executive vision and implementation. In order to help businesses close leadership gaps and provide internal development possibilities in competitive conditions, schools such as Wharton and London Business School are developing focused programs that bridge the move to senior jobs.
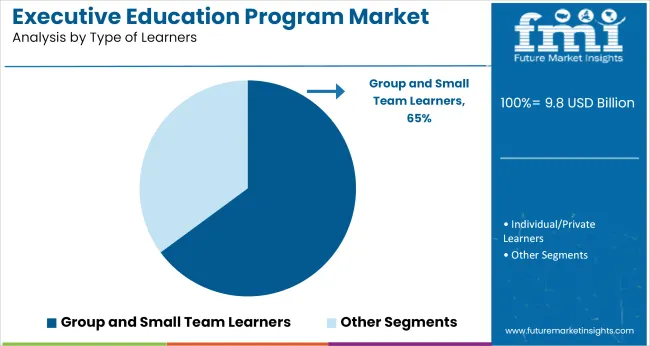
Group and small team learners are expected to contribute 65% share in 2025. Organizations are increasingly favoring cohort-based formats that foster collaboration, shared learning, and joint problem-solving. These models support peer-to-peer insight exchange and encourage application of new skills in live team contexts.
Corporate clients see value in synchronizing learning outcomes across teams to improve coordination and strategic alignment. Providers such as MIT Sloan and Stanford GSB are offering formats that involve business simulations, real-case consulting projects, and cross-functional challenge solving. The group learning model is preferred for its relevance to real workplace dynamics.
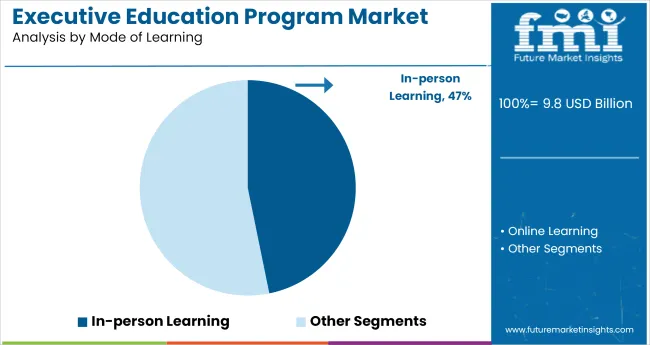
In-person learning is expected to account for 47% share in 2025. This format remains popular for its immersive experience, direct faculty interaction, and opportunities for peer networking. Executives value the depth and engagement of face-to-face environments, particularly for leadership development, negotiation, and strategic thinking courses.
Institutions such as Columbia Business School and Kellogg School of Management continue to support in-person delivery with campus-based modules, real-time workshops, and leadership labs. While digital formats grow in parallel, in-person education continues to be prioritized for high-level participants seeking executive presence and cultural immersion.
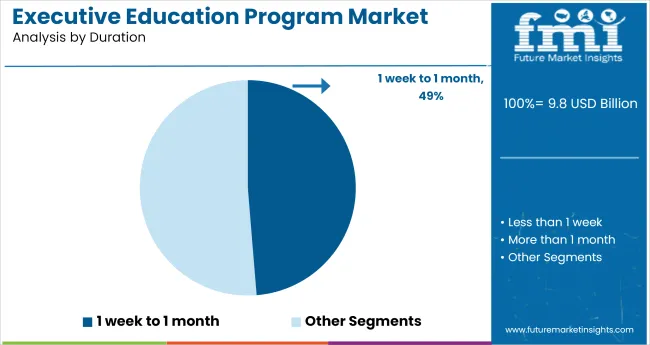
Programs lasting between 1 week and 1 month are projected to represent 49% share in 2025. These short-duration formats appeal to professionals seeking to upgrade skills without extended work absences. Companies also prefer shorter commitments when scaling training across multiple teams or regions.
The format allows for concentrated learning with immediate application in work settings. Institutions like University of California, Berkeley and London Business School are increasing short-term offerings, covering topics such as digital transformation, strategy, and team leadership. These time-bound courses help professionals stay competitive while maintaining work continuity and cost efficiency.
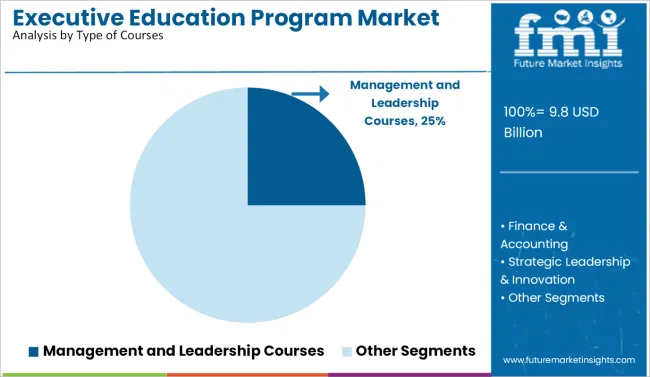
Management and leadership courses are forecast to hold 25% share by 2025. These courses remain core offerings as businesses prioritize agility, decision-making, and organizational influence. Programs are structured to enhance executive communication, conflict resolution, and strategic vision, particularly for roles demanding cross-border or multi-team oversight. Business schools such as INSEAD and Harvard have structured their portfolios around these content pillars, delivering role-relevant leadership modules.
Professionals from fast-growing industries and transformation-driven sectors often prefer these courses for developing their leadership style and building executive presence, especially in environments marked by rapid technological and competitive shifts.
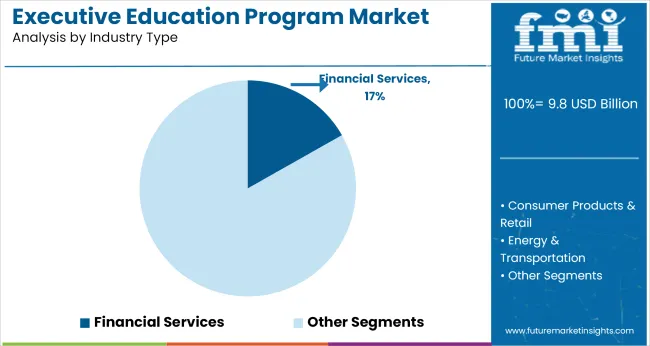
Financial services are expected to represent a 17% share in 2025. The complexity of regulatory changes, fintech integration, and global risk management continues to reshape learning priorities within the sector. Financial institutions are investing in up skilling mid- and senior-level managers to address innovation-led disruption, operational compliance, and capital optimization.
Programs at Columbia Business School and University of Chicago Booth are being tailored for professionals in investment banking, asset management, and insurance. These institutions offer courses that focus on leadership in high-stakes financial environments, with content spanning valuation strategy, regulatory frameworks, digital assets, and financial decision-making.
The executive education program industry is driven by the rising demand for leadership development and skill enhancement across industries. Technological advancements, such as online and hybrid learning, are expanding accessibility. However, challenges such as high program costs, time constraints, and competition from alternative learning platforms impact industry growth.
The demand for executive education programs is driven by the increasing need for skilled leaders capable of adapting to dynamic conditions. Specialized training is sought by executives to enhance leadership and decision-making abilities. Technological advancements in online and hybrid learning formats are expanding the reach of these programs. Industries like finance, technology, and healthcare invest in customized education to ensure leaders possess the relevant skills to navigate rapid changes within their sectors.
High program costs present a major barrier to entry, especially for smaller companies and professionals with limited budgets. Time constraints also challenge professionals, as many are unwilling to commit to lengthy programs. The rise of alternative learning platforms like MOOCs and self-paced online courses provides affordable, flexible options, further intensifying competition. These challenges make it difficult for traditional executive education providers to maintain their dominance in the industry.
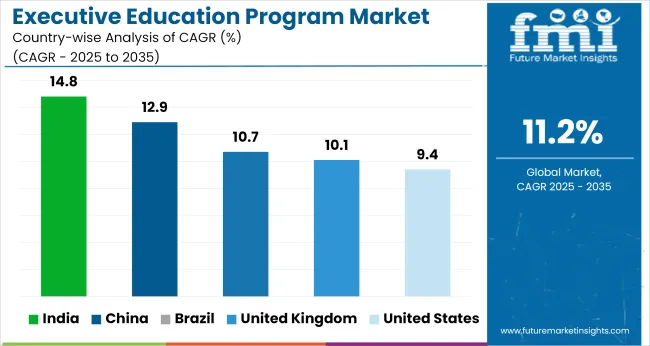
The report covers detailed analysis of 40+ countries, and the top five countries have been shared as a reference.
| Countries | CAGR (2025 to 2035) |
|---|---|
| United States | 9.4% |
| United Kingdom | 10.1% |
| China | 12.9% |
| India | 14.8% |
| Brazil | 10.7% |
The global executive education sector is projected to grow at 11.2% CAGR from 2025 to 2035, with wide variation across economic blocs. India, a BRICS member, exceeds the global average by 3.6 percentage points, reaching 14.8% CAGR. This performance is driven by national skilling policies, digital cohort expansion, and institutional-private partnerships. China, also in BRICS, posts 12.9%, with demand rising through enterprise-backed modular leadership programs and urban innovation hubs.
Brazil grows at 10.7%, just under the global average, with regional institutions integrating hybrid formats for mid-career professionals. OECD economies under perform the benchmark. The United States posts 9.4%, slowed by declining corporate budgets for long-format courses and a shift to internal learning academies. The United Kingdom trails at 6.7%, down 4.5 points from the global trend, reflecting international student attrition and policy headwinds.
The executive education program market in the United States is projected to grow at a CAGR of 9.4% from 2025 to 2035. This growth is driven by the increasing need for skilled leaders across various sectors, especially finance, technology, healthcare, and manufacturing. USA businesses are investing heavily in leadership development programs to equip executives with the tools necessary to navigate a rapidly evolving global landscape.
Institutions like Harvard Business School, Wharton, and Stanford Graduate School of Business continue to lead by offering tailored programs that cater to industry-specific needs.The demand for executive education is being further bolstered by the growing number of multinational corporations that require executives to adapt to shifting economic, technological, and regulatory environments.
The UK market is growing at a CAGR of 10.1% from 2025 to 2035. This expansion is driven by the growing need for professionals in leadership and management roles to adapt to changing conditions and global business challenges. The UK is home to some of the world’s most prestigious business schools, such as London Business School and Oxford Saïd Business School, which continue to attract executives from across the globe.
As businesses in the UK face a range of complex challenges, including economic uncertainty, regulatory changes, and technological advancements, the demand for executive education is rising. These programs are increasingly seen as crucial for senior managers and executives to stay competitive and effective in leadership roles.
The executive education program in the China market is expected to experience a CAGR of 12.9% from 2025 to 2035. The rapid economic growth and increasing presence in the industry have heightened the demand for executive education programs tailored to address specific challenges in leadership and business management.
Leading institutions like Tsinghua University and China Europe International Business School (CEIBS) are at the forefront of this market, offering programs designed to equip Chinese executives with the necessary skills to lead both domestic and international businesses. These programs focus on critical areas such as strategic management, digital transformation, and international business operations.
India’s executive education program market is projected to grow at a CAGR of 14.8% from 2025 to 2035. This rapid growth is fueled by the country’s expanding corporate sector, which continues to embrace leadership training as a critical component of its business strategy. India’s fast-developing economy, along with a rising middle class, has spurred demand for skilled professionals, particularly in leadership roles.
Leading institutions like Indian School of Business (ISB), IIM Bangalore, and IIM Ahmedabad are capitalizing on this demand by offering tailored executive programs to equip professionals with advanced leadership and management skills. As more professionals seek to enhance their skills in a competitive job market, shorter-duration, more affordable courses are gaining traction.
The executive education program market in Brazil is expected to grow at a CAGR of 10.7% from 2025 to 2035. This growth is driven by a need for advanced leadership development programs to guide organizations through economic uncertainty and market volatility. Brazil’s business environment is evolving, and companies are increasingly investing in executive education to ensure their leaders have the skills necessary to navigate these challenges.
Institutions such as FundaçãoGetúlio Vargas (FGV) and INSPER have established themselves as key players in this market, offering comprehensive programs that focus on leadership, strategic management, and innovation. As Brazil’s infrastructure development continues, there is growing demand for executive education that helps professionals adapt to rapid changes in the local and global business environments
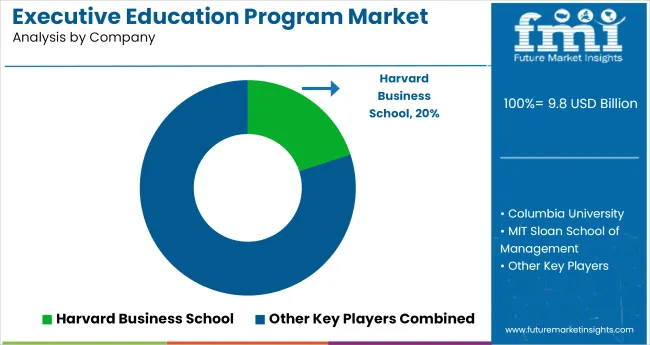
In the executive education program market, top institutions are scaling their influence through curriculum personalization, digital immersion, and corporate-aligned content delivery. Schools like Harvard Business School, MIT Sloan, and Stanford GSB are leading by integrating real-time business simulations, cross-border immersion modules, and industry-executive faculty into their offerings.
Programs from Wharton, Kellogg, and Columbia are using blended formats synchronous virtual sessions combined with short-campus intensives to increase accessibility while preserving peer interaction. Backend partnerships with edtech platforms allow schools such as UCLA Anderson, Ross, and Chicago Booth to expand modular learning, AI-driven assessments, and credential portability.
Baruch College, UBC Sauder, and Durham Business School are anchoring regional demand through lower-cost, high-impact programs tailored to mid-career professionals. Competition has grown as learners seek short-form, outcome-oriented education with global applicability. Leading players are advancing three priorities: credential stackability, industry co-certification, and enterprise partnerships allowing them to dominate a space increasingly shaped by professional agility, cost efficiency, and brand equity.
| Report Attributes | Details |
|---|---|
| Industry Size (2025) | USD 9.8 billion |
| Projected Industry Size (2035) | USD 28.3 billion |
| CAGR (2025 to 2035) | 11.2% |
| Base Year for Estimation | 2024 |
| Historical Period | 2020 to 2024 |
| Projections Period | 2025 to 2035 |
| Quantitative Units | USD billion for value and thousand enrollees for volume |
| Program Types Analyzed (Segment 1) | Customized Programs, Pre-designed Programs |
| Leadership Levels Analyzed (Segment 2) | Business-Owners, Junior/Entry-level Employees, Managers, Mid-level Employees, Senior Executives |
| Learner Types Analyzed (Segment 3) | Group/Small Team Learners, Individual/Private Learners |
| Modes of Learning Analyzed (Segment 4) | In-Person Learning, Online Learning |
| Course Durations Analyzed (Segment 5) | Less than 1 Week, 1 Week to 1 Month, More than 1 Month |
| Course Types Analyzed (Segment 6) | Management & Leadership, Finance & Accounting, Strategic Leadership & Innovation, Marketing & Sales, Business Operations & Entrepreneurship, Others |
| Industry Types Analyzed (Segment 7) | Consumer Products & Retail, Energy & Transportation, Financial Services, Healthcare & Pharmaceuticals, Manufacturing & Industrials, Professional Services, Technology & Communications, Others |
| Regions Covered | North America, Latin America, Europe, South Asia, East Asia, Oceania, Middle East & Africa |
| Countries Covered | United States, Canada, Brazil, Mexico, United Kingdom, Germany, France, India, China, Japan, South Korea, Australia, UAE, Saudi Arabia, South Africa |
| Key Players | Harvard Business School, Columbia University, MIT Sloan School of Management, Stanford Graduate School of Business, Baruch College, Wharton School of Business, UCLA Anderson School of Business, Kellogg School of Management, Stephen M. Ross School of Management, The University of Chicago Booth School of Business, The University of Texas at Austin, Cornell SC Johnson, Rotman School of Management, Ted Rogers School of Management, UBC Sauder School of Business, Durham University Business School |
| Additional Attributes | Dollar sales by course type and learning mode, rising demand from mid-level executives, increasing partnerships between universities and corporates, growth in modular and hybrid formats, regional enrollment and delivery format variations |
The segment is categorized into Customized Programs and Pre-designed Programs.
This includes Business-Owners, Junior/Entry-level Employees, Managers, Mid-level Employees, and Senior Executives.
The segment is divided into Group/Small Team Learners and Individual/Private Learners.
This includes In-Person Learning and Online Learning.
The segment covers Less than 1 Week, 1 Week to 1 Month, and More than 1 Month.
This includes Management & Leadership, Finance & Accounting, Strategic Leadership & Innovation, Marketing & Sales, Business Operations & Entrepreneurship, and Others.
The segment comprises Consumer Products & Retail, Energy & Transportation, Financial Services, Healthcare & Pharmaceuticals, Manufacturing & Industrials, Professional Services, Technology & Communications, and Others.
Regional analysis includes North America, Latin America, Europe, South Asia, East Asia, Oceania, and Middle East & Africa.
The global executive education program market is estimated to be valued at USD 9.8 billion in 2025.
The market size for the executive education program market is projected to reach USD 27.1 billion by 2035.
The executive education program market is expected to grow at a 10.7% CAGR between 2025 and 2035.
The key product types in executive education program market are customized programs and pre-designed programs.
In terms of leadership level, business-owners segment to command 41.8% share in the executive education program market in 2025.


Our Research Products

The "Full Research Suite" delivers actionable market intel, deep dives on markets or technologies, so clients act faster, cut risk, and unlock growth.

The Leaderboard benchmarks and ranks top vendors, classifying them as Established Leaders, Leading Challengers, or Disruptors & Challengers.

Locates where complements amplify value and substitutes erode it, forecasting net impact by horizon

We deliver granular, decision-grade intel: market sizing, 5-year forecasts, pricing, adoption, usage, revenue, and operational KPIs—plus competitor tracking, regulation, and value chains—across 60 countries broadly.

Spot the shifts before they hit your P&L. We track inflection points, adoption curves, pricing moves, and ecosystem plays to show where demand is heading, why it is changing, and what to do next across high-growth markets and disruptive tech

Real-time reads of user behavior. We track shifting priorities, perceptions of today’s and next-gen services, and provider experience, then pace how fast tech moves from trial to adoption, blending buyer, consumer, and channel inputs with social signals (#WhySwitch, #UX).

Partner with our analyst team to build a custom report designed around your business priorities. From analysing market trends to assessing competitors or crafting bespoke datasets, we tailor insights to your needs.
Supplier Intelligence
Discovery & Profiling
Capacity & Footprint
Performance & Risk
Compliance & Governance
Commercial Readiness
Who Supplies Whom
Scorecards & Shortlists
Playbooks & Docs
Category Intelligence
Definition & Scope
Demand & Use Cases
Cost Drivers
Market Structure
Supply Chain Map
Trade & Policy
Operating Norms
Deliverables
Buyer Intelligence
Account Basics
Spend & Scope
Procurement Model
Vendor Requirements
Terms & Policies
Entry Strategy
Pain Points & Triggers
Outputs
Pricing Analysis
Benchmarks
Trends
Should-Cost
Indexation
Landed Cost
Commercial Terms
Deliverables
Brand Analysis
Positioning & Value Prop
Share & Presence
Customer Evidence
Go-to-Market
Digital & Reputation
Compliance & Trust
KPIs & Gaps
Outputs
Full Research Suite comprises of:
Market outlook & trends analysis
Interviews & case studies
Strategic recommendations
Vendor profiles & capabilities analysis
5-year forecasts
8 regions and 60+ country-level data splits
Market segment data splits
12 months of continuous data updates
DELIVERED AS:
PDF EXCEL ONLINE
Industry Share & Competitive Positioning in Executive Education Program
Key Companies & Market Share in United States Executive Education Program Sector
Canada Executive Education Program Market Size and Share Forecast Outlook 2025 to 2035
Online Executive Education Program Market Trends – Growth & Forecast 2024-2034
Nordics Executive Education Program Market Size and Share Forecast Outlook 2025 to 2035
United States Executive Education Program Market Size and Share Forecast Outlook 2025 to 2035
Executive Coaching Certification Market Size and Share Forecast Outlook 2025 to 2035
Educational Tourism Market Analysis - Size, Share, and Forecast Outlook 2025 to 2035
Educational Toys Market Analysis and Overview by Category, End-use Sector, and Area through 2035
Educational Robots Market Analysis by Type, Application, and Region Through 2035
M-Education Market Size and Share Forecast Outlook 2025 to 2035
UK Educational Tourism Market Insights – Size, Demand & Innovations 2025-2035
USA Educational Tourism Market Report – Size, Growth & Industry Trends 2025-2035
China Educational Tourism Market Insights – Trends, Growth & Forecast 2025-2035
Smart Education and Learning Market Analysis by Component, Learning, End User, and Region Through 2035
NLP In Education Market Forecast and Outlook 2025 to 2035
Europe Educational Tourism Market Trends - Growth & Forecast 2025 to 2035
France Educational Tourism Market Analysis – Trends, Growth & Forecast 2025-2035
Digital Education Market Growth – Trends & Forecast 2024-2034
Australia Educational Tourism Market Report – Growth, Innovations & Forecast 2025-2035

Thank you!
You will receive an email from our Business Development Manager. Please be sure to check your SPAM/JUNK folder too.
Chat With
MaRIA