NLP in Education Market Size and Share Forecast

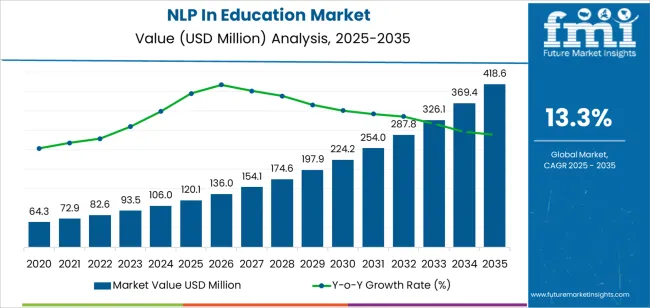
The global NLP in education market size is envisioned to foster significantly, achieving USD 101.5 million by 2024. From 2024 to 2034, demand of natural language processing (NLP) is predicted to soar at a resilient CAGR of 18.3%. By 2034, the natural language processing in the education market is expected to be worth USD 545 million.

The growing need for individualized learning experiences, the need to improve student outcomes, and the rising adoption of AI in education technology trends and ML technologies are likely to contribute to significant global natural language processing (NLP) in education market growth.

The adoption of NLP in education offers considerable opportunities to boost academic achievement, personalization, and student involvement, simplify administrative processes, and cut expenses.

The widespread adoption of NLP solutions in education is constrained by problems such as data security and privacy concerns, the requirement for specialized knowledge and training, and the potential for prejudice in NLP algorithms.

Attributes Details
Market Value for 2024 USD 101.5 million
Market Value for 2034 USD 545.0 million
Market CAGR from 2024 to 2034 18.3%

Key Drivers Supporting the Growth of NLP in the Education Sector

  • NLP technologies improve operational efficiency and streamline administrative procedures in educational establishments by automating administrative duties, such as academic advising, course registration, and student enrolment.
  • NLP-powered analytics tools, like automated assessment systems analyze large volumes of educational data, including behavioral trends, learning patterns, and student performance measures, to produce insights that teachers are likely to use.
  • A more individualized learning experience is promoted by NLP's ability to customize instructional materials and delivery strategies based on individual students' needs, and developments in the NLP in education.
  • By supporting the development of language teaching software and instructional practices, language learning tools help educational researchers analyze academic material, perform sentiment analysis, and recognize M-education industry trends.
Attributes Details
Market Value for 2019 USD 37.4 million
Market Value for 2023 USD 83.7 million
Market CAGR from 2019 to 2023 22.3%

Challenges Hindering the Growth of NLP in Education Market

  • The natural language processing (NLP) in education market confronts an impediment when educational information lacks common formats and protocols. Since different educational materials and courses do not adhere to a standard framework, NLP models have complications in consistently processing and interpreting data.
  • Due to the diversity of schooling, it is difficult to create NLP models that successfully accommodate different linguistic nuances and educational contexts. Cultural and linguistic variations are the primary obstacles to the adoption of NLP solutions for linguistic analysis in education.
  • The opacity of certain NLP models and algorithms raises concerns about ethics, particularly in educational environments where openness is essential. Uncertainty and opposition from educators and stakeholders result from a lack of knowledge about how NLP systems make judgments.

NLP in Education Market Analysis by Top Investment Segments

In the following section, we ought to look in depth at the NLP in education market analysis. Comprehensive studies demonstrate that solution offerings dominate the market, establishing a definite shift towards practical implementations.

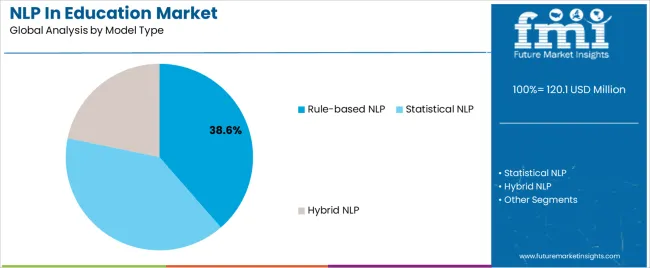
Rule-based NLP models have emerged as the leading model types, showing widespread acceptance and success in educational settings.

Solution-Centric Strategies Capture NLP in Education Market

Attributes Details
Top Offering Solution
CAGR % 2018 to 2022 22.1%
CAGR % 2023 to End of Forecast (2033) 18.0%
  • Educators have the opportunity to spend more time teaching instead of handling administrative duties due to the efficiency advantages of NLP technologies.
  • To provide flexibility and future-proof investments, NLP solutions can easily grow to meet changing educational needs.
  • By providing individualized content distribution and interactive learning opportunities, NLP solutions enhance the quality of the learning environment and meet the shifting requirements of educators and students alike.

Rule-Based NLP Emerges as the Pinnacle in Educational Solutions

Attributes Details
Top Model Type Rule-based NLP
CAGR % 2018 to 2022 21.9%
CAGR % 2023 to End of Forecast (2033) 17.8%
  • Rule-based natural language processing (NLP) is a practical and efficient method of natural language processing in various learning situations, and its scalability and adaptability make it a cost-effective solution for educational stakeholders.
  • For educators searching for consistency in language processing applications, rule-based natural language processing (NLP) offers a deterministic approach with explicit standards and consistent, dependable outputs.
  • Rule-based natural language processing (NLP) is a favored method for handling grammar rules and established linguistic patterns because of its accuracy, which improves application accuracy in education.

Top Countries Integrating NLP Technologies in the Education Sector

The following tables exhibit major economies, including China, South Korea, Japan, the United States, and the United Kingdom, focusing on NLP in education market.

A detailed analysis reveals that South Korea sets itself apart, providing an opportunity for expansion and demonstrating the country's capacity for the significant advancement and adoption of Natural Language Processing (NLP) technology in the educational system.

NLP's Surge in South Korea's Edtech Ecosystem

Nation South Korea
HCAGR (2019 to 2023) 29.4%
CAGR (2024 to 2034) 20.1%
  • South Korea's sophisticated ICT infrastructure and substantial governmental support for smart education and learning foster an atmosphere favorable for the adoption of NLP in education.
  • South Korea is a lucrative market for NLP-powered personalized learning platforms and virtual assistants due to the high importance placed on education and the popularity of automated tutoring systems.
  • The demand for NLP-based educational solutions is stimulated by South Korea's tech-savvy population and passion for digital learning experiences, especially in language learning and exam preparation.

Japan's Shift Toward Interactive Education

Country Japan
HCAGR (2019 to 2023) 25.7%
CAGR (2024 to 2034) 19.4%
  • Japan is shifting toward more interactive and adaptive learning methods, as seen by its growing interest in AI-driven education and its adoption of NLP technologies for language instruction software.
  • A potential NLP application in the education market aimed at lifetime learning and skill development is Japan, where the elderly population and falling birth rates compel the demand for creative educational solutions.
  • The providers of NLP in education market benefits from the potential presented by Japan's strong emphasis on smart education and learning by providing tools for optimizing instructional content and tailored learning experiences.

Footprint of NLP for the United Kingdom Education Curriculum

Nation United Kingdom
HCAGR (2019 to 2023) 25.7%
CAGR (2024 to 2034) 19.3%
  • The emphasis on evidence-based practice in education encourages the adoption of natural language processing (NLP) technology for data analytics, individualized feedback, and learning outcome assessment.
  • Government programs encouraging educational technology integration and digital literacy in education stimulate demand for NLP-enabled learning resources that improve student engagement and instructional efficacy.
  • The United Kingdom's innovative educational policies and progressive pedagogy foster a climate conducive to the adoption of NLP in fields such as language acquisition, literacy enhancement, and teacher preparation.

Scaling Opportunities for NLP Solutions in China

Nation China
HCAGR (2019 to 2023) 24.7%
CAGR (2024 to 2034) 18.6%
  • Given the expanding middle class and increased educational spending, China presents a significant area of NLP in education market looking to provide scalable and affordable solutions.
  • Due to its large population and swift technological adoption, China has a favorable opportunity for natural language processing (NLP) applications in education, particularly in language learning and adaptive learning platforms.
  • The adoption of natural language processing (NLP) technologies in classrooms and China's concentration on AI-driven education regulations are transforming the educational landscape and creating a more competitive market.

Equity and Accessibility Spur NLP Adoption in the United States Educational Settings

Nation United States
HCAGR (2019 to 2023) 23.2%
CAGR (2024 to 2034) 18.5%
  • With natural language processing (NLP) at the core of automated tutoring systems, data-driven instructional design, and personalized learning, the United States dominates the world in edtech sales.
  • NLP providers meet various demands, from K–12 education to higher education and business training, owing to the United States varied educational landscape.
  • The emphasis on equity and accessibility in education motivates the adoption of NLP-powered technologies for inclusive learning environments catering to diverse student groups' demands.

Competitive Landscape and Market Dynamics

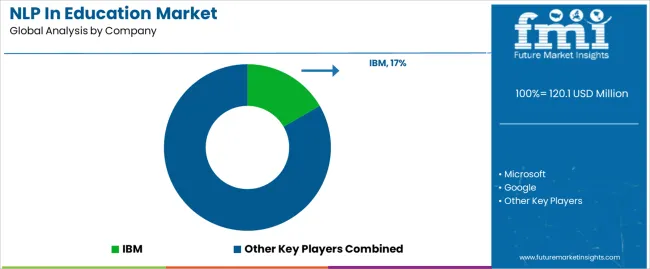
The landscape of NLP in education market includes various major players promoting innovation and revolution. IBM, Microsoft, and Google stand out as prominent innovators, harnessing their massive resources and experience to determine the trajectory of natural language processing in education.

SAS Institute and AWS bring significant educational technology expertise to the table, providing advanced solutions to address the changing needs of educational institutions. Welocalize, Automated Insights, and Primer.ai contribute to the competitive field by providing specialized services and specialist capabilities that address specific areas of NLP in education market.

As NLP vendors in education continue to collaborate and compete, the market has the potential for tremendous development and innovation. Advances in language understanding, educational content generation, and individualized learning experiences propel the developments in the NLP in education.

Noteworthy Breakthroughs

Company Details
Yellow.ai Yellow.ai announced Salem, a new Al-powered educational chatbot for WhatsApp, in March 2023.
Microsoft Microsoft launched Automated ML Supports NLP in February 2023, allowing ML specialists and data scientists to leverage text data to develop unique models for tasks such as named entity recognition (NER), multi-class text classification, and multi-label text classification.
IBM Partner Plus IBM Partner Plus launched for the first time in January 2023. This new program reimagines how IBM engages with its business partners to increase technical knowledge and accelerate time to market by providing unprecedented access to IBM resources, incentives, and specialist assistance.
NICE In December 2022, NICE revealed ElevateAl, a brand-new AlaaS service that gives the developer community access to the capabilities of Enlighten Al, its purpose-built customer experience AI in education technology trends.
Google In November 2022, Google announced an ambitious new plan to develop a single Al language model that can handle the top 1,000 languages spoken worldwide.
Askdata Askdata, a data engagement and collaboration platform, was bought by SAP SE in July 2022. The acquisition's primary goal is to aid consumers in making informed decisions using AI-driven natural language searches.
Apple Inc. Apple Inc. purchased Inductiv Inc., a machine learning firm, in May 2020. The acquisition is intended to improve the performance of Apple's virtual assistant, Siri.

Leading Providers in the NLP in Education Market

  • IBM
  • Microsoft
  • Google
  • SAS Institute
  • AWS
  • Welocalize
  • Automated Insights
  • Primer.ai

Scope and Coverage of the NLP in Education Market Report

  • Adjacent Study on NLP in Education Market, Natural Language Processing Market, and Healthcare Natural Language Processing Market
  • Study of Natural Language Processing in Education Market in South Korea and Japan
  • Competition Analysis of NLP in Education Market with Focus on IBM, Microsoft, and Google
  • Opportunities for Natural Language Processing in Education Market in Japan
  • Potential of Natural Language Processing in EdTech
  • Categorical Study on NLP Solutions and NLP Services

Top Segments Studied in the NLP in Education Market

By Offering:

  • Solution
    • Text-based NLP Solution
    • Video-based NLP Solution
    • Image-based NLP Solution
    • Audio-based NLP Solution
  • Services
    • Professional Services
    • Managed Services

By Model Type:

  • Rule-based NLP
  • Statistical NLP
  • Hybrid NLP

By Application:

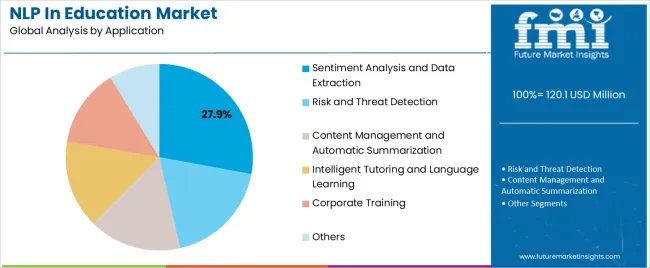
  • Sentiment Analysis and Data Extraction
  • Risk and Threat Detection
  • Content Management and Automatic Summarization
  • Intelligent Tutoring and Language Learning
  • Corporate Training
  • Others

By End-User:

  • Academic User
  • EdTech Provider

By Region:

  • North America
  • Latin America
  • Western Europe
  • Eastern Europe
  • Asia Pacific excluding Japan (APEJ)
  • Japan
  • Middle East and Africa

Table of Content

  • 1. Executive Summary
  • 2. Market Overview
  • 3. Market Background
  • 4. Global Market Analysis 2019 to 2023 and Forecast, 2024 to 2034
  • 5. Global Market Analysis 2019 to 2023 and Forecast 2024 to 2034, By Offering
    • 5.1. Solution
      • 5.1.1. Text-based NLP Solution
      • 5.1.2. Video-based NLP Solution
      • 5.1.3. Image-based NLP Solution
      • 5.1.4. Audio-based NLP Solution
    • 5.2. Services
      • 5.2.1. Professional Services
      • 5.2.2. Managed Services
  • 6. Global Market Analysis 2019 to 2023 and Forecast 2024 to 2034, By Model Type
    • 6.1. Rule-based NLP
    • 6.2. Statistical NLP
    • 6.3. Hybrid NLP
  • 7. Global Market Analysis 2019 to 2023 and Forecast 2024 to 2034, By Application
    • 7.1. Sentiment Analysis & Data Extraction
    • 7.2. Risk & Threat Detection
    • 7.3. Content Management & Automatic Summarization
    • 7.4. Intelligent Tutoring & Language Learning
    • 7.5. Corporate Training
    • 7.6. Others
  • 8. Global Market Analysis 2019 to 2023 and Forecast 2024 to 2034, By End-User
    • 8.1. Academic User
    • 8.2. EdTech Provider
  • 9. Global Market Analysis 2019 to 2023 and Forecast 2024 to 2034, By Region
    • 9.1. North America
    • 9.2. Latin America
    • 9.3. Western Europe
    • 9.4. Eastern Europe
    • 9.5. South Asia and Pacific
    • 9.6. East Asia
    • 9.7. Middle East and Africa
  • 10. North America Market Analysis 2019 to 2023 and Forecast 2024 to 2034, By Country
  • 11. Latin America Market Analysis 2019 to 2023 and Forecast 2024 to 2034, By Country
  • 12. Western Europe Market Analysis 2019 to 2023 and Forecast 2024 to 2034, By Country
  • 13. Eastern Europe Market Analysis 2019 to 2023 and Forecast 2024 to 2034, By Country
  • 14. South Asia and Pacific Market Analysis 2019 to 2023 and Forecast 2024 to 2034, By Country
  • 15. East Asia Market Analysis 2019 to 2023 and Forecast 2024 to 2034, By Country
  • 16. Middle East and Africa Market Analysis 2019 to 2023 and Forecast 2024 to 2034, By Country
  • 17. Key Countries Market Analysis
  • 18. Market Structure Analysis
  • 19. Competition Analysis
    • 19.1. IBM
    • 19.2. Microsoft
    • 19.3. Google
    • 19.4. SAS Institute
    • 19.5. AWS
    • 19.6. Welocalize
    • 19.7. Automated Insights
    • 19.8. Primer.ai
    • 19.9. Inbenta
    • 19.10. Baidu
    • 19.11. Yellow.ai
  • 20. Assumptions & Acronyms Used
  • 21. Research Methodology

List of Tables

Table 1: Global Market Value (US$ Million) Forecast by Region, 2019 to 2034

Table 2: Global Market Value (US$ Million) Forecast by Offering, 2019 to 2034

Table 3: Global Market Value (US$ Million) Forecast by Model Type, 2019 to 2034

Table 4: Global Market Value (US$ Million) Forecast by Application, 2019 to 2034

Table 5: Global Market Value (US$ Million) Forecast by End-User, 2019 to 2034

Table 6: North America Market Value (US$ Million) Forecast by Country, 2019 to 2034

Table 7: North America Market Value (US$ Million) Forecast by Offering, 2019 to 2034

Table 8: North America Market Value (US$ Million) Forecast by Model Type, 2019 to 2034

Table 9: North America Market Value (US$ Million) Forecast by Application, 2019 to 2034

Table 10: North America Market Value (US$ Million) Forecast by End-User, 2019 to 2034

Table 11: Latin America Market Value (US$ Million) Forecast by Country, 2019 to 2034

Table 12: Latin America Market Value (US$ Million) Forecast by Offering, 2019 to 2034

Table 13: Latin America Market Value (US$ Million) Forecast by Model Type, 2019 to 2034

Table 14: Latin America Market Value (US$ Million) Forecast by Application, 2019 to 2034

Table 15: Latin America Market Value (US$ Million) Forecast by End-User, 2019 to 2034

Table 16: Western Europe Market Value (US$ Million) Forecast by Country, 2019 to 2034

Table 17: Western Europe Market Value (US$ Million) Forecast by Offering, 2019 to 2034

Table 18: Western Europe Market Value (US$ Million) Forecast by Model Type, 2019 to 2034

Table 19: Western Europe Market Value (US$ Million) Forecast by Application, 2019 to 2034

Table 20: Western Europe Market Value (US$ Million) Forecast by End-User, 2019 to 2034

Table 21: Eastern Europe Market Value (US$ Million) Forecast by Country, 2019 to 2034

Table 22: Eastern Europe Market Value (US$ Million) Forecast by Offering, 2019 to 2034

Table 23: Eastern Europe Market Value (US$ Million) Forecast by Model Type, 2019 to 2034

Table 24: Eastern Europe Market Value (US$ Million) Forecast by Application, 2019 to 2034

Table 25: Eastern Europe Market Value (US$ Million) Forecast by End-User, 2019 to 2034

Table 26: South Asia and Pacific Market Value (US$ Million) Forecast by Country, 2019 to 2034

Table 27: South Asia and Pacific Market Value (US$ Million) Forecast by Offering, 2019 to 2034

Table 28: South Asia and Pacific Market Value (US$ Million) Forecast by Model Type, 2019 to 2034

Table 29: South Asia and Pacific Market Value (US$ Million) Forecast by Application, 2019 to 2034

Table 30: South Asia and Pacific Market Value (US$ Million) Forecast by End-User, 2019 to 2034

Table 31: East Asia Market Value (US$ Million) Forecast by Country, 2019 to 2034

Table 32: East Asia Market Value (US$ Million) Forecast by Offering, 2019 to 2034

Table 33: East Asia Market Value (US$ Million) Forecast by Model Type, 2019 to 2034

Table 34: East Asia Market Value (US$ Million) Forecast by Application, 2019 to 2034

Table 35: East Asia Market Value (US$ Million) Forecast by End-User, 2019 to 2034

Table 36: Middle East and Africa Market Value (US$ Million) Forecast by Country, 2019 to 2034

Table 37: Middle East and Africa Market Value (US$ Million) Forecast by Offering, 2019 to 2034

Table 38: Middle East and Africa Market Value (US$ Million) Forecast by Model Type, 2019 to 2034

Table 39: Middle East and Africa Market Value (US$ Million) Forecast by Application, 2019 to 2034

Table 40: Middle East and Africa Market Value (US$ Million) Forecast by End-User, 2019 to 2034

List of Figures

Figure 1: Global Market Value (US$ Million) by Offering, 2024 to 2034

Figure 2: Global Market Value (US$ Million) by Model Type, 2024 to 2034

Figure 3: Global Market Value (US$ Million) by Application, 2024 to 2034

Figure 4: Global Market Value (US$ Million) by End-User, 2024 to 2034

Figure 5: Global Market Value (US$ Million) by Region, 2024 to 2034

Figure 6: Global Market Value (US$ Million) Analysis by Region, 2019 to 2034

Figure 7: Global Market Value Share (%) and BPS Analysis by Region, 2024 to 2034

Figure 8: Global Market Y-o-Y Growth (%) Projections by Region, 2024 to 2034

Figure 9: Global Market Value (US$ Million) Analysis by Offering, 2019 to 2034

Figure 10: Global Market Value Share (%) and BPS Analysis by Offering, 2024 to 2034

Figure 11: Global Market Y-o-Y Growth (%) Projections by Offering, 2024 to 2034

Figure 12: Global Market Value (US$ Million) Analysis by Model Type, 2019 to 2034

Figure 13: Global Market Value Share (%) and BPS Analysis by Model Type, 2024 to 2034

Figure 14: Global Market Y-o-Y Growth (%) Projections by Model Type, 2024 to 2034

Figure 15: Global Market Value (US$ Million) Analysis by Application, 2019 to 2034

Figure 16: Global Market Value Share (%) and BPS Analysis by Application, 2024 to 2034

Figure 17: Global Market Y-o-Y Growth (%) Projections by Application, 2024 to 2034

Figure 18: Global Market Value (US$ Million) Analysis by End-User, 2019 to 2034

Figure 19: Global Market Value Share (%) and BPS Analysis by End-User, 2024 to 2034

Figure 20: Global Market Y-o-Y Growth (%) Projections by End-User, 2024 to 2034

Figure 21: Global Market Attractiveness by Offering, 2024 to 2034

Figure 22: Global Market Attractiveness by Model Type, 2024 to 2034

Figure 23: Global Market Attractiveness by Application, 2024 to 2034

Figure 24: Global Market Attractiveness by End-User, 2024 to 2034

Figure 25: Global Market Attractiveness by Region, 2024 to 2034

Figure 26: North America Market Value (US$ Million) by Offering, 2024 to 2034

Figure 27: North America Market Value (US$ Million) by Model Type, 2024 to 2034

Figure 28: North America Market Value (US$ Million) by Application, 2024 to 2034

Figure 29: North America Market Value (US$ Million) by End-User, 2024 to 2034

Figure 30: North America Market Value (US$ Million) by Country, 2024 to 2034

Figure 31: North America Market Value (US$ Million) Analysis by Country, 2019 to 2034

Figure 32: North America Market Value Share (%) and BPS Analysis by Country, 2024 to 2034

Figure 33: North America Market Y-o-Y Growth (%) Projections by Country, 2024 to 2034

Figure 34: North America Market Value (US$ Million) Analysis by Offering, 2019 to 2034

Figure 35: North America Market Value Share (%) and BPS Analysis by Offering, 2024 to 2034

Figure 36: North America Market Y-o-Y Growth (%) Projections by Offering, 2024 to 2034

Figure 37: North America Market Value (US$ Million) Analysis by Model Type, 2019 to 2034

Figure 38: North America Market Value Share (%) and BPS Analysis by Model Type, 2024 to 2034

Figure 39: North America Market Y-o-Y Growth (%) Projections by Model Type, 2024 to 2034

Figure 40: North America Market Value (US$ Million) Analysis by Application, 2019 to 2034

Figure 41: North America Market Value Share (%) and BPS Analysis by Application, 2024 to 2034

Figure 42: North America Market Y-o-Y Growth (%) Projections by Application, 2024 to 2034

Figure 43: North America Market Value (US$ Million) Analysis by End-User, 2019 to 2034

Figure 44: North America Market Value Share (%) and BPS Analysis by End-User, 2024 to 2034

Figure 45: North America Market Y-o-Y Growth (%) Projections by End-User, 2024 to 2034

Figure 46: North America Market Attractiveness by Offering, 2024 to 2034

Figure 47: North America Market Attractiveness by Model Type, 2024 to 2034

Figure 48: North America Market Attractiveness by Application, 2024 to 2034

Figure 49: North America Market Attractiveness by End-User, 2024 to 2034

Figure 50: North America Market Attractiveness by Country, 2024 to 2034

Figure 51: Latin America Market Value (US$ Million) by Offering, 2024 to 2034

Figure 52: Latin America Market Value (US$ Million) by Model Type, 2024 to 2034

Figure 53: Latin America Market Value (US$ Million) by Application, 2024 to 2034

Figure 54: Latin America Market Value (US$ Million) by End-User, 2024 to 2034

Figure 55: Latin America Market Value (US$ Million) by Country, 2024 to 2034

Figure 56: Latin America Market Value (US$ Million) Analysis by Country, 2019 to 2034

Figure 57: Latin America Market Value Share (%) and BPS Analysis by Country, 2024 to 2034

Figure 58: Latin America Market Y-o-Y Growth (%) Projections by Country, 2024 to 2034

Figure 59: Latin America Market Value (US$ Million) Analysis by Offering, 2019 to 2034

Figure 60: Latin America Market Value Share (%) and BPS Analysis by Offering, 2024 to 2034

Figure 61: Latin America Market Y-o-Y Growth (%) Projections by Offering, 2024 to 2034

Figure 62: Latin America Market Value (US$ Million) Analysis by Model Type, 2019 to 2034

Figure 63: Latin America Market Value Share (%) and BPS Analysis by Model Type, 2024 to 2034

Figure 64: Latin America Market Y-o-Y Growth (%) Projections by Model Type, 2024 to 2034

Figure 65: Latin America Market Value (US$ Million) Analysis by Application, 2019 to 2034

Figure 66: Latin America Market Value Share (%) and BPS Analysis by Application, 2024 to 2034

Figure 67: Latin America Market Y-o-Y Growth (%) Projections by Application, 2024 to 2034

Figure 68: Latin America Market Value (US$ Million) Analysis by End-User, 2019 to 2034

Figure 69: Latin America Market Value Share (%) and BPS Analysis by End-User, 2024 to 2034

Figure 70: Latin America Market Y-o-Y Growth (%) Projections by End-User, 2024 to 2034

Figure 71: Latin America Market Attractiveness by Offering, 2024 to 2034

Figure 72: Latin America Market Attractiveness by Model Type, 2024 to 2034

Figure 73: Latin America Market Attractiveness by Application, 2024 to 2034

Figure 74: Latin America Market Attractiveness by End-User, 2024 to 2034

Figure 75: Latin America Market Attractiveness by Country, 2024 to 2034

Figure 76: Western Europe Market Value (US$ Million) by Offering, 2024 to 2034

Figure 77: Western Europe Market Value (US$ Million) by Model Type, 2024 to 2034

Figure 78: Western Europe Market Value (US$ Million) by Application, 2024 to 2034

Figure 79: Western Europe Market Value (US$ Million) by End-User, 2024 to 2034

Figure 80: Western Europe Market Value (US$ Million) by Country, 2024 to 2034

Figure 81: Western Europe Market Value (US$ Million) Analysis by Country, 2019 to 2034

Figure 82: Western Europe Market Value Share (%) and BPS Analysis by Country, 2024 to 2034

Figure 83: Western Europe Market Y-o-Y Growth (%) Projections by Country, 2024 to 2034

Figure 84: Western Europe Market Value (US$ Million) Analysis by Offering, 2019 to 2034

Figure 85: Western Europe Market Value Share (%) and BPS Analysis by Offering, 2024 to 2034

Figure 86: Western Europe Market Y-o-Y Growth (%) Projections by Offering, 2024 to 2034

Figure 87: Western Europe Market Value (US$ Million) Analysis by Model Type, 2019 to 2034

Figure 88: Western Europe Market Value Share (%) and BPS Analysis by Model Type, 2024 to 2034

Figure 89: Western Europe Market Y-o-Y Growth (%) Projections by Model Type, 2024 to 2034

Figure 90: Western Europe Market Value (US$ Million) Analysis by Application, 2019 to 2034

Figure 91: Western Europe Market Value Share (%) and BPS Analysis by Application, 2024 to 2034

Figure 92: Western Europe Market Y-o-Y Growth (%) Projections by Application, 2024 to 2034

Figure 93: Western Europe Market Value (US$ Million) Analysis by End-User, 2019 to 2034

Figure 94: Western Europe Market Value Share (%) and BPS Analysis by End-User, 2024 to 2034

Figure 95: Western Europe Market Y-o-Y Growth (%) Projections by End-User, 2024 to 2034

Figure 96: Western Europe Market Attractiveness by Offering, 2024 to 2034

Figure 97: Western Europe Market Attractiveness by Model Type, 2024 to 2034

Figure 98: Western Europe Market Attractiveness by Application, 2024 to 2034

Figure 99: Western Europe Market Attractiveness by End-User, 2024 to 2034

Figure 100: Western Europe Market Attractiveness by Country, 2024 to 2034

Figure 101: Eastern Europe Market Value (US$ Million) by Offering, 2024 to 2034

Figure 102: Eastern Europe Market Value (US$ Million) by Model Type, 2024 to 2034

Figure 103: Eastern Europe Market Value (US$ Million) by Application, 2024 to 2034

Figure 104: Eastern Europe Market Value (US$ Million) by End-User, 2024 to 2034

Figure 105: Eastern Europe Market Value (US$ Million) by Country, 2024 to 2034

Figure 106: Eastern Europe Market Value (US$ Million) Analysis by Country, 2019 to 2034

Figure 107: Eastern Europe Market Value Share (%) and BPS Analysis by Country, 2024 to 2034

Figure 108: Eastern Europe Market Y-o-Y Growth (%) Projections by Country, 2024 to 2034

Figure 109: Eastern Europe Market Value (US$ Million) Analysis by Offering, 2019 to 2034

Figure 110: Eastern Europe Market Value Share (%) and BPS Analysis by Offering, 2024 to 2034

Figure 111: Eastern Europe Market Y-o-Y Growth (%) Projections by Offering, 2024 to 2034

Figure 112: Eastern Europe Market Value (US$ Million) Analysis by Model Type, 2019 to 2034

Figure 113: Eastern Europe Market Value Share (%) and BPS Analysis by Model Type, 2024 to 2034

Figure 114: Eastern Europe Market Y-o-Y Growth (%) Projections by Model Type, 2024 to 2034

Figure 115: Eastern Europe Market Value (US$ Million) Analysis by Application, 2019 to 2034

Figure 116: Eastern Europe Market Value Share (%) and BPS Analysis by Application, 2024 to 2034

Figure 117: Eastern Europe Market Y-o-Y Growth (%) Projections by Application, 2024 to 2034

Figure 118: Eastern Europe Market Value (US$ Million) Analysis by End-User, 2019 to 2034

Figure 119: Eastern Europe Market Value Share (%) and BPS Analysis by End-User, 2024 to 2034

Figure 120: Eastern Europe Market Y-o-Y Growth (%) Projections by End-User, 2024 to 2034

Figure 121: Eastern Europe Market Attractiveness by Offering, 2024 to 2034

Figure 122: Eastern Europe Market Attractiveness by Model Type, 2024 to 2034

Figure 123: Eastern Europe Market Attractiveness by Application, 2024 to 2034

Figure 124: Eastern Europe Market Attractiveness by End-User, 2024 to 2034

Figure 125: Eastern Europe Market Attractiveness by Country, 2024 to 2034

Figure 126: South Asia and Pacific Market Value (US$ Million) by Offering, 2024 to 2034

Figure 127: South Asia and Pacific Market Value (US$ Million) by Model Type, 2024 to 2034

Figure 128: South Asia and Pacific Market Value (US$ Million) by Application, 2024 to 2034

Figure 129: South Asia and Pacific Market Value (US$ Million) by End-User, 2024 to 2034

Figure 130: South Asia and Pacific Market Value (US$ Million) by Country, 2024 to 2034

Figure 131: South Asia and Pacific Market Value (US$ Million) Analysis by Country, 2019 to 2034

Figure 132: South Asia and Pacific Market Value Share (%) and BPS Analysis by Country, 2024 to 2034

Figure 133: South Asia and Pacific Market Y-o-Y Growth (%) Projections by Country, 2024 to 2034

Figure 134: South Asia and Pacific Market Value (US$ Million) Analysis by Offering, 2019 to 2034

Figure 135: South Asia and Pacific Market Value Share (%) and BPS Analysis by Offering, 2024 to 2034

Figure 136: South Asia and Pacific Market Y-o-Y Growth (%) Projections by Offering, 2024 to 2034

Figure 137: South Asia and Pacific Market Value (US$ Million) Analysis by Model Type, 2019 to 2034

Figure 138: South Asia and Pacific Market Value Share (%) and BPS Analysis by Model Type, 2024 to 2034

Figure 139: South Asia and Pacific Market Y-o-Y Growth (%) Projections by Model Type, 2024 to 2034

Figure 140: South Asia and Pacific Market Value (US$ Million) Analysis by Application, 2019 to 2034

Figure 141: South Asia and Pacific Market Value Share (%) and BPS Analysis by Application, 2024 to 2034

Figure 142: South Asia and Pacific Market Y-o-Y Growth (%) Projections by Application, 2024 to 2034

Figure 143: South Asia and Pacific Market Value (US$ Million) Analysis by End-User, 2019 to 2034

Figure 144: South Asia and Pacific Market Value Share (%) and BPS Analysis by End-User, 2024 to 2034

Figure 145: South Asia and Pacific Market Y-o-Y Growth (%) Projections by End-User, 2024 to 2034

Figure 146: South Asia and Pacific Market Attractiveness by Offering, 2024 to 2034

Figure 147: South Asia and Pacific Market Attractiveness by Model Type, 2024 to 2034

Figure 148: South Asia and Pacific Market Attractiveness by Application, 2024 to 2034

Figure 149: South Asia and Pacific Market Attractiveness by End-User, 2024 to 2034

Figure 150: South Asia and Pacific Market Attractiveness by Country, 2024 to 2034

Figure 151: East Asia Market Value (US$ Million) by Offering, 2024 to 2034

Figure 152: East Asia Market Value (US$ Million) by Model Type, 2024 to 2034

Figure 153: East Asia Market Value (US$ Million) by Application, 2024 to 2034

Figure 154: East Asia Market Value (US$ Million) by End-User, 2024 to 2034

Figure 155: East Asia Market Value (US$ Million) by Country, 2024 to 2034

Figure 156: East Asia Market Value (US$ Million) Analysis by Country, 2019 to 2034

Figure 157: East Asia Market Value Share (%) and BPS Analysis by Country, 2024 to 2034

Figure 158: East Asia Market Y-o-Y Growth (%) Projections by Country, 2024 to 2034

Figure 159: East Asia Market Value (US$ Million) Analysis by Offering, 2019 to 2034

Figure 160: East Asia Market Value Share (%) and BPS Analysis by Offering, 2024 to 2034

Figure 161: East Asia Market Y-o-Y Growth (%) Projections by Offering, 2024 to 2034

Figure 162: East Asia Market Value (US$ Million) Analysis by Model Type, 2019 to 2034

Figure 163: East Asia Market Value Share (%) and BPS Analysis by Model Type, 2024 to 2034

Figure 164: East Asia Market Y-o-Y Growth (%) Projections by Model Type, 2024 to 2034

Figure 165: East Asia Market Value (US$ Million) Analysis by Application, 2019 to 2034

Figure 166: East Asia Market Value Share (%) and BPS Analysis by Application, 2024 to 2034

Figure 167: East Asia Market Y-o-Y Growth (%) Projections by Application, 2024 to 2034

Figure 168: East Asia Market Value (US$ Million) Analysis by End-User, 2019 to 2034

Figure 169: East Asia Market Value Share (%) and BPS Analysis by End-User, 2024 to 2034

Figure 170: East Asia Market Y-o-Y Growth (%) Projections by End-User, 2024 to 2034

Figure 171: East Asia Market Attractiveness by Offering, 2024 to 2034

Figure 172: East Asia Market Attractiveness by Model Type, 2024 to 2034

Figure 173: East Asia Market Attractiveness by Application, 2024 to 2034

Figure 174: East Asia Market Attractiveness by End-User, 2024 to 2034

Figure 175: East Asia Market Attractiveness by Country, 2024 to 2034

Figure 176: Middle East and Africa Market Value (US$ Million) by Offering, 2024 to 2034

Figure 177: Middle East and Africa Market Value (US$ Million) by Model Type, 2024 to 2034

Figure 178: Middle East and Africa Market Value (US$ Million) by Application, 2024 to 2034

Figure 179: Middle East and Africa Market Value (US$ Million) by End-User, 2024 to 2034

Figure 180: Middle East and Africa Market Value (US$ Million) by Country, 2024 to 2034

Figure 181: Middle East and Africa Market Value (US$ Million) Analysis by Country, 2019 to 2034

Figure 182: Middle East and Africa Market Value Share (%) and BPS Analysis by Country, 2024 to 2034

Figure 183: Middle East and Africa Market Y-o-Y Growth (%) Projections by Country, 2024 to 2034

Figure 184: Middle East and Africa Market Value (US$ Million) Analysis by Offering, 2019 to 2034

Figure 185: Middle East and Africa Market Value Share (%) and BPS Analysis by Offering, 2024 to 2034

Figure 186: Middle East and Africa Market Y-o-Y Growth (%) Projections by Offering, 2024 to 2034

Figure 187: Middle East and Africa Market Value (US$ Million) Analysis by Model Type, 2019 to 2034

Figure 188: Middle East and Africa Market Value Share (%) and BPS Analysis by Model Type, 2024 to 2034

Figure 189: Middle East and Africa Market Y-o-Y Growth (%) Projections by Model Type, 2024 to 2034

Figure 190: Middle East and Africa Market Value (US$ Million) Analysis by Application, 2019 to 2034

Figure 191: Middle East and Africa Market Value Share (%) and BPS Analysis by Application, 2024 to 2034

Figure 192: Middle East and Africa Market Y-o-Y Growth (%) Projections by Application, 2024 to 2034

Figure 193: Middle East and Africa Market Value (US$ Million) Analysis by End-User, 2019 to 2034

Figure 194: Middle East and Africa Market Value Share (%) and BPS Analysis by End-User, 2024 to 2034

Figure 195: Middle East and Africa Market Y-o-Y Growth (%) Projections by End-User, 2024 to 2034

Figure 196: Middle East and Africa Market Attractiveness by Offering, 2024 to 2034

Figure 197: Middle East and Africa Market Attractiveness by Model Type, 2024 to 2034

Figure 198: Middle East and Africa Market Attractiveness by Application, 2024 to 2034

Figure 199: Middle East and Africa Market Attractiveness by End-User, 2024 to 2034

Figure 200: Middle East and Africa Market Attractiveness by Country, 2024 to 2034

Frequently Asked Questions

What is Current Valuation of NLP in Education Market?

The demand for NLP in education to secure a valuation USD 101.5 million in 2024.

How Big Can the Natural Language Processing Market Be by 2034?

The NLP demand in education is estimated to reach USD 545.0 million by 2034.

What is the Potential of NLP in Education Market?

Through 2034, the NLP sales in education are anticipated to flourish at a 18.3% CAGR.

What Was the Historical Outlook of The Natural Language Processing Market?

From 2019 to 2023, the NLP in education market recorded a 22.3% CAGR.

Which Model Type Segment to Dominate in the Natural Language Processing Market?

The rule-based NLP sector is predicted to expand at a CAGR of 17.8% from 2024 to 2034.

Which Offering Segment to Lead NLP Sector in Education Market?

The solution sector is envisioned to flourish at a CAGR of 18.0% between 2024 and 2034.

Explore Similar Insights

Future Market Insights

NLP In Education Market