The Metaverse in Education Market is estimated to be valued at USD 5.4 billion in 2025 and is projected to reach USD 49.3 billion by 2035, registering a compound annual growth rate (CAGR) of 24.8% over the forecast period.
The metaverse in education market is advancing rapidly, supported by the integration of immersive technologies such as virtual reality (VR), augmented reality (AR), and mixed reality (MR) into learning ecosystems. Educational institutions and training providers are leveraging metaverse platforms to create interactive, experiential learning environments that enhance engagement and retention.
The shift toward digital transformation in education, accelerated by remote learning trends, has strengthened market adoption. Technological advancements in hardware, bandwidth, and 3D content creation are expanding accessibility and improving user experience.
The current market scenario highlights increased investment by EdTech companies and governments in virtual infrastructure and content standardization. Looking forward, sustained innovation in haptic interfaces and AI-driven personalization is expected to redefine learning methodologies, positioning the metaverse as a critical pillar of future educational systems..

| Metric | Value |
|---|---|
| Metaverse in Education Market Estimated Value in (2025 E) | USD 5.4 billion |
| Metaverse in Education Market Forecast Value in (2035 F) | USD 49.3 billion |
| Forecast CAGR (2025 to 2035) | 24.8% |
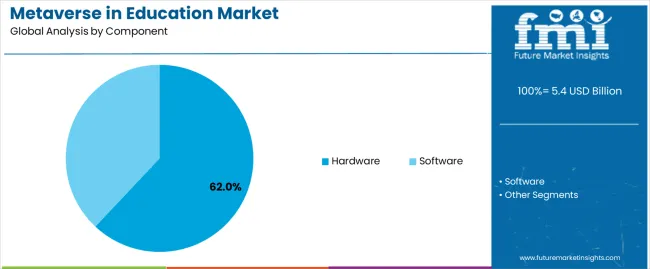
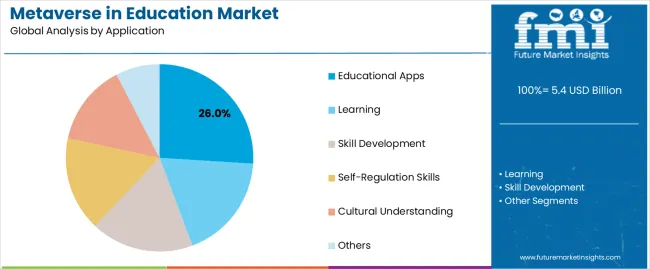
The market is segmented by Component and Application and region. By Component, the market is divided into Hardware and Software. In terms of Application, the market is classified into Educational Apps, Learning, Skill Development, Self-Regulation Skills, Cultural Understanding, and Others. Regionally, the market is classified into North America, Latin America, Western Europe, Eastern Europe, Balkan & Baltic Countries, Russia & Belarus, Central Asia, East Asia, South Asia & Pacific, and the Middle East & Africa.

The hardware segment dominates the component category with approximately 62.0% share, driven by the increasing adoption of head-mounted displays, VR headsets, and AR-enabled devices in educational institutions. The segment’s growth is propelled by the need for immersive, real-time interaction within virtual classrooms and simulation-based learning environments.
Hardware advancements have made metaverse integration more feasible, reducing latency and improving visual fidelity for enhanced learning outcomes. Cost reductions in VR and AR equipment have accelerated adoption across universities, vocational training centers, and K–12 institutions.
Continued development of lightweight, ergonomic, and wireless devices is expected to further boost the segment’s presence. With the ongoing expansion of digital infrastructure and institutional investment in immersive technologies, the hardware segment is projected to retain its dominant market position..

The educational apps segment accounts for approximately 26.0% share within the application category, reflecting its role in facilitating seamless access to metaverse-based learning platforms. These applications provide interactive interfaces that integrate 3D content, gamified learning, and real-time collaboration.
The segment’s growth is supported by rising demand for personalized, on-demand education experiences that adapt to learner pace and preferences. Developers are focusing on creating curriculum-aligned, AI-enhanced platforms that enhance engagement while tracking learning outcomes.
Increased adoption in distance learning and hybrid education models has further accelerated market expansion. As education systems continue transitioning toward digital-first frameworks, the educational apps segment is expected to play a central role in delivering metaverse-enabled learning experiences globally..
From 2020 to 2025, metaverse in education market experienced a CAGR of 41.4%. Governments around the world are recognizing the potential of the metaverse to transform education and are implementing policies and funding initiatives to support its development and adoption in educational settings.
The education technology (EdTech) sector is undergoing a period of rapid expansion and innovation, as both startups and established companies recognize the potential of the metaverse for enhancing educational experiences.
These companies are actively developing specialized platforms, tools, and content tailored to educational needs within virtual environments. This focus on metaverse-based solutions is driving significant growth and diversification within the EdTech market, expanding its reach and impact on the education sector.
Projections indicate that the global metaverse in education market is expected to experience a CAGR of 37.9% from 2025 to 2035
| Historical CAGR from 2020 to 2025 | 41.4% |
|---|---|
| Forecast CAGR from 2025 to 2035 | 37.9% |
According to the provided table, South Korea and Japan emerge as the top revenue-generating countries, underscoring their prominence in the market.
South Korea's advanced technology infrastructure, government support for digital innovation, and cultural affinity for technology position the country as a promising market for the growth of the metaverse in education.
The Japanese government has shown keen interest in advancing digital transformation within the education sector, aiming to enhance learning outcomes and stimulate innovation driving the market for metaverse in education.
| Countries | Forecast CAGRs from 2025 to 2035 |
|---|---|
| The United States | 37.9% |
| The United Kingdom | 38.9% |
| China | 38.6% |
| Japan | 39.3% |
| South Korea | 39.1% |
The metaverse in education market in the United States is expected to grow with a CAGR of 37.9% from 2025 to 2035. The United States has one of the largest education market in the world, with significant investments in both traditional and online education.
As the metaverse gains traction, it is likely to attract substantial investment from educational institutions, EdTech companies, venture capitalists, and other stakeholders looking to capitalize on its potential.
The United States is home to many innovation hubs, including Silicon Valley, Boston, and New York City, where a large concentration of technology companies, startups, research institutions, and educational organizations are based.
These hubs serve as hotbeds for innovation and collaboration in areas such as virtual reality, augmented reality, and educational technology, driving the development and adoption of metaverse solutions in education.
The metaverse in education market in the United Kingdom is expected to grow with a CAGR of 38.9% from 2025 to 2035. The United Kingdom government has shown interest in promoting digital innovation in education through various initiatives and funding programs.
For example, the Department for Education has supported projects aimed at enhancing digital skills and improving access to technology in schools. Such initiatives can facilitate the adoption of metaverse technologies in education and provide support for research and development in this area.
The United Kingdom is known for its vibrant creative industries, including gaming, animation, and digital media. These sectors contribute to the development of immersive technologies such as virtual reality and augmented reality, which are integral to the metaverse.
The expertise and resources available in the UK's creative industries can drive innovation and collaboration in the application of metaverse technologies to education.
The metaverse in education market in the China is expected to grow with a CAGR of 38.6% from 2025 to 2035. China is a global leader in technology adoption and innovation, with a rapidly growing market for virtual reality (VR), augmented reality (AR), and other immersive technologies.
The country's large pool of tech-savvy consumers and businesses provides a fertile ground for the development and adoption of metaverse technologies in education.
The Chinese government has shown strong support for digital transformation in education, emphasizing the importance of leveraging technology to improve learning outcomes and promote innovation. Initiatives such as 'Internet Plus Education' and 'smart Education' encourage the integration of digital technologies, including the metaverse, into educational practices.

The metaverse in education market in the Japan is expected to grow with a CAGR of 39.3% from 2025 to 2035. Japan has a large and competitive education market, with a high demand for innovative educational solutions.
Japan's focus on science, technology, engineering, and mathematics (STEM) education aligns with the capabilities of the metaverse, making it a promising market for immersive learning experiences.
Japanese companies are actively exploring opportunities in the metaverse space, with partnerships and collaborations emerging between educational institutions, technology firms, and content developers. These collaborations aim to leverage the strengths of each partner to create innovative educational content, platforms, and experiences tailored to the Japanese market.

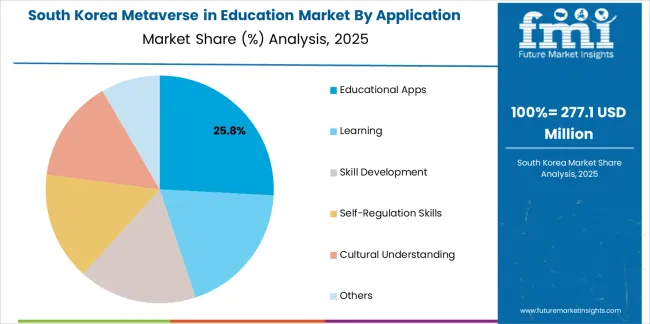
The metaverse in education market in the South Korea is expected to grow with a CAGR of 39.1% from 2025 to 2035. South Korea is known for its advanced technology infrastructure and high levels of internet penetration.
The country has a strong focus on research and development, particularly in areas such as gaming, virtual reality (VR), and augmented reality (AR). This technological prowess provides a solid foundation for the development and adoption of metaverse technologies in education.
The increasing government initiatives such as the 'smart Education' program aim to leverage technology, including the metaverse, to enhance teaching and learning experiences in schools and universities in South Korea boost the market growth.
The below section shows the leading segment. The hardware segment is to grow at a CAGR of 37.7% from 2025 to 2035. Based on application, learning segment is anticipated to hold a dominant share through 2035. It is set to exhibit a CAGR of 37.5% from 2025 to 2035.
| Category | CAGR from 2025 to 2035 |
|---|---|
| Hardware | 37.7% |
| Learning | 37.5% |
Based on the component, the hardware segment is anticipated to thrive at a CAGR of 37.7% from 2025 to 2035. With the shift towards online and virtual learning, educational institutions are investing in hardware components such as virtual reality headsets, augmented reality glasses, powerful computers, and high-speed internet connections.
Hardware components such as VR headsets enable students to fully immerse themselves in virtual experiences. Advancements in hardware technology have made VR and AR devices more affordable, portable, and user-friendly.
This has lowered the barrier to entry for educational institutions looking to incorporate immersive technologies into their curriculum.
Based on the application, the learning segment is anticipated to thrive at a CAGR of 37.5% from 2025 to 2035. The Metaverse has the potential to make education more accessible and inclusive by breaking down geographical barriers and providing learning opportunities to individuals who may not have access to traditional educational resources.
Through virtual classrooms and online learning platforms, students from diverse backgrounds and locations can connect with educators and peers from around the world, fostering collaboration and cultural exchange.
The Metaverse enables personalized learning experiences tailored to individual students' needs, preferences, and learning styles. Through data analytics and artificial intelligence (AI), educational platforms in the Metaverse can track students' progress, identify areas for improvement, and deliver customized content and feedback in real-time.
This personalized approach to learning can enhance engagement, motivation, and academic performance.

Market players are focusing on developing high-quality educational content and experiences tailored to the immersive nature of the metaverse. This includes creating interactive simulations, virtual field trips, 3D models, and gamified learning experiences that engage students and enhance learning outcomes.
| Attributes | Details |
|---|---|
| Estimated Market Size in 2025 | USD 3.9 billion |
| Projected Market Valuation in 2035 | USD 98 billion |
| Value-based CAGR 2025 to 2035 | 37.9% |
| Forecast Period | 2025 to 2035 |
| Historical Data Available for | 2020 to 2025 |
| Market Analysis | Value in USD billion |
| Key Regions Covered | North America; Latin America; Western Europe; Eastern Europe; South Asia and Pacific; East Asia; Middle East and Africa |
| Key Market Segments Covered | Component, Application, Region |
| Key Countries Profiled | The United States, Canada, Brazil, Mexico, Germany, The United Kingdom, France, Spain, Italy, Russia, Poland, Czech Republic, Romania, India, Bangladesh, Australia, New Zealand, China, Japan, South Korea, GCC countries, South Africa, Israel |
| Key Companies Profiled | Invact Metaversity; Tomorrow’s Education; Sophia Technologies Ltd. Metaverse Group; Shenzhen Meten International Education Co. Ltd.; Shenzhen Shengxue Culture Communication Co. Ltd.; WU Executive Academy; 21K School; Luca & Friends; Skillful Craftsman Education Technology Ltd.; Jiangsu Hibao Tech Software Co. Ltd.; Roblox |
The global metaverse in education market is estimated to be valued at USD 5.4 billion in 2025.
The market size for the metaverse in education market is projected to reach USD 49.3 billion by 2035.
The metaverse in education market is expected to grow at a 24.8% CAGR between 2025 and 2035.
The key product types in metaverse in education market are hardware and software.
In terms of application, educational apps segment to command 26.0% share in the metaverse in education market in 2025.


Our Research Products

The "Full Research Suite" delivers actionable market intel, deep dives on markets or technologies, so clients act faster, cut risk, and unlock growth.

The Leaderboard benchmarks and ranks top vendors, classifying them as Established Leaders, Leading Challengers, or Disruptors & Challengers.

Locates where complements amplify value and substitutes erode it, forecasting net impact by horizon

We deliver granular, decision-grade intel: market sizing, 5-year forecasts, pricing, adoption, usage, revenue, and operational KPIs—plus competitor tracking, regulation, and value chains—across 60 countries broadly.

Spot the shifts before they hit your P&L. We track inflection points, adoption curves, pricing moves, and ecosystem plays to show where demand is heading, why it is changing, and what to do next across high-growth markets and disruptive tech

Real-time reads of user behavior. We track shifting priorities, perceptions of today’s and next-gen services, and provider experience, then pace how fast tech moves from trial to adoption, blending buyer, consumer, and channel inputs with social signals (#WhySwitch, #UX).

Partner with our analyst team to build a custom report designed around your business priorities. From analysing market trends to assessing competitors or crafting bespoke datasets, we tailor insights to your needs.
Supplier Intelligence
Discovery & Profiling
Capacity & Footprint
Performance & Risk
Compliance & Governance
Commercial Readiness
Who Supplies Whom
Scorecards & Shortlists
Playbooks & Docs
Category Intelligence
Definition & Scope
Demand & Use Cases
Cost Drivers
Market Structure
Supply Chain Map
Trade & Policy
Operating Norms
Deliverables
Buyer Intelligence
Account Basics
Spend & Scope
Procurement Model
Vendor Requirements
Terms & Policies
Entry Strategy
Pain Points & Triggers
Outputs
Pricing Analysis
Benchmarks
Trends
Should-Cost
Indexation
Landed Cost
Commercial Terms
Deliverables
Brand Analysis
Positioning & Value Prop
Share & Presence
Customer Evidence
Go-to-Market
Digital & Reputation
Compliance & Trust
KPIs & Gaps
Outputs
Full Research Suite comprises of:
Market outlook & trends analysis
Interviews & case studies
Strategic recommendations
Vendor profiles & capabilities analysis
5-year forecasts
8 regions and 60+ country-level data splits
Market segment data splits
12 months of continuous data updates
DELIVERED AS:
PDF EXCEL ONLINE
Educational Tourism Market Analysis - Size, Share, and Forecast Outlook 2025 to 2035
Educational Toys Market Analysis and Overview by Category, End-use Sector, and Area through 2035
Educational Robots Market Analysis by Type, Application, and Region Through 2035
M-Education Market Size and Share Forecast Outlook 2025 to 2035
UK Educational Tourism Market Insights – Size, Demand & Innovations 2025-2035
USA Educational Tourism Market Report – Size, Growth & Industry Trends 2025-2035
Smart Education and Learning Market Analysis by Component, Learning, End User, and Region Through 2035
China Educational Tourism Market Insights – Trends, Growth & Forecast 2025-2035
NLP In Education Market Forecast and Outlook 2025 to 2035
Europe Educational Tourism Market Trends - Growth & Forecast 2025 to 2035
France Educational Tourism Market Analysis – Trends, Growth & Forecast 2025-2035
Digital Education Market Growth – Trends & Forecast 2024-2034
Consumer Metaverse Market Size and Share Forecast Outlook 2025 to 2035
Executive Education Program Market Size and Share Forecast Outlook 2025 to 2035
Australia Educational Tourism Market Report – Growth, Innovations & Forecast 2025-2035
Industry Share & Competitive Positioning in Executive Education Program
AI In K-12 Education Market Size and Share Forecast Outlook 2025 to 2035
Key Companies & Market Share in United States Executive Education Program Sector
Gamification in Education Market Size and Share Forecast Outlook 2025 to 2035
Canada Executive Education Program Market Size and Share Forecast Outlook 2025 to 2035

Thank you!
You will receive an email from our Business Development Manager. Please be sure to check your SPAM/JUNK folder too.
Chat With
MaRIA