Fibrillating Rollers Market Size and Share Forecast Outlook (2023 to 2033)

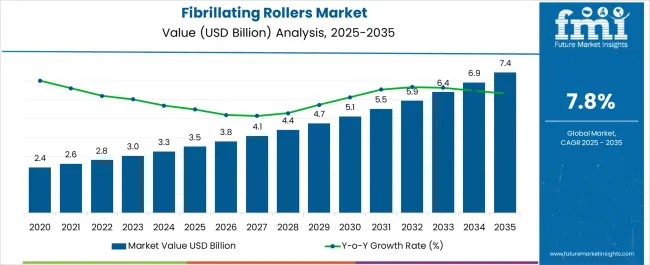
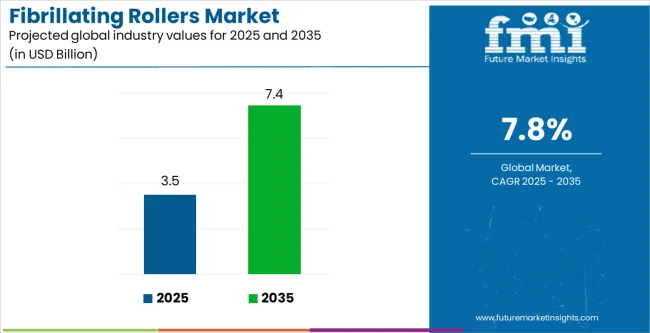
The Fibrillating Rollers market size is projected to be worth USD 3 billion in 2023. The market is likely to surpass USD 5.3 billion by 2033 at a CAGR of 8.2% during the forecast period.

The market growth of the market is being driven by the increasing demand for fibrillated paper in various end-use industries, such as food packaging, medical, and industrial. To improve product quality and performance in different application areas.

The demand for fibrillated paper is expected to grow in these industries due to its superior properties, such as its ability to provide a better barrier to moisture and oxygen, its hemostatic and absorptive properties, and its filtration and abrasive properties.

Other Drivers Propelling the Demand for Fibrillating Rollers include:

  • The rise in disposable income in developing countries is leading to an increase in demand for fibrillated paper in these countries.
  • Governments in many countries are imposing regulations that require the use of fibrillated paper in certain applications. This is also driving demand for the product.
  • The increasing demand for fibrillated paper is driving demand for fibrillating rollers.
  • The development of new and innovative fibrillating rollers is also driving demand for the finished product.

Challenges for Companies /Manufacturers in the Fibrillating Rollers Market:

  • The cost of raw materials, such as steel and rubber, can fluctuate, which can impact the profitability of fibrillating roller manufacturers. Companies need to be able to manage their costs effectively in order to remain competitive.
  • The Fibrillating rollers market is constantly evolving, and companies need to invest in research and development in order to stay ahead of the curve. This includes costly investment, but it is essential for long-term success.
  • The Fibrillating rollers market is a competitive market, with a number of established players. This can create the entry barriers for new entrants in the market.
  • Fibrillating rollers serve as crucial components in many industrial processes, and their performance has a major effect on the final product's quality

Opportunities in the Fibrillating Rollers Industry:

  • The Fibrillating rollers market is continually evolving, with new inventions developing on an ongoing basis. This creates an opportunity for companies that design new and innovative fibrillating rollers that fulfill customer needs.
  • The increasing demand for sustainable fibrillated products creates opportunities for companies that manufacture fibrillated paper from sustainable materials.
  • There may be opportunities for companies and manufacturers to expand into new markets or geographic regions. The company that can offer cost-effective and high-quality fibrillating rollers.
  • The growth of the fibrillating rollers in the market is highly potential in a number of regions, including Asia-Pacific, Europe, and North America. This growth is creating opportunities for companies that export fibrillating rollers.

Latest Trends in the Fibrillating Rollers Market:

  • The significant technological advancements in the production of fibrillating rollers. These advancements have led to the development of more efficient and cost-effective rollers, which is driving the growth of the market.
  • There is a growing demand for high-quality food products, in emerging markets such as Asia and South America are becoming increasingly important in the Fibrillating Rollers Market.
  • With The increasing number of consumers seeking organic and natural food products, the demand for fibrillating rollers has grown rapidly.
  • The growing demand for high-quality products is driving the demand for fibrillating rollers that can ensure consistent and high-quality products.
Attributes Details
Fibrillating Rollers Market Size (2023) USD 3 billion
Fibrillating Rollers Market Projected Size (2033) USD 5.3 billion
Value CAGR (2023 to 2033) 8.2%

Comparison of Historical vs Future Outlook on Fibrillating Rollers Market Demand (2018 to 2022 vs 2023 to 2033)

From 2018 to 2022, the global Fibrillating Rollers market experienced a CAGR of 8.2%, reaching a market size of USD 3 billion in 2023.

From 2018 to 2022, the global Fibrillating Rollers industry witnessed steady growth due to the increased demand for high-quality goods, the demand for organic and natural foods, and advances in technology anticipated to contribute to the demand for fibrillating rollers.

As consumers become more health-conscious and seek higher-quality foods, the demand for fibrillating rollers is projected to grow. Additionally, the implementation of stringent regulations by governments across the globe further propelled market growth during this period.

Future Market Forecast for the Fibrillating Rollers Industry

Looking forward, the global Fibrillating Rollers industry is expected to rise at a CAGR of 8.2% from 2023 to 2033. During the forecast period, the market size is expected to surpass USD 5.3 billion.

The Fibrillating Rollers industry is expected to continue its growth trajectory from 2023 to 2033, driven by growth in demand for high-quality food products and increasing consumer awareness of the importance of organic and natural foods. Technological advancements are also expected to drive efficiency and productivity in food processing, further contributing to the growth of the industry.

The market is also likely to witness significant growth in the Asia Pacific region due to the presence of significantly growing economies such as China and India. However, market growth may be hindered by the emergence of alternative technologies and the high installation and maintenance costs associated with fibrillating rollers.
Country-Wise Insights on Fibrillating Rollers Market Trends

Fibrillating Rollers Market to Surge in the United States Amid Growing Concerns over Food and Beverage Industrial.

Country The United States
Market Size (USD billion) by End of Forecast Period (2033) USD 1 billion
CAGR % 2023 to End of Forecast (2033) 6.8%

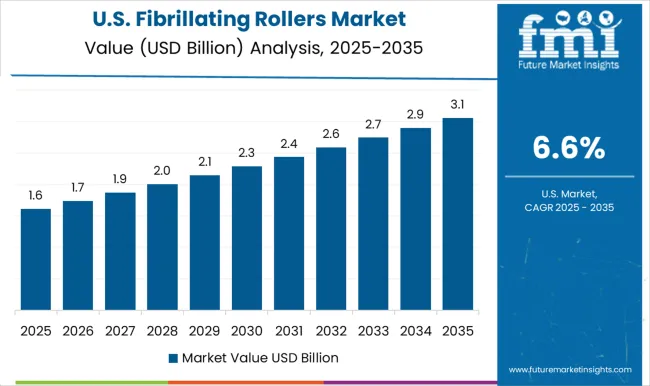
The Fibrillating Rollers industry in the United States is expected to reach a market share of USD 1 billion by 2033, expanding at a CAGR of 6.8%.

The Fibrillating Rollers industry in the United States is expected to witness growth due to the increasing demand for high-quality food products and the growing concerns over the food and beverage industry. Additionally, there are couple of other factors expected to drive the demand for fibrillating Rollers in the country:

  • The presence of a large number of manufacturers
  • The stringent regulations imposed by the government regarding concerns over health.

Rising Demand for Fibrillating Rollers in Pharmaceutical and cosmetics industries to Propel the France Market Growth

Country France
Market Size (USD billion) by End of Forecast Period (2033) USD 0.72 billion
CAGR % 2023 to End of Forecast (2033) 6.1%

The Fibrillating roller industry in France is expected to reach a market share of USD 0.72 billion, expanding at a CAGR of 6.1% during the forecast period. The France market is projected to experience growth owing to the rising demand for fibrillating rollers in the Pharmaceutical and cosmetics industries.

The production of tablets and capsules in the pharmaceutical industry, and in the production of creams and lotions in the cosmetics industry, and the demand for other high-quality and consistent products in these industries are driving the demand for Fibrillating Rollers in France.

Notable Growth Expected in China's Fibrillating Rollers Market Driving Chemical and petrochemical industries.

Country China
Market Size (USD billion) by End of Forecast Period (2033) USD 1.35 billion
CAGR % 2023 to End of Forecast (2033) 7.3%

The Fibrillating Rollers industry in China is anticipated to reach a market share of USD 1.35 billion, moving at a CAGR of 7.3 % during the forecast period.

The Fibrillating Rollers industry in China is expected to grow prominently due to the increase in high-quality and consistent products in these industries is driving the demand for Fibrillating Rollers, Additionally, the government's focus on industrial upgrading and the development of the chemical industry is also expected to contribute to the growth of the Fibrillating Rollers market in China.
Increasing Adoption of Fibrillating Rollers in Various Industries to Drive Market Growth in Japan

Country Japan
Market Size (USD billion) by End of Forecast Period (2033) USD 0.55 billion
CAGR % 2023 to End of Forecast (2033) 7.5%

The Fibrillating Rollers industry in Japan is estimated to reach a market share of USD 0.55 billion by 2033, thriving at a CAGR of 7.5%. The market in Japan is predicted to grow because of the increasing adoption of Fibrillating Rollers in various industries, such as food and beverage, pharmaceuticals, and chemicals, Additionally, the growing awareness of the importance of food safety and hygiene, are also expected to contribute to the growth of the fibrillating rollers market in Japan.

Demand for Fibrillating Rollers in Textile Industry to Fuel Market Growth in Brazil

Country Brazil
Market Size (USD billion) by End of Forecast Period (2033) USD 0.88 billion
CAGR % 2023 to End of Forecast (2033) 7.8%

The Fibrillating Rollers industry in Brazil is expected to reach a market share of USD 0.88 billion, expanding at a CAGR of 7.8% during the forecast period. The Brazilian textile industry is one of the largest and most advanced in the South America Region, and the demand for high-quality and consistent textiles is driving the adoption of Fibrillating Rollers in the industry.

Additionally, the increasing awareness of the importance of sustainable and eco-friendly textiles, and the growing demand for organic and natural textiles, are also contributing to the growth of the Fibrillating Rollers market in Brazil.

Category-Wise Insights into Fibrillating Rollers Industry Applications

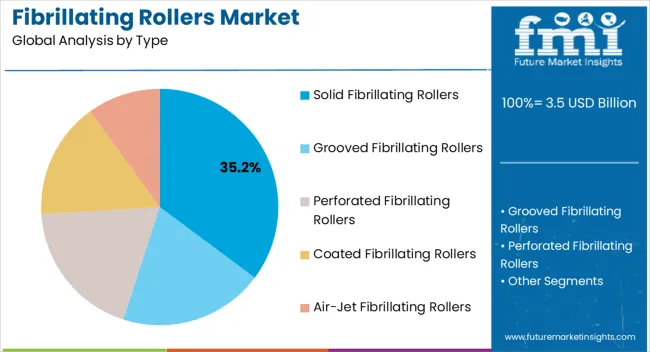
Solid Fibrillating Rollers Segment to Dominate Fibrillating Rollers Industry with 8.2% CAGR through 2033

The solid fibrillating roller segment is expected to dominate the Fibrillating Rollers industry with a CAGR of 8.2% from 2022 to 2033. This segment captures a significant market share in 2023 due to its cost-effectiveness, high efficiency, and low maintenance requirements.

Solid fibrillating rollers are highly used due to their ability to produce high-quality paper products with minimal waste. The increasing demand for mining, ceramics, and chemicals are the key factors driving the growth of the solid Fibrillating rollers segment in the Fibrillating Rollers industry.

How the Food and Beverage Industry is Driving the Fibrillating Rollers Market?

The Food and Beverage Industry is expected to dominate the Fibrillating Rollers industry with a CAGR of 8.0% from 2022 to 2033. This segment captures a significant market share in 2023 due to the demand for high-quality and consistent products and the increasing focus on health awareness among consumers.

Fibrillating Rollers are highly effective in the production of various food and beverage products such as tablets, capsules, and other pharmaceuticals, and in the production of creams and lotions, cosmetics, and other personal care products.

The factors such as the growing population, rising disposable income, and increasing health awareness among consumers. Additionally, the growing demand for organic and natural food and beverage products is also driving the adoption of Fibrillating Rollers in the industry.
How Market Players Stay Competitive in the Fibrillating Rollers Industry

The Fibrillating Rollers industry is highly competitive, with numerous players vying for market share. In such a scenario, key players must adopt effective strategies to stay ahead of the competition.

Key Strategies Adopted by the Players

Product Innovation

Companies invest hugely in research and development to introduce innovative products that offer enhanced efficiency, reliability, and cost-effectiveness. Product innovation enables companies to differentiate themselves from their competitors and cater to the evolving needs of customers.

Strategic Partnerships and Collaborations

Key players in the industry often form strategic partnerships and collaborations with other companies to leverage their strengths and expand their reach in the market. Such collaborations also allow companies to gain access to new technologies and markets.

Expansion into Emerging Markets

The Fibrillating Rollers industry is witnessing significant growth in emerging markets such as China and India. Key players are expanding their presence in these markets by establishing local manufacturing facilities and strengthening their distribution networks.

Mergers and Acquisitions

Key players in the Fibrillating Rollers industry often merge to consolidate their market position, expand their product portfolio, and gain access to new markets.

Key Players in the Fibrillating Rollers Industry

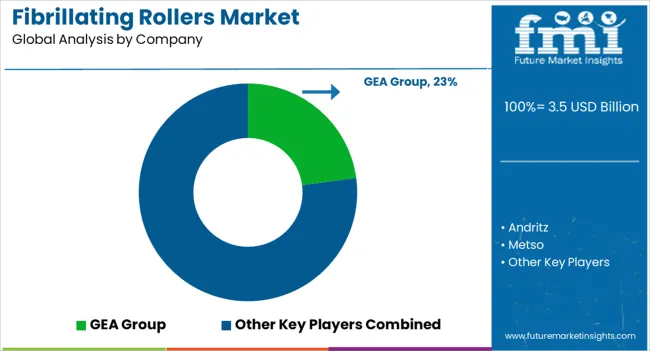
  • GEA Group
  • Andritz
  • Metso
  • Schlumberger
  • Valmet
  • Danieli

Key Developments in the Fibrillating Rollers Market:

  • GEA Group has developed a new generation of Fibrillating Rollers that are more efficient and cost-effective. These rollers are designed to improve the production process and reduce costs for customers.
  • The Austrian company Andritz has developed a new generation of Fibrillating Rollers that are more efficient and sustainable. These rollers are designed to reduce the environmental impact of the production process and improve the quality of the final product.
  • Metso has developed a new generation of Fibrillating Rollers that are more efficient and user-friendly. These rollers are designed to improve the production process and reduce the need for maintenance and repair.

Segmentation Analysis of the Fibrillating Rollers Market

By Type:

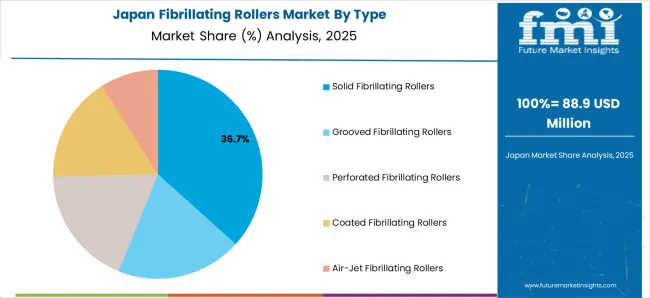
  • Solid Fibrillating Rollers
  • Grooved Fibrillating Rollers
  • Perforated Fibrillating Rollers
  • Coated Fibrillating Rollers
  • Air-jet Fibrillating Rollers

By Application:

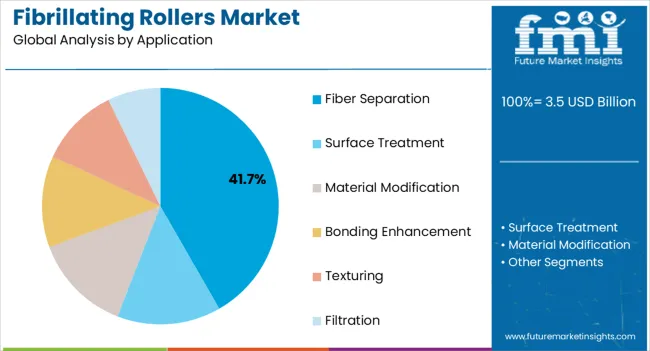
  • Fiber Separation
  • Surface Treatment
  • Material Modification
  • Bonding Enhancement
  • Texturing
  • Filtration

By End Use Industry:

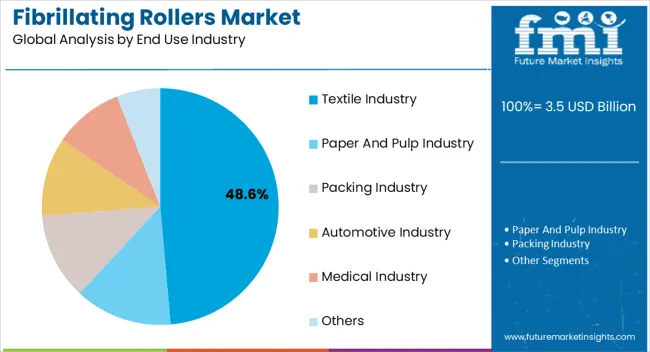
  • Textile Industry
  • Paper and pulp Industry
  • Packing Industry
  • Automotive Industry
  • Medical Industry
  • Others

By Region:

  • North America
  • Latin America
  • Western Europe
  • Eastern Europe
  • East Asia
  • South Asia Pacific
  • Middle East & Africa

Table of Content

  • 1. Executive Summary
  • 2. Market Overview
  • 3. Key Market Trends
  • 4. Key Success Factors
  • 5. Global Market Demand Analysis 2018 to 2022 and Forecast, 2023 to 2033
  • 6. Global Market - Pricing Analysis
  • 7. Global Market Demand (in Value or Size in USD Million) Analysis 2018 to 2022 and Forecast, 2023 to 2033
  • 8. Market Background
  • 9. Global Market Analysis 2018 to 2022 and Forecast 2023 to 2033, By Type
    • 9.1. Solid Fibrillating Rollers
    • 9.2. Grooved Fibrillating Rollers
    • 9.3. Perforated Fibrillating Rollers
    • 9.4. Coated Fibrillating Rollers
    • 9.5. Air-jet Fibrillating Rollers
  • 10. Global Market Analysis 2018 to 2022 and Forecast 2023 to 2033, By Application
    • 10.1. Fiber Separation
    • 10.2. Surface Treatment
    • 10.3. Material Modification
    • 10.4. Bonding Enhancement
    • 10.5. Texturing
    • 10.6. Filtration
  • 11. Global Market Analysis 2018 to 2022 and Forecast 2023 to 2033, By End Use Industry
    • 11.1. Textile Industry
    • 11.2. Paper and Pulp Industry
    • 11.3. Packing Industry
    • 11.4. Automotive Industry
    • 11.5. Medical Industry
    • 11.6. Others
  • 12. Global Market Analysis 2018 to 2022 and Forecast 2023 to 2033, by Region
    • 12.1. North America
    • 12.2. Latin America
    • 12.3. Western Europe
    • 12.4. Eastern Europe
    • 12.5. Central Asia
    • 12.6. Russia & Belarus
    • 12.7. Balkan & Baltic Countries
    • 12.8. Middle East and Africa (MEA)
    • 12.9. East Asia
    • 12.10. South Asia and Pacific
  • 13. North America Market Analysis 2018 to 2022 and Forecast 2023 to 2033
  • 14. Latin America Market Analysis 2018 to 2022 and Forecast 2023 to 2033
  • 15. Western Europe Market Analysis 2018 to 2022 and Forecast 2023 to 2033
  • 16. Eastern Europe Market Analysis 2018 to 2022 and Forecast 2023 to 2033
  • 17. Central Asia Market Analysis 2018 to 2022 and Forecast 2023 to 2033
  • 18. Russia & Belarus Market Analysis 2018 to 2022 and Forecast 2023 to 2033
  • 19. Balkan & Baltic Countries Market Analysis 2018 to 2022 and Forecast 2023 to 2033
  • 20. South Asia and Pacific Market Analysis 2018 to 2022 and Forecast 2023 to 2033
  • 21. East Asia Market Analysis 2018 to 2022 and Forecast 2023 to 2033
  • 22. Middle East and Africa Market Analysis 2018 to 2022 and Forecast 2023 to 2033
  • 23. Country-wise Market Analysis
  • 24. Market Structure Analysis
  • 25. Competition Analysis
    • 25.1. GEA Group
    • 25.2. Andritz
    • 25.3. Metso
    • 25.4. Schlumberger
    • 25.5. Valmet
    • 25.6. Danieli
    • 25.7. American Pulper Company
    • 25.8. Finishing Systems, Inc.
    • 25.9. Komet-Torras GmbH
    • 25.10. Sirio S.p.A.
  • 26. Primary Insights
  • 27. Assumptions and Acronyms Used
  • 28. Research Methodology

List of Tables

Table 1: Global Markets Value (US$ Million) Forecast by Region, 2017 & 2032

Table 2: Global Markets Volume (Units) Forecast by Region, 2017 & 2032

Table 3: Global Markets Value (US$ Million) Forecast by Type , 2017 & 2032

Table 4: Global Markets Volume (Units) Forecast by Type , 2017 & 2032

Table 5: Global Markets Value (US$ Million) Forecast by Application, 2017 & 2032

Table 6: Global Markets Volume (Units) Forecast by Application, 2017 & 2032

Table 7: Global Markets Value (US$ Million) Forecast by End Use Industry, 2017 & 2032

Table 8: Global Markets Volume (Units) Forecast by End Use Industry, 2017 & 2032

Table 9: North America Markets Value (US$ Million) Forecast by Country, 2017 & 2032

Table 10: North America Markets Volume (Units) Forecast by Country, 2017 & 2032

Table 11: North America Markets Value (US$ Million) Forecast by Type , 2017 & 2032

Table 12: North America Markets Volume (Units) Forecast by Type , 2017 & 2032

Table 13: North America Markets Value (US$ Million) Forecast by Application, 2017 & 2032

Table 14: North America Markets Volume (Units) Forecast by Application, 2017 & 2032

Table 15: North America Markets Value (US$ Million) Forecast by End Use Industry, 2017 & 2032

Table 16: North America Markets Volume (Units) Forecast by End Use Industry, 2017 & 2032

Table 17: Latin America Markets Value (US$ Million) Forecast by Country, 2017 & 2032

Table 18: Latin America Markets Volume (Units) Forecast by Country, 2017 & 2032

Table 19: Latin America Markets Value (US$ Million) Forecast by Type , 2017 & 2032

Table 20: Latin America Markets Volume (Units) Forecast by Type , 2017 & 2032

Table 21: Latin America Markets Value (US$ Million) Forecast by Application, 2017 & 2032

Table 22: Latin America Markets Volume (Units) Forecast by Application, 2017 & 2032

Table 23: Latin America Markets Value (US$ Million) Forecast by End Use Industry, 2017 & 2032

Table 24: Latin America Markets Volume (Units) Forecast by End Use Industry, 2017 & 2032

Table 25: Western Europe Markets Value (US$ Million) Forecast by Country, 2017 & 2032

Table 26: Western Europe Markets Volume (Units) Forecast by Country, 2017 & 2032

Table 27: Western Europe Markets Value (US$ Million) Forecast by Type , 2017 & 2032

Table 28: Western Europe Markets Volume (Units) Forecast by Type , 2017 & 2032

Table 29: Western Europe Markets Value (US$ Million) Forecast by Application, 2017 & 2032

Table 30: Western Europe Markets Volume (Units) Forecast by Application, 2017 & 2032

Table 31: Western Europe Markets Value (US$ Million) Forecast by End Use Industry, 2017 & 2032

Table 32: Western Europe Markets Volume (Units) Forecast by End Use Industry, 2017 & 2032

Table 33: Eastern Europe Markets Value (US$ Million) Forecast by Country, 2017 & 2032

Table 34: Eastern Europe Markets Volume (Units) Forecast by Country, 2017 & 2032

Table 35: Eastern Europe Markets Value (US$ Million) Forecast by Type , 2017 & 2032

Table 36: Eastern Europe Markets Volume (Units) Forecast by Type , 2017 & 2032

Table 37: Eastern Europe Markets Value (US$ Million) Forecast by Application, 2017 & 2032

Table 38: Eastern Europe Markets Volume (Units) Forecast by Application, 2017 & 2032

Table 39: Eastern Europe Markets Value (US$ Million) Forecast by End Use Industry, 2017 & 2032

Table 40: Eastern Europe Markets Volume (Units) Forecast by End Use Industry, 2017 & 2032

Table 41: East Asia Markets Value (US$ Million) Forecast by Country, 2017 & 2032

Table 42: East Asia Markets Volume (Units) Forecast by Country, 2017 & 2032

Table 43: East Asia Markets Value (US$ Million) Forecast by Type , 2017 & 2032

Table 44: East Asia Markets Volume (Units) Forecast by Type , 2017 & 2032

Table 45: East Asia Markets Value (US$ Million) Forecast by Application, 2017 & 2032

Table 46: East Asia Markets Volume (Units) Forecast by Application, 2017 & 2032

Table 47: East Asia Markets Value (US$ Million) Forecast by End Use Industry, 2017 & 2032

Table 48: East Asia Markets Volume (Units) Forecast by End Use Industry, 2017 & 2032

Table 49: South Asia Markets Value (US$ Million) Forecast by Country, 2017 & 2032

Table 50: South Asia Markets Volume (Units) Forecast by Country, 2017 & 2032

Table 51: South Asia Markets Value (US$ Million) Forecast by Type , 2017 & 2032

Table 52: South Asia Markets Volume (Units) Forecast by Type , 2017 & 2032

Table 53: South Asia Markets Value (US$ Million) Forecast by Application, 2017 & 2032

Table 54: South Asia Markets Volume (Units) Forecast by Application, 2017 & 2032

Table 55: South Asia Markets Value (US$ Million) Forecast by End Use Industry, 2017 & 2032

Table 56: South Asia Markets Volume (Units) Forecast by End Use Industry, 2017 & 2032

Table 57: MEA Markets Value (US$ Million) Forecast by Country, 2017 & 2032

Table 58: MEA Markets Volume (Units) Forecast by Country, 2017 & 2032

Table 59: MEA Markets Value (US$ Million) Forecast by Type , 2017 & 2032

Table 60: MEA Markets Volume (Units) Forecast by Type , 2017 & 2032

Table 61: MEA Markets Value (US$ Million) Forecast by Application, 2017 & 2032

Table 62: MEA Markets Volume (Units) Forecast by Application, 2017 & 2032

Table 63: MEA Markets Value (US$ Million) Forecast by End Use Industry, 2017 & 2032

Table 64: MEA Markets Volume (Units) Forecast by End Use Industry, 2017 & 2032

List of Figures

Figure 1: Global Markets Value (US$ Million) by Type, 2022 & 2032

Figure 2: Global Markets Value (US$ Million) by Application, 2022 & 2032

Figure 3: Global Markets Value (US$ Million) by End Use Industry, 2022 & 2032

Figure 4: Global Markets Value (US$ Million) by Region, 2022 & 2032

Figure 5: Global Markets Value (US$ Million) Analysis by Region, 2017 & 2032

Figure 6: Global Markets Volume (Units) Analysis by Region, 2017 & 2032

Figure 7: Global Markets Value Share (%) and BPS Analysis by Region, 2022 & 2032

Figure 8: Global Markets Y-o-Y Growth (%) Projections by Region, 2022 to 2032

Figure 9: Global Markets Value (US$ Million) Analysis by Type, 2017 & 2032

Figure 10: Global Markets Volume (Units) Analysis by Type, 2017 & 2032

Figure 11: Global Markets Value Share (%) and BPS Analysis by Type, 2022 & 2032

Figure 12: Global Markets Y-o-Y Growth (%) Projections by Type, 2022 to 2032

Figure 13: Global Markets Value (US$ Million) Analysis by Application, 2017 & 2032

Figure 14: Global Markets Volume (Units) Analysis by Application, 2017 & 2032

Figure 15: Global Markets Value Share (%) and BPS Analysis by Application, 2022 & 2032

Figure 16: Global Markets Y-o-Y Growth (%) Projections by Application, 2022 to 2032

Figure 17: Global Markets Value (US$ Million) Analysis by End Use Industry, 2017 & 2032

Figure 18: Global Markets Volume (Units) Analysis by End Use Industry, 2017 & 2032

Figure 19: Global Markets Value Share (%) and BPS Analysis by End Use Industry, 2022 & 2032

Figure 20: Global Markets Y-o-Y Growth (%) Projections by End Use Industry, 2022 to 2032

Figure 21: Global Markets Attractiveness by Type, 2022 to 2032

Figure 22: Global Markets Attractiveness by Application, 2022 to 2032

Figure 23: Global Markets Attractiveness by End Use Industry, 2022 to 2032

Figure 24: Global Markets Attractiveness by Region, 2022 to 2032

Figure 25: North America Markets Value (US$ Million) by Type, 2022 & 2032

Figure 26: North America Markets Value (US$ Million) by Application, 2022 & 2032

Figure 27: North America Markets Value (US$ Million) by End Use Industry, 2022 & 2032

Figure 28: North America Markets Value (US$ Million) by Country, 2022 & 2032

Figure 29: North America Markets Value (US$ Million) Analysis by Country, 2017 & 2032

Figure 30: North America Markets Volume (Units) Analysis by Country, 2017 & 2032

Figure 31: North America Markets Value Share (%) and BPS Analysis by Country, 2022 & 2032

Figure 32: North America Markets Y-o-Y Growth (%) Projections by Country, 2022 to 2032

Figure 33: North America Markets Value (US$ Million) Analysis by Type, 2017 & 2032

Figure 34: North America Markets Volume (Units) Analysis by Type, 2017 & 2032

Figure 35: North America Markets Value Share (%) and BPS Analysis by Type, 2022 & 2032

Figure 36: North America Markets Y-o-Y Growth (%) Projections by Type, 2022 to 2032

Figure 37: North America Markets Value (US$ Million) Analysis by Application, 2017 & 2032

Figure 38: North America Markets Volume (Units) Analysis by Application, 2017 & 2032

Figure 39: North America Markets Value Share (%) and BPS Analysis by Application, 2022 & 2032

Figure 40: North America Markets Y-o-Y Growth (%) Projections by Application, 2022 to 2032

Figure 41: North America Markets Value (US$ Million) Analysis by End Use Industry, 2017 & 2032

Figure 42: North America Markets Volume (Units) Analysis by End Use Industry, 2017 & 2032

Figure 43: North America Markets Value Share (%) and BPS Analysis by End Use Industry, 2022 & 2032

Figure 44: North America Markets Y-o-Y Growth (%) Projections by End Use Industry, 2022 to 2032

Figure 45: North America Markets Attractiveness by Type, 2022 to 2032

Figure 46: North America Markets Attractiveness by Application, 2022 to 2032

Figure 47: North America Markets Attractiveness by End Use Industry, 2022 to 2032

Figure 48: North America Markets Attractiveness by Country, 2022 to 2032

Figure 49: Latin America Markets Value (US$ Million) by Type, 2022 & 2032

Figure 50: Latin America Markets Value (US$ Million) by Application, 2022 & 2032

Figure 51: Latin America Markets Value (US$ Million) by End Use Industry, 2022 & 2032

Figure 52: Latin America Markets Value (US$ Million) by Country, 2022 & 2032

Figure 53: Latin America Markets Value (US$ Million) Analysis by Country, 2017 & 2032

Figure 54: Latin America Markets Volume (Units) Analysis by Country, 2017 & 2032

Figure 55: Latin America Markets Value Share (%) and BPS Analysis by Country, 2022 & 2032

Figure 56: Latin America Markets Y-o-Y Growth (%) Projections by Country, 2022 to 2032

Figure 57: Latin America Markets Value (US$ Million) Analysis by Type, 2017 & 2032

Figure 58: Latin America Markets Volume (Units) Analysis by Type, 2017 & 2032

Figure 59: Latin America Markets Value Share (%) and BPS Analysis by Type, 2022 & 2032

Figure 60: Latin America Markets Y-o-Y Growth (%) Projections by Type, 2022 to 2032

Figure 61: Latin America Markets Value (US$ Million) Analysis by Application, 2017 & 2032

Figure 62: Latin America Markets Volume (Units) Analysis by Application, 2017 & 2032

Figure 63: Latin America Markets Value Share (%) and BPS Analysis by Application, 2022 & 2032

Figure 64: Latin America Markets Y-o-Y Growth (%) Projections by Application, 2022 to 2032

Figure 65: Latin America Markets Value (US$ Million) Analysis by End Use Industry, 2017 & 2032

Figure 66: Latin America Markets Volume (Units) Analysis by End Use Industry, 2017 & 2032

Figure 67: Latin America Markets Value Share (%) and BPS Analysis by End Use Industry, 2022 & 2032

Figure 68: Latin America Markets Y-o-Y Growth (%) Projections by End Use Industry, 2022 to 2032

Figure 69: Latin America Markets Attractiveness by Type, 2022 to 2032

Figure 70: Latin America Markets Attractiveness by Application, 2022 to 2032

Figure 71: Latin America Markets Attractiveness by End Use Industry, 2022 to 2032

Figure 72: Latin America Markets Attractiveness by Country, 2022 to 2032

Figure 73: Western Europe Markets Value (US$ Million) by Type, 2022 & 2032

Figure 74: Western Europe Markets Value (US$ Million) by Application, 2022 & 2032

Figure 75: Western Europe Markets Value (US$ Million) by End Use Industry, 2022 & 2032

Figure 76: Western Europe Markets Value (US$ Million) by Country, 2022 & 2032

Figure 77: Western Europe Markets Value (US$ Million) Analysis by Country, 2017 & 2032

Figure 78: Western Europe Markets Volume (Units) Analysis by Country, 2017 & 2032

Figure 79: Western Europe Markets Value Share (%) and BPS Analysis by Country, 2022 & 2032

Figure 80: Western Europe Markets Y-o-Y Growth (%) Projections by Country, 2022 to 2032

Figure 81: Western Europe Markets Value (US$ Million) Analysis by Type, 2017 & 2032

Figure 82: Western Europe Markets Volume (Units) Analysis by Type, 2017 & 2032

Figure 83: Western Europe Markets Value Share (%) and BPS Analysis by Type, 2022 & 2032

Figure 84: Western Europe Markets Y-o-Y Growth (%) Projections by Type, 2022 to 2032

Figure 85: Western Europe Markets Value (US$ Million) Analysis by Application, 2017 & 2032

Figure 86: Western Europe Markets Volume (Units) Analysis by Application, 2017 & 2032

Figure 87: Western Europe Markets Value Share (%) and BPS Analysis by Application, 2022 & 2032

Figure 88: Western Europe Markets Y-o-Y Growth (%) Projections by Application, 2022 to 2032

Figure 89: Western Europe Markets Value (US$ Million) Analysis by End Use Industry, 2017 & 2032

Figure 90: Western Europe Markets Volume (Units) Analysis by End Use Industry, 2017 & 2032

Figure 91: Western Europe Markets Value Share (%) and BPS Analysis by End Use Industry, 2022 & 2032

Figure 92: Western Europe Markets Y-o-Y Growth (%) Projections by End Use Industry, 2022 to 2032

Figure 93: Western Europe Markets Attractiveness by Type, 2022 to 2032

Figure 94: Western Europe Markets Attractiveness by Application, 2022 to 2032

Figure 95: Western Europe Markets Attractiveness by End Use Industry, 2022 to 2032

Figure 96: Western Europe Markets Attractiveness by Country, 2022 to 2032

Figure 97: Eastern Europe Markets Value (US$ Million) by Type, 2022 & 2032

Figure 98: Eastern Europe Markets Value (US$ Million) by Application, 2022 & 2032

Figure 99: Eastern Europe Markets Value (US$ Million) by End Use Industry, 2022 & 2032

Figure 100: Eastern Europe Markets Value (US$ Million) by Country, 2022 & 2032

Figure 101: Eastern Europe Markets Value (US$ Million) Analysis by Country, 2017 & 2032

Figure 102: Eastern Europe Markets Volume (Units) Analysis by Country, 2017 & 2032

Figure 103: Eastern Europe Markets Value Share (%) and BPS Analysis by Country, 2022 & 2032

Figure 104: Eastern Europe Markets Y-o-Y Growth (%) Projections by Country, 2022 to 2032

Figure 105: Eastern Europe Markets Value (US$ Million) Analysis by Type, 2017 & 2032

Figure 106: Eastern Europe Markets Volume (Units) Analysis by Type, 2017 & 2032

Figure 107: Eastern Europe Markets Value Share (%) and BPS Analysis by Type, 2022 & 2032

Figure 108: Eastern Europe Markets Y-o-Y Growth (%) Projections by Type, 2022 to 2032

Figure 109: Eastern Europe Markets Value (US$ Million) Analysis by Application, 2017 & 2032

Figure 110: Eastern Europe Markets Volume (Units) Analysis by Application, 2017 & 2032

Figure 111: Eastern Europe Markets Value Share (%) and BPS Analysis by Application, 2022 & 2032

Figure 112: Eastern Europe Markets Y-o-Y Growth (%) Projections by Application, 2022 to 2032

Figure 113: Eastern Europe Markets Value (US$ Million) Analysis by End Use Industry, 2017 & 2032

Figure 114: Eastern Europe Markets Volume (Units) Analysis by End Use Industry, 2017 & 2032

Figure 115: Eastern Europe Markets Value Share (%) and BPS Analysis by End Use Industry, 2022 & 2032

Figure 116: Eastern Europe Markets Y-o-Y Growth (%) Projections by End Use Industry, 2022 to 2032

Figure 117: Eastern Europe Markets Attractiveness by Type, 2022 to 2032

Figure 118: Eastern Europe Markets Attractiveness by Application, 2022 to 2032

Figure 119: Eastern Europe Markets Attractiveness by End Use Industry, 2022 to 2032

Figure 120: Eastern Europe Markets Attractiveness by Country, 2022 to 2032

Figure 121: East Asia Markets Value (US$ Million) by Type, 2022 & 2032

Figure 122: East Asia Markets Value (US$ Million) by Application, 2022 & 2032

Figure 123: East Asia Markets Value (US$ Million) by End Use Industry, 2022 & 2032

Figure 124: East Asia Markets Value (US$ Million) by Country, 2022 & 2032

Figure 125: East Asia Markets Value (US$ Million) Analysis by Country, 2017 & 2032

Figure 126: East Asia Markets Volume (Units) Analysis by Country, 2017 & 2032

Figure 127: East Asia Markets Value Share (%) and BPS Analysis by Country, 2022 & 2032

Figure 128: East Asia Markets Y-o-Y Growth (%) Projections by Country, 2022 to 2032

Figure 129: East Asia Markets Value (US$ Million) Analysis by Type, 2017 & 2032

Figure 130: East Asia Markets Volume (Units) Analysis by Type, 2017 & 2032

Figure 131: East Asia Markets Value Share (%) and BPS Analysis by Type, 2022 & 2032

Figure 132: East Asia Markets Y-o-Y Growth (%) Projections by Type, 2022 to 2032

Figure 133: East Asia Markets Value (US$ Million) Analysis by Application, 2017 & 2032

Figure 134: East Asia Markets Volume (Units) Analysis by Application, 2017 & 2032

Figure 135: East Asia Markets Value Share (%) and BPS Analysis by Application, 2022 & 2032

Figure 136: East Asia Markets Y-o-Y Growth (%) Projections by Application, 2022 to 2032

Figure 137: East Asia Markets Value (US$ Million) Analysis by End Use Industry, 2017 & 2032

Figure 138: East Asia Markets Volume (Units) Analysis by End Use Industry, 2017 & 2032

Figure 139: East Asia Markets Value Share (%) and BPS Analysis by End Use Industry, 2022 & 2032

Figure 140: East Asia Markets Y-o-Y Growth (%) Projections by End Use Industry, 2022 to 2032

Figure 141: East Asia Markets Attractiveness by Type, 2022 to 2032

Figure 142: East Asia Markets Attractiveness by Application, 2022 to 2032

Figure 143: East Asia Markets Attractiveness by End Use Industry, 2022 to 2032

Figure 144: East Asia Markets Attractiveness by Country, 2022 to 2032

Figure 145: South Asia Markets Value (US$ Million) by Type, 2022 & 2032

Figure 146: South Asia Markets Value (US$ Million) by Application, 2022 & 2032

Figure 147: South Asia Markets Value (US$ Million) by End Use Industry, 2022 & 2032

Figure 148: South Asia Markets Value (US$ Million) by Country, 2022 & 2032

Figure 149: South Asia Markets Value (US$ Million) Analysis by Country, 2017 & 2032

Figure 150: South Asia Markets Volume (Units) Analysis by Country, 2017 & 2032

Figure 151: South Asia Markets Value Share (%) and BPS Analysis by Country, 2022 & 2032

Figure 152: South Asia Markets Y-o-Y Growth (%) Projections by Country, 2022 to 2032

Figure 153: South Asia Markets Value (US$ Million) Analysis by Type, 2017 & 2032

Figure 154: South Asia Markets Volume (Units) Analysis by Type, 2017 & 2032

Figure 155: South Asia Markets Value Share (%) and BPS Analysis by Type, 2022 & 2032

Figure 156: South Asia Markets Y-o-Y Growth (%) Projections by Type, 2022 to 2032

Figure 157: South Asia Markets Value (US$ Million) Analysis by Application, 2017 & 2032

Figure 158: South Asia Markets Volume (Units) Analysis by Application, 2017 & 2032

Figure 159: South Asia Markets Value Share (%) and BPS Analysis by Application, 2022 & 2032

Figure 160: South Asia Markets Y-o-Y Growth (%) Projections by Application, 2022 to 2032

Figure 161: South Asia Markets Value (US$ Million) Analysis by End Use Industry, 2017 & 2032

Figure 162: South Asia Markets Volume (Units) Analysis by End Use Industry, 2017 & 2032

Figure 163: South Asia Markets Value Share (%) and BPS Analysis by End Use Industry, 2022 & 2032

Figure 164: South Asia Markets Y-o-Y Growth (%) Projections by End Use Industry, 2022 to 2032

Figure 165: South Asia Markets Attractiveness by Type, 2022 to 2032

Figure 166: South Asia Markets Attractiveness by Application, 2022 to 2032

Figure 167: South Asia Markets Attractiveness by End Use Industry, 2022 to 2032

Figure 168: South Asia Markets Attractiveness by Country, 2022 to 2032

Figure 169: MEA Markets Value (US$ Million) by Type, 2022 & 2032

Figure 170: MEA Markets Value (US$ Million) by Application, 2022 & 2032

Figure 171: MEA Markets Value (US$ Million) by End Use Industry, 2022 & 2032

Figure 172: MEA Markets Value (US$ Million) by Country, 2022 & 2032

Figure 173: MEA Markets Value (US$ Million) Analysis by Country, 2017 & 2032

Figure 174: MEA Markets Volume (Units) Analysis by Country, 2017 & 2032

Figure 175: MEA Markets Value Share (%) and BPS Analysis by Country, 2022 & 2032

Figure 176: MEA Markets Y-o-Y Growth (%) Projections by Country, 2022 to 2032

Figure 177: MEA Markets Value (US$ Million) Analysis by Type, 2017 & 2032

Figure 178: MEA Markets Volume (Units) Analysis by Type, 2017 & 2032

Figure 179: MEA Markets Value Share (%) and BPS Analysis by Type, 2022 & 2032

Figure 180: MEA Markets Y-o-Y Growth (%) Projections by Type, 2022 to 2032

Figure 181: MEA Markets Value (US$ Million) Analysis by Application, 2017 & 2032

Figure 182: MEA Markets Volume (Units) Analysis by Application, 2017 & 2032

Figure 183: MEA Markets Value Share (%) and BPS Analysis by Application, 2022 & 2032

Figure 184: MEA Markets Y-o-Y Growth (%) Projections by Application, 2022 to 2032

Figure 185: MEA Markets Value (US$ Million) Analysis by End Use Industry, 2017 & 2032

Figure 186: MEA Markets Volume (Units) Analysis by End Use Industry, 2017 & 2032

Figure 187: MEA Markets Value Share (%) and BPS Analysis by End Use Industry, 2022 & 2032

Figure 188: MEA Markets Y-o-Y Growth (%) Projections by End Use Industry, 2022 to 2032

Figure 189: MEA Markets Attractiveness by Type, 2022 to 2032

Figure 190: MEA Markets Attractiveness by Application, 2022 to 2032

Figure 191: MEA Markets Attractiveness by End Use Industry, 2022 to 2032

Figure 192: MEA Markets Attractiveness by Country, 2022 to 2032

Frequently Asked Questions

What is the market value in 2023?

The market in 2023 is valued at USD 3 billion.

What is the CAGR for the Brazil market?

The Brazil will register a 7.8% CAGR until 2033.

What will be the growth rate until 2033?

Until 2033, the market will experience a 8.2% CAGR.

What will be the market value in 2033?

The market shall reach USD 5.3 billion in 2033.

What is the CAGR for the Japan market from 2023 to 2033?

The Japan will register a 7.5% CAGR until 2033.

Explore Similar Insights

Future Market Insights

Fibrillating Rollers Market