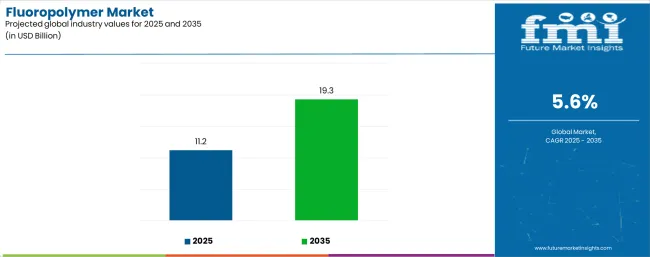
The global fluoropolymer market is forecasted to reach USD 19.3 billion by 2035, recording an absolute increase of USD 8.1 billion over the forecast period. The market is valued at USD 11.2 billion in 2025 and is set to rise at a CAGR of 5.6% during the assessment period. The overall market size is expected to grow by nearly 1.7 times during the same period, supported by increasing demand for high-performance polymer solutions worldwide, driving demand for efficient chemical-resistant and temperature-stable materials and increasing investments in semiconductor manufacturing, electric vehicle production, and advanced healthcare applications globally. The environmental regulations regarding PFAS substances and high production costs for specialty grades may pose challenges to market expansion.
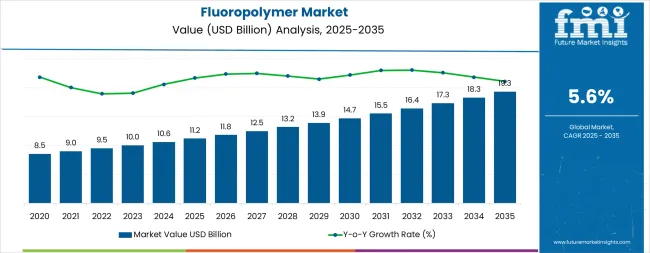
Between 2025 and 2030, the market is projected to expand from USD 11.2 billion to USD 14.6 billion, resulting in a value increase of USD 3.4 billion, which represents 42.0% of the total forecast growth for the decade. This phase of development will be shaped by rising demand for semiconductor manufacturing and electric vehicle applications, product innovation in high-purity grades and specialty formulations, as well as expanding integration with battery production systems and advanced electronics manufacturing. Companies are establishing competitive positions through investment in PVDF battery binder technologies, biocompatible medical-grade polymers, and strategic market expansion across electronics, automotive, and chemical processing applications.
From 2030 to 2035, the market is forecast to grow from USD 14.6 billion to USD 19.3 billion, adding another USD 4.7 billion, which constitutes 58.0% of the overall ten-year expansion. This period is expected to be characterized by the expansion of specialized fluoropolymer systems, including advanced melt-processable grades and integrated high-performance solutions tailored for specific industry requirements, strategic collaborations between fluoropolymer manufacturers and end-user industries, and an enhanced focus on green production processes and regulatory compliance. The growing focus on electric vehicle adoption and semiconductor capacity expansion will drive demand for advanced, high-performance fluoropolymer solutions across diverse industrial applications.
| Metric | Value |
|---|---|
| Market Value (2025) | USD 11.2 billion |
| Market Forecast Value (2035) | USD 19.3 billion |
| Forecast CAGR (2025 to 2035) | 5.6% |
The market grows by enabling manufacturers to achieve superior chemical resistance, thermal stability, and electrical insulation properties in demanding applications, ranging from semiconductor equipment to electric vehicle components. Industrial manufacturers face mounting pressure to improve product reliability and performance under extreme conditions, with fluoropolymer solutions typically providing exceptional resistance to temperatures exceeding 200°C and harsh chemical environments, making these materials essential for critical manufacturing operations. The semiconductor industry's need for ultra-pure materials that withstand aggressive cleaning chemicals and high-temperature processes creates constant demand for PTFE, PFA, and FEP grades that ensure contamination-free production environments.
Electric vehicle adoption accelerates demand for PVDF battery binders that enhance lithium-ion cell performance and durability, while automotive wire harnesses require fluoropolymer insulation for high-voltage safety and thermal management. Government initiatives promoting clean energy adoption and stringent safety standards drive adoption in battery manufacturing, semiconductor fabrication, and medical device applications, where material performance directly impacts product reliability and regulatory compliance. However, increasing regulatory scrutiny of PFAS substances and the complexity of developing environmentally eco-friendly alternatives may limit adoption rates among cost-sensitive applications and regions with stringent environmental policies.
The market is segmented by product type, end use, form/format, and region. By product type, the market is divided into PTFE, PVDF, FEP, PFA, ETFE, PVF, PCTFE, and others. Based on end use, the market is categorized into electrical & electronics, industrial processing & chemical, automotive, healthcare/medical, construction/infrastructure, and other applications. By form/format, the market is segmented into resins & compounds, films & sheets, coatings & linings, wire & cable insulation, and membranes. Regionally, the market is divided into Asia Pacific, Europe, North America, Latin America, and Middle East & Africa.
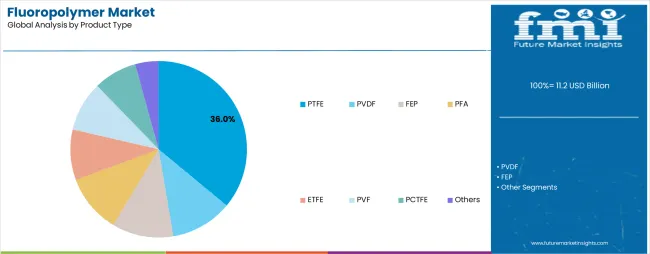
The PTFE segment represents the dominant force in the market, capturing approximately 36.0% of total market share in 2025. This advanced material category encompasses polytetrafluoroethylene formulations featuring exceptional chemical resistance, low friction coefficients, and superior thermal stability characteristics that enable reliable performance across temperatures from -200°C to +260°C. The PTFE segment's market leadership stems from its unmatched combination of chemical inertness and mechanical properties, with applications spanning semiconductor equipment components, chemical processing seals and gaskets, non-stick cookware coatings, and high-performance bearings requiring long-term durability.
The PVDF segment maintains a substantial 24.0% market share, driven by rapid adoption in lithium-ion battery manufacturing as binder materials and separator coatings, alongside architectural coatings and chemical processing applications. FEP holds 9.0% market share through transparent film applications and wire insulation, while PFA accounts for 7.0% in ultra-pure semiconductor applications. ETFE captures 6.0% through architectural membrane and wire applications, PVF represents 5.0% in photovoltaic backsheet films, PCTFE holds 3.0% in specialty pharmaceutical packaging, and other fluoropolymers including ECTFE, CTFE, and fluoroelastomers account for 10.0%.
Key technological advantages driving the PTFE segment include:
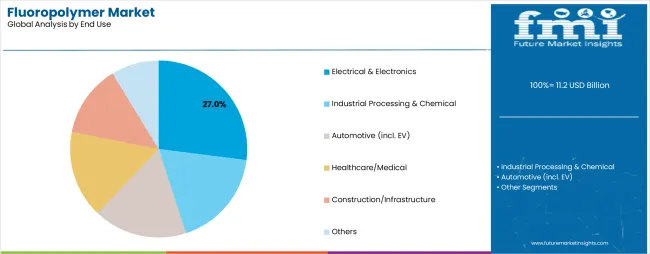
Electrical & electronics applications dominate the market with approximately 27.0% market share in 2025, reflecting the critical role of fluoropolymers in semiconductor fabrication equipment, wire and cable insulation, and electronic component manufacturing supporting global digital infrastructure development. The electrical & electronics segment's market leadership is reinforced by accelerating semiconductor capacity expansion, 5G network deployment, and data center growth requiring high-purity fluoropolymer components that withstand aggressive plasma etching environments and provide reliable electrical insulation.
The industrial processing & chemical segment represents the second-largest end-use category, capturing 22.0% market share through critical applications in chemical reactor linings, pump components, valve seals, and piping systems requiring corrosion resistance and thermal stability. This segment benefits from ongoing chemical plant modernization and specialty chemical production requiring materials that maintain integrity when exposed to concentrated acids, bases, and organic solvents.
The automotive segment accounts for 18.0% market share, driven by electric vehicle wire harness insulation, fuel system components, and battery manufacturing applications. Healthcare/medical applications capture 14.0% market share through biocompatible tubing, implantable device components, and pharmaceutical processing equipment. Construction/infrastructure represents 12.0% through architectural coatings, membrane structures, and cable applications, while other applications including aerospace, consumer goods, and energy account for 7.0% of the market.
Key market dynamics supporting end-use growth include:
Resins & compounds dominate the market with approximately 42.0% market share in 2025, reflecting the versatility of fluoropolymer raw materials that serve as feedstock for downstream processing into finished components and products across diverse manufacturing applications. The resins & compounds segment's market leadership is supported by its fundamental position in the fluoropolymer value chain, supplying material for injection molding, extrusion, and compression molding processes that create custom components for automotive, semiconductor, and chemical processing industries.
Films & sheets represent the second-largest form category, capturing 24.0% market share through packaging applications, release films for composite manufacturing, photovoltaic backsheets, and architectural membranes. This segment benefits from growing demand for thin, flexible fluoropolymer films that provide chemical barrier properties and weather resistance in outdoor applications.
Coatings & linings account for 18.0% market share, serving non-stick cookware, chemical reactor protection, and architectural finishing applications. Wire & cable insulation captures 11.0% market share through high-voltage power cables, data transmission cables, and automotive wire harnesses. Membranes including ion-exchange and filtration applications represent 5.0% of the market, driven by fuel cell technology and water treatment systems.
Key factors driving resins & compounds segment dominance include:
The market is driven by three concrete demand factors tied to performance optimization outcomes. First, semiconductor manufacturing expansion and advanced node technology transitions create increasing demand for ultra-high-purity fluoropolymers, with global semiconductor equipment spending projected to exceed USD 100 billion annually, requiring PTFE, PFA, and FEP components that withstand plasma etching processes and maintain contamination-free production environments. Second, electric vehicle adoption and battery manufacturing scale-up drive explosive growth in PVDF demand, with EV battery production requiring specialized binder materials that enhance lithium-ion cell energy density, cycle life, and safety performance while supporting charging rates and thermal management. Third, chemical processing industry modernization and specialty chemical production expansion require corrosion-resistant fluoropolymer linings and components, as manufacturers upgrade facilities to handle increasingly aggressive chemical processes and meet stringent environmental and safety regulations.
Market restraints include heightened regulatory scrutiny of PFAS substances creating uncertainty around long-term product availability and driving costly reformulation efforts, particularly in Europe and North America where environmental authorities are implementing restrictions on per- and polyfluoroalkyl substances. High production costs for specialty fluoropolymer grades pose another significant challenge, as manufacturing processes require specialized equipment, controlled environments, and extensive quality testing that result in premium pricing compared to conventional polymers, potentially limiting adoption in price-sensitive applications. Raw material supply chain concentration creates vulnerability to disruptions, as fluoropolymer production depends on limited sources of fluorspar and hydrofluoric acid that face geopolitical and environmental constraints.
Key trends indicate accelerated development of melt-processable fluoropolymer grades that enable thinner wall sections and more complex geometries for electric vehicle wire coatings and semiconductor equipment parts, improving manufacturing efficiency while maintaining performance characteristics. Innovation in PVDF formulations specifically optimized for next-generation battery chemistries, including solid-state and lithium-metal technologies, positions manufacturers to capture emerging opportunities in advanced energy storage. Growing focus on green production methods and alternative chemistries that address PFAS concerns while maintaining critical performance attributes drives research and development investment across major fluoropolymer producers. However, the market thesis could face disruption if regulatory restrictions on PFAS substances accelerate beyond industry adaptation capabilities or if alternative high-performance polymers achieve comparable performance characteristics at lower cost and environmental impact.
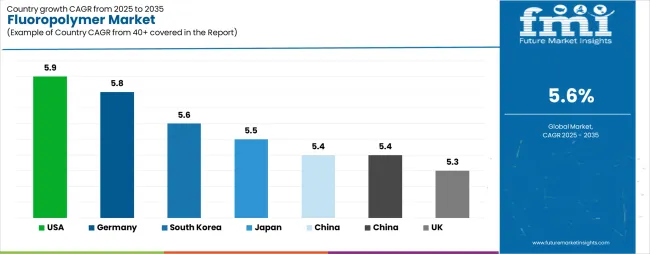
| Country | CAGR (2025 to 2035) |
|---|---|
| USA | 5.9% |
| Germany | 5.8% |
| South Korea | 5.6% |
| Japan | 5.5% |
| China | 5.4% |
| France | 5.4% |
| UK | 5.3% |
The market is gaining momentum worldwide, with the United States taking the lead thanks to robust semiconductor manufacturing expansion and aerospace industry demand combined with electric vehicle adoption. Close behind, Germany benefits from tier-1 automotive and EV battery supply chain integration coupled with semiconductor equipment manufacturing, positioning itself as a technology hub in Europe. South Korea shows strong advancement through memory and logic chip fabrication requiring high-purity fluoropolymer components and EV battery separator production. Japan demonstrates consistent growth driven by precision electronics manufacturing and stringent quality standards for high-purity grades across automotive and healthcare applications. China stands out for manufacturing scale in battery and solar applications combined with rapid chemical plant construction, and France and the United Kingdom continue to record progress in specialty chemicals, aerospace, and pharmaceutical processing. Together, the United States and Germany anchor the global expansion story, while Asia-Pacific markets build momentum through electronics and battery manufacturing concentration.
The report covers an in-depth analysis of 40+ countries, top-performing countries are highlighted below.
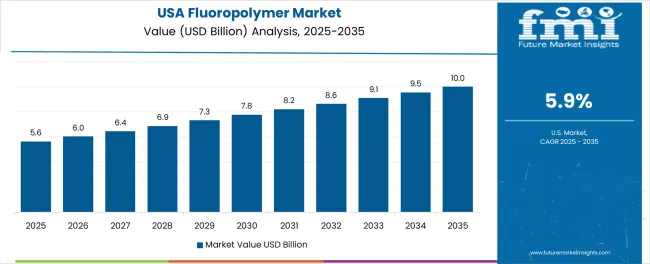
The United States demonstrates the strongest growth potential in the Fluoropolymer Market with a CAGR of 5.9% through 2035. The country's leadership position stems from massive semiconductor fabrication facility investments, aerospace industry requirements for high-performance components, and electric vehicle wire harness adoption requiring specialized fluoropolymer insulation. Growth is concentrated in major manufacturing regions, including Arizona, Texas, Ohio, and Oregon, where semiconductor fabs and automotive production facilities are implementing advanced fluoropolymer solutions for enhanced product performance and manufacturing yield optimization. Distribution channels through established chemical distributors and direct manufacturer relationships expand deployment across semiconductor equipment manufacturers, EV battery plants, and medical device production facilities. The country's advanced manufacturing initiatives and CHIPS Act funding provide policy support for domestic semiconductor production, driving constant demand for ultra-high-purity PTFE and PFA components.
Key market factors:
In major industrial centers including Bavaria, Baden-Württemberg, North Rhine-Westphalia, and Lower Saxony, the adoption of fluoropolymer systems is accelerating across automotive manufacturing facilities, semiconductor equipment production, and chemical processing centers, driven by electric vehicle battery supply chain development and manufacturing competitiveness requirements. The market demonstrates strong growth momentum with a CAGR of 5.8% through 2035, linked to comprehensive tier-1 automotive supplier networks and increasing focus on high-performance materials for EV platforms and semiconductor equipment. German manufacturers are implementing advanced fluoropolymer components and quality control systems to enhance product reliability while meeting growing demand for battery materials and chemical processing equipment in domestic and export markets. The country's automotive industry transformation toward electric mobility creates steady demand for PVDF battery binders and high-voltage wire insulation, while chemical industry leadership drives corrosion-resistant lining applications.
Key market characteristics:
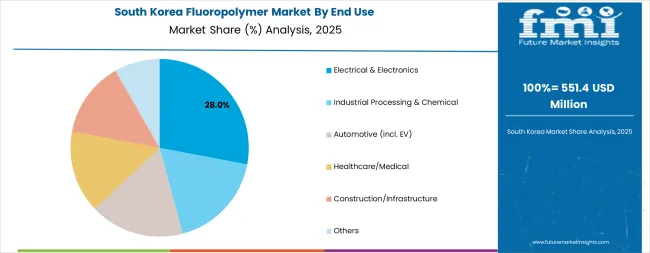
South Korea's advanced semiconductor industry demonstrates sophisticated implementation of fluoropolymer systems, with documented applications in memory chip fabrication, logic device production, and display manufacturing requiring ultra-high-purity materials. The country's manufacturing infrastructure in major industrial regions, including Gyeonggi Province, Chungcheong, and Yeongnam, showcases integration of advanced fluoropolymer components with existing semiconductor production systems, leveraging expertise in precision manufacturing and quality control. Korean manufacturers prioritize technology innovation and production efficiency, creating demand for high-performance PTFE and PFA solutions that support advanced node semiconductor processes and EV battery manufacturing. The market maintains strong growth through focus on electronics leadership and battery technology development, with a CAGR of 5.6% through 2035.
Key development areas:
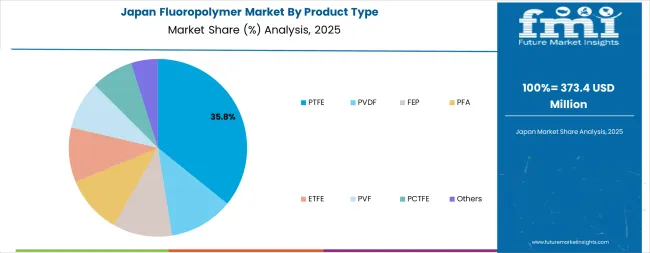
Japan's market demonstrates sophisticated implementation focused on precision electronics manufacturing and healthcare applications, with documented integration of high-purity fluoropolymer components achieving superior performance in semiconductor equipment and medical devices. The country maintains steady growth momentum with a CAGR of 5.5% through 2035, driven by manufacturers' focus on quality excellence and stringent material specifications that align with continuous improvement methodologies applied to advanced manufacturing operations. Major industrial regions, including Kanto, Kansai, Chubu, and Kyushu, showcase advanced deployment of fluoropolymer solutions where materials integrate seamlessly with existing quality management systems and comprehensive production control programs.
Key market characteristics:
China's market expansion is driven by massive battery and solar manufacturing capacity, including lithium-ion cell production in Jiangsu, Guangdong, and Fujian provinces, chemical plant construction across coastal industrial zones, and comprehensive localization of PTFE and PVDF production capabilities. The country demonstrates promising growth potential with a CAGR of 5.4% through 2035, supported by government policies promoting new energy vehicles and semiconductor industry development. Chinese manufacturers face technology transfer challenges and quality consistency requirements but are rapidly expanding domestic fluoropolymer production capacity to reduce import dependence. Growing EV battery manufacturing scale and chemical industry expansion create compelling business cases for fluoropolymer adoption, particularly in regions where domestic supply chains enhance cost competitiveness and delivery reliability.
Market characteristics:
France's market demonstrates strong positioning in specialty chemical production and aerospace applications, with documented integration of PVDF manufacturing capacity supporting European battery supply chains and architectural coatings markets. The country shows solid growth potential with a CAGR of 5.4% through 2035, driven by established chemical industry infrastructure in Auvergne-Rhône-Alpes, Normandy, and Île-de-France regions supporting specialty fluoropolymer production for aerospace, battery materials, and architectural applications. French manufacturers prioritize innovation in eco-friendly fluoropolymer formulations and high-performance grades that meet stringent European environmental regulations while maintaining technical performance requirements. Growing European battery manufacturing capacity and aerospace industry requirements create constant demand for domestically produced PVDF and specialty fluoropolymers.
Market development factors:
In England, Scotland, Wales, and Northern Ireland, manufacturing facilities are implementing fluoropolymer solutions to support aerospace component production and pharmaceutical processing equipment requirements, with documented applications in chemical-resistant linings and high-purity tubing systems. The market shows moderate growth potential with a CAGR of 5.3% through 2035, linked to aerospace manufacturing programs, pharmaceutical industry investment, and infrastructure modernization projects. British manufacturers are adopting advanced fluoropolymer components and quality systems to enhance product reliability while maintaining regulatory compliance demanded by UK and international standards. The country's aerospace industry strength creates steady demand for high-performance fluoropolymer components, while pharmaceutical sector growth drives biocompatible material requirements.
Market development factors:
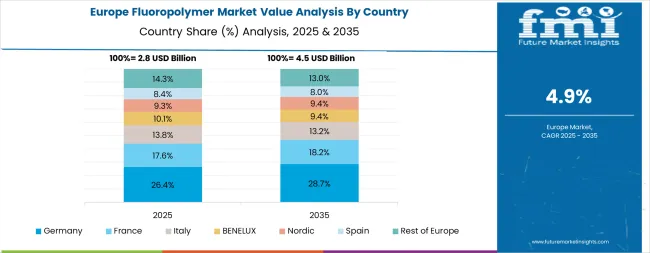
The fluoropolymer market in Europe accounts for approximately 27-29% of global revenues in 2025, demonstrating steady growth through electric vehicle battery supply chain development, semiconductor equipment manufacturing, and chemical processing modernization. Germany is expected to maintain its leadership position as the anchor market with strong presence across automotive, chemical, and semiconductor applications, supported by extensive manufacturing infrastructure in Munich, Stuttgart, Frankfurt, and Dresden regions.
France follows with significant market share driven by PVDF production capacity serving European battery manufacturers and architectural coating applications. The country benefits from established specialty chemical infrastructure and strategic positioning in aerospace and coatings markets. Italy holds substantial market share through chemical processing applications and specialty polymer production, while the Netherlands captures significant demand through chemical industry concentration and semiconductor equipment manufacturing.
Spain demonstrates growing adoption in construction coatings and industrial applications, while the Nordic region maintains steady demand through offshore energy, telecommunications infrastructure, and pharmaceutical processing. The United Kingdom shows consistent growth driven by aerospace, pharmaceutical, and infrastructure applications. Central and Eastern Europe, including Poland, Czech Republic, and Hungary, represent expanding markets driven by automotive component manufacturing and white goods production. The Rest of Europe accounts for the remaining regional market share.
PTFE and PVDF dominate European demand patterns, with PVDF pulled by the region's EV battery value chain including binders, separators, and cable jacketing, alongside architectural coatings providing weather resistance and aesthetic durability. PTFE, FEP, and PFA serve semiconductor equipment, chemical processing, and high-reliability wire and cable applications requiring superior chemical resistance and thermal stability. Western Europe concentrates specialty capacity in France, Italy, and Germany, whereas Central and Eastern Europe absorb increasing volumes in automotive components and consumer appliances. The EU's REACH and PFAS policy framework accelerates reformulation efforts and drives adoption of higher-purity grades, creating a net effect of steady volume growth with a tilt toward premium applications. Europe CAGR for 2025-2035 is estimated at 5.7%, slightly above the global average, with Germany serving as the anchor market and France and Italy following closely due to coatings, battery materials, and aerospace applications.
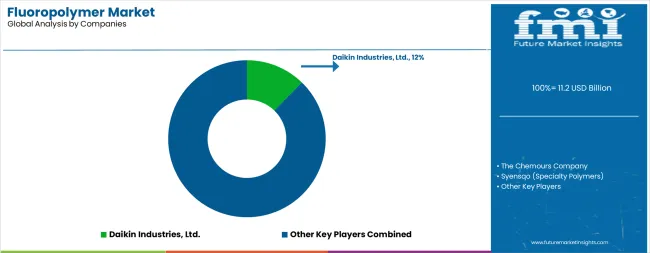
The market features approximately 15-20 meaningful players with moderate concentration, where the top three companies control roughly 32-38% of global market share through established technology platforms and extensive chemical manufacturing capabilities. Competition centers on material purity, technical performance, and application support rather than price competition alone. The leading company, Daikin Industries, commands approximately 12.5% of global market share through comprehensive fluoropolymer portfolios, advanced manufacturing technologies, and strong presence across PTFE, FEP, and specialty grades serving electronics and automotive markets.
Market leaders include Daikin Industries, The Chemours Company, and Syensqo (formerly Solvay Specialty Polymers), which maintain competitive advantages through comprehensive fluoropolymer solution portfolios, global production networks, and deep expertise in specialty polymer chemistry and application engineering, creating high switching costs for customers. These companies leverage research and development capabilities and ongoing technical support relationships to defend market positions while expanding into high-growth applications including EV battery materials and semiconductor components.
Challengers encompass Arkema and AGC Inc., which compete through specialized product lines and strong regional presence in key manufacturing markets. Technology specialists, including Dongyue Group, Gujarat Fluorochemicals, Kureha Corporation, Halopolymer, and 3M (Dyneon), focus on specific fluoropolymer types or vertical applications, offering differentiated capabilities in PVDF battery binders, medical-grade polymers, and specialty formulations with customized performance characteristics.
Regional players and emerging fluoropolymer producers create competitive pressure through capacity expansion and localization strategies, particularly in high-growth markets including China and India, where domestic production provides advantages in cost competitiveness and market responsiveness. Market dynamics favor companies that combine advanced fluoropolymer production technologies with comprehensive technical support offerings that address the complete material lifecycle from resin development through component fabrication support and application optimization programs.
Fluoropolymers represent specialized high-performance polymers containing fluorine atoms that enable manufacturers to achieve exceptional chemical resistance, thermal stability up to 260°C, and superior electrical insulation properties, delivering reliable performance in extreme environments with ultra-low friction and non-stick characteristics in demanding applications. With the market projected to grow from USD 11.2 billion in 2025 to USD 19.3 billion by 2035 at a 5.6% CAGR, these advanced polymer systems offer compelling advantages - outstanding durability, chemical inertness, and thermal stability - making them essential for electrical & electronics applications (27% market share), industrial processing (22% share), and automotive sectors seeking alternatives to conventional polymers that degrade under harsh chemical and thermal conditions. Scaling market adoption and eco-friendly development requires coordinated action across environmental policy frameworks, industry standards development, specialty chemical manufacturers, end-user industries, and materials science investment capital.
| Item | Value |
|---|---|
| Quantitative Units | USD 11.2 billion |
| Product Type | PTFE, PVDF, FEP, PFA, ETFE, PVF, PCTFE, Others (incl. ECTFE, CTFE, fluoroelastomers) |
| End Use | Electrical & Electronics, Industrial Processing & Chemical, Automotive (incl. EV), Healthcare/Medical, Construction/Infrastructure, Others (aerospace, consumer goods, energy) |
| Form/Format | Resins & Compounds, Films & Sheets, Coatings & Linings, Wire & Cable Insulation, Membranes (ion-exchange, filtration) |
| Regions Covered | Asia Pacific, Europe, North America, Latin America, Middle East & Africa |
| Country Covered | the USA, Germany, South Korea, Japan, China, France, the UK, and 40+ countries |
| Key Companies Profiled | Daikin Industries, The Chemours Company, Syensqo, Arkema, AGC, Dongyue Group, Gujarat Fluorochemicals, Kureha Corporation, Halopolymer, 3M |
| Additional Attributes | Dollar sales by product type, end use, and form/format categories, regional adoption trends across Asia Pacific, Europe, and North America, competitive landscape with fluoropolymer manufacturers and specialty chemical integrators, manufacturing facility requirements and specifications, integration with semiconductor fabrication and battery manufacturing initiatives, innovations in high-purity polymer technology and melt-processable systems, and development of specialized formulations with enhanced performance and environmental compliance capabilities. |
The global fluoropolymer market is estimated to be valued at USD 11.2 billion in 2025.
The market size for the fluoropolymer market is projected to reach USD 19.3 billion by 2035.
The fluoropolymer market is expected to grow at a 5.6% CAGR between 2025 and 2035.
The key product types in fluoropolymer market are ptfe, pvdf, fep, pfa, etfe, pvf, pctfe and others.
In terms of end use, electrical & electronics segment to command 27.0% share in the fluoropolymer market in 2025.


Full Research Suite comprises of:
Market outlook & trends analysis
Interviews & case studies
Strategic recommendations
Vendor profiles & capabilities analysis
5-year forecasts
8 regions and 60+ country-level data splits
Market segment data splits
12 months of continuous data updates
DELIVERED AS:
PDF EXCEL ONLINE
Fluoropolymer Film Market Forecast and Outlook 2025 to 2035
Fluoropolymer Additives Market Size and Share Forecast Outlook 2025 to 2035
Fluoropolymer Coating Market Analysis - Size, Share, and Forecast Outlook 2025 to 2035
Fluoropolymers in Healthcare Market Insights - Size, Trends & Forecast 2025 to 2035
High-purity Fluoropolymer Valves Market Size and Share Forecast Outlook 2025 to 2035
High Performance Fluoropolymer Market Size and Share Forecast Outlook 2025 to 2035

Thank you!
You will receive an email from our Business Development Manager. Please be sure to check your SPAM/JUNK folder too.
Chat With
MaRIA