Reports

- Global Locations -

Headquarters

Future Market Insights, Inc.

Christiana Corporate, 200
Continental Drive, Suite 401,
Newark, Delaware - 19713,
United States

T: +1-845-579-5705

Americas

Future Market Insights, Inc.

616 Corporate Way, Suite 2-9018,
Valley Cottage, NY 10989, United States

T: +1-347-918-3531

MEA

Future Market Insights

1602-6 Jumeirah Bay X2 Tower, Plot No: JLT-PH2-X2A,
Jumeirah Lakes Towers, Dubai,
United Arab Emirates

Europe

Future Market Insights

3rd Floor, 207 Regent Street,
W1B 3HH London
United Kingdom

T: + 44 (0) 20 8123 9659
D: +44 (0) 20 3287 4268

Asia Pacific

Future Market Insights

IndiaLand Global Tech Park, Unit UG-1, Behind Grand HighStreet, Phase 1, Hinjawadi, MH, Pune – 411057, India

FMCG Logistic Market Outlook for 2024 to 2034

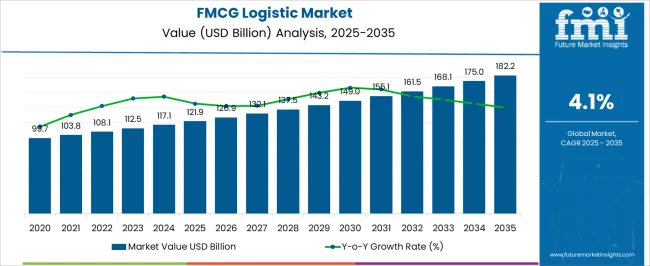
The FMCG logistic market is set to progress at a CAGR of 4.1% through 2034. The eCommerce sector within FMCG logistics is shaking the demand. The propulsion of the retail sector bodes well for FCMG logistics. Moreover, the adoption of green logistic practices is giving an eco-friendly look to the market. Following these trends, market players can expect the market to rise from US$ 117.1 billion in 2024 to US$ 175.0 billion by 2034

Attributes Details
FMCG Logistic Market Size, 2024 US$ 117.1 billion
Market Size, 2034 US$ 175.0 billion
Value CAGR (2024 to 2034) 4.1%

Don't pay for what you don't need

Customize your report by selecting specific countries or regions and save 30%!

Growth Drivers

Expansion of the eCommerce industry and developments

Rapid expansion of the eCommerce industry is pushing the FMCG logistics market forward. Consumer preferences are moving toward online shopping for FMCG products in the current period. Several investors are increasingly investing in the industry as a result of this shift. With the integration of better technology and convenience, the market is anticipated to gain much potential during the forecast period.

Activities related to research and development are growing across the world, and the FMCG industry is no exception. FMCG companies are actively investing in research and development activities to provide convenience to their consumers.

Furthermore, urbanization is making a significant contribution to multiplying the market share in the industry. As more people move to urban areas, the demand for products such as packaged beverages, food, and others keeps on going.

Disposable Income and Retail Industry Landscape

The rate of disposable income among middle-class people is on the rise. Individuals are spending money on beverages, personal care products, and others significantly, which is ominously contributing to market growth.

Furthermore, lifestyle changes of contemporary people are also making a significant contribution to market share during the forecast period. For instance, working professionals, millennials, and Gen Z populations prefer ready-to-eat meals and snacks. Therefore, the demand for FMCG logistic services is increasing.

The retail landscape is changing considerably in the current period. By offering a wide range of FMCG products, retailers such as supermarkets, hypermarkets, and online stores have become popular in recent years. Considering the hype of the retail segment, there could be a high demand for FMCG logistics over the period.

Some Challenges for the FMCG Logistic Market

  • The high competition is restraining market growth. Several international and local players are competing in the market to gain a share. Companies are constantly expanding their product portfolios to sustain their positions. New entrants could find it difficult to enter this landscape.
  • The constantly changing consumer preferences are creating challenges in the industry. Stakeholders need to upgrade their related products, such as packaging and labeling, according to consumer demand. Additionally, creating innovative products could be beneficial in this scenario.
  • Counterfeiting is a significant challenge in the logistics sector, and this has been impacting market growth. The surge in counterfeit products is anticipated to degrade companies' reputation and brand value.
Ronak Shah
Ronak Shah

Principal Consultant

Talk to Analyst

Find your sweet spots for generating winning opportunities in this market.

Comparative View of Adjacent Markets

In addition to the FMCG logistic market, an in-depth analysis has been done on two other related markets. The markets by name are the FMCG packaging market and the logistics robot market.

The food and beverage sector is a key factor driving market expansion during the forecast period. With the need to cut down warehouse labor expenditure and enable businesses to function efficiently, logistics robots have gained traction over the years.

FMCG Logistic Market:

Attributes FMCG Logistic Market
Value-based CAGR (2024 to 2034) 4.70%
Market Trend Integration of last-mile delivery solutions for faster and more efficient customer service
Growth Opportunity Offering value-added services such as real-time tracking and customized delivery options

FMCG Packaging Market:

Attributes FMCG Packaging Market
Value-based CAGR (2024 to 2034) 5.8%
Market Trends Adoption of smart packaging technologies for improved product safety and traceability
Growth Opportunities Collaborating with technology providers for digital packaging and interactive experiences

Logistics Robot Market:

Attributes Logistics Robot Market
Value-based CAGR (2024 to 2034) 16.5%
Market Trends Demand for collaborative robots (cobots) for human-robot collaboration in logistics operations
Growth Opportunities Developing specialized robots for specific logistics tasks such as inventory management and sorting

Category Wise Insights

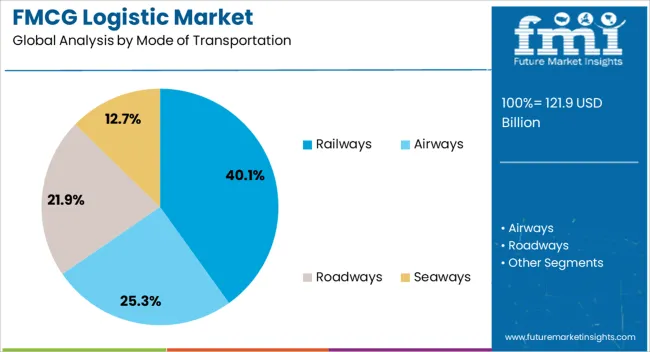
The Roadways Segment is Dominating the Market by Mode of Transportation

Attributes Details
Mode of Transportation Roadways
Market CAGR from 2024 to 2034 3.9%

With the need for efficient and timely deliveries of consumer goods, the roadway mode of transportation is becoming increasingly popular for logistic providers. To make transportation more reliable and efficient, logistics providers are moving their preferences toward roadway transportation.

Technological advancements are also contributing to the segment's growth. Market players are integrating the latest technologies, such as real-time tracking and AI, to make roadway transportation more competent.

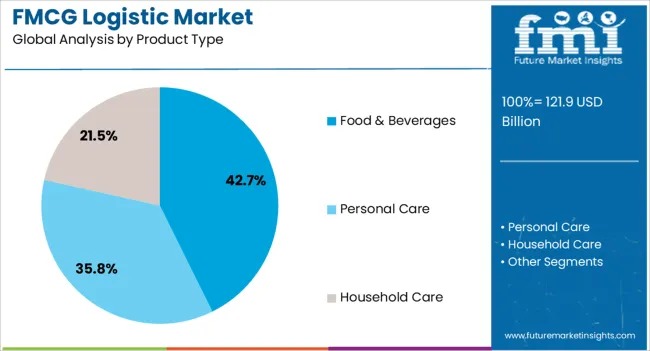
The Food and Beverages Segment is Gaining Popularity in the Market by Product Type

Attributes Details
Product Type Food & Beverages
Market CAGR from 2024 to 2034 3.7%

The rise of eCommerce and online food delivery is carrying the segment’s growth upward. People are increasingly ordering food through online platforms. Thus, the demand for FMCG logistic services is at its peak in this field. The perishable nature of foods is giving the segment an edge in the current period, as food products require special transportation.

Get the data you need at a Fraction of the cost

Personalize your report by choosing insights you need
and save 40%!

Country wise insights

Countries CAGR from 2024 to 2034
United States 4.3%
China 4.8%
United Kingdom 5.1%
Japan 5.6%
South Korea 6.0%

United States

The United States has a well-known retail market in the world, with key players like Walmart operating here. According to our source, total retail sales reached US$ 7.24 trillion in 2023 in the United States. There is a huge need for greater logistics, as retailers in the United States are expanding their product offerings and their footprints in the country.

FMCG companies are increasingly investing in sustainable supply chains to reduce carbon footprints and make the industry more eco-friendly in the country.

The development of new and innovative technology in the transportation sector has been seen in the United States. Logistics and suppliers are upgrading their systems with the integration of AI, the Internet of Things, and blockchains to improve supply visibility and reduce costs.

China

The FMCG logistics market in China has witnessed steady growth in recent years. Massive investment in FMCG logistics in China is currently being observed. As a technologically advanced country, logistics providers are increasingly improving their services with advanced technology in China.

The expansion of the eCommerce industry in China is leading to market growth. Services such as rapid home deliveries are gaining popularity in the country. Moreover, the government of China is actively improving the logistic infrastructure in the country, including ports, railways, and highways.

United Kingdom

Changing preferences toward green logistics in the United Kingdom are a key market trend. The government in the United Kingdom is actively promoting sustainability initiatives in the current period. Thus, logistic providers are searching for innovative ways to cope with these initiatives in their services without harming the environment.

The FMCG packaging industry in the United Kingdom is on the rise, which is positively impacting the market. In urban areas, the adoption of the latest technologies in packaging and transportation has been seen in the United Kingdom. The trend of online shopping has gained much popularity in the country, sparking market growth.

Japan

Demand for convenience products has increased over the years in Japan. The delivery needs for these products are fueled by the FMCG market growth in the country. Research and development activities are rapidly growing in the region to maintain innovative standards and meet the changing needs of consumers.

South Korea

FMCG companies in South Korea are actively looking to develop products that are eco-friendly as the government is implementing sustainability and eco-friendly initiatives in the country. Individuals are seeking instant deliveries of their products. Thus, logistics providers are focusing on improving their services according to consumer preferences.
Competitive Landscape

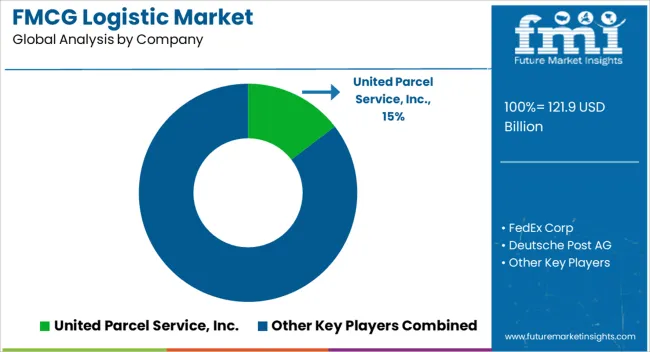
Market players are looking to improvising consumer experience by implementing new marketing strategies. The market is anticipated to gain exponential growth during the forecast period owing to innovations and research activities by top players. These players are investing in their logistics services to improve their services and gain maximum share in the market.

Many governments and governmental bodies are offering financial support to logistics providers to boost their research and development activities. Several strategies, like partnerships, mergers, and acquisitions, are changing the market landscape by disrupting traditional logistics methods and introducing unique methods.

Partnerships and Collaborations

In 2023, C.H. Robinson Worldwide, Inc. formed a strategic partnership with Waymo Via with the aim of driving the development of autonomous trucking solutions for supply chain management. This partnership plans to bring about significant advancements in the field of self-driving technology, particularly for long-haul trucking.

Through this collaboration, C.H. Robinson and Waymo Via are going to work together to explore new possibilities for integrating autonomous technology into the logistics industry. The ultimate motive is to improve efficiency, reduce costs, and enhance safety across the supply chain.

Recent Developments

  • In 2023, Reliance Retail increased its presence by adding 3,300 new stores, bringing its total number of stores to 18,040 with a remarkable combined area of 65.6 million square feet. This expansion is a testament to the company's commitment to delivering an exceptional shopping experience to its customers across India. With a wide array of products and services, Reliance Retail has become a go-to destination for many shoppers, making it one of the leading retail chains in the country.
  • In 2021, Cummins Inc., a prominent energy company and customer of One Network Enterprises, announced that it is ready to leverage the benefits of One Network's advanced platform. The platform integrates attribute-based forecasting, multi-level inventory optimization, and inbound shipment visibility features. With the introduction of the Network platform, Cummins is now able to enhance real-time visibility across its European aftermarket operations, thanks to One Network's cutting-edge supply chain control tower solution.

Key Player in the FMCG Logistic Market

  • C.H. Robinson Worldwide Inc.
  • United Parcel Service, Inc.
  • FedEx Corp
  • Deutsche Post AG
  • Kuehne+Nagel International AG
  • A.P. Moller - Maersk
  • Schenker AG
  • DSV Solutions
  • Nippon Express Holdings, Inc.
  • Landstar System Holdings, Inc.

Key Coverage in the FMCG Logistic Market

  • Fast-Moving Consumer Goods Logistics Industry Market Report
  • Retail Supply Chain Logistics Market Analysis
  • CPG Logistics Market Assessment
  • Logistics and Warehousing Solution for FMCG Industry Overview
  • FMCG Warehousing Industry Outlook

Key Segments

By Mode of Transportation:

  • Railways
  • Airways
  • Roadways
  • Seaways

By Product Type:

  • Food & Beverages
  • Personal Care
  • Household Care

By Region:

  • North America
  • Latin America
  • Europe
  • Asia Pacific
  • Middle East & Africa

Frequently Asked Questions

How will the FMCG Logistic Market Progress in the United States?

The CAGR of the FMCG logistic market in the United States from 2024 to 2034 is estimated to be 4.3%.

What is the Future Scope of the FMCG Logistic Market?

The FMCG logistic market is expected to develop at a CAGR of 4.1% from 2024 to 2034.

How is the FMCG Logistic Market?

The FMCG Logistic Market size is expected to be worth US$ 117.1 billion in 2024.

How will the FMCG Logistic Market Progress in China?

The CAGR of the FMCG logistic market in China from 2024 to 2034 is estimated to be 4.8%.

How Big Will the FMCG Logistic Market Be by 2034?

The FMCG logistic market is estimated to get as big as US$ 10.7 billion in 2034.

What are the Segments of the FMCG Logistic Market?

The FMCG logistic market can be divided by mode of transportation, product type, and region.

Table of Content

1. Executive Summary

    1.1. Global Market Outlook

    1.2. Demand-side Trends

    1.3. Supply-side Trends

    1.4. Technology Roadmap Analysis

    1.5. Analysis and Recommendations

2. Market Overview

    2.1. Market Coverage / Taxonomy

    2.2. Market Definition / Scope / Limitations

3. Market Background

    3.1. Market Dynamics

        3.1.1. Drivers

        3.1.2. Restraints

        3.1.3. Opportunity

        3.1.4. Trends

    3.2. Scenario Forecast

        3.2.1. Demand in Optimistic Scenario

        3.2.2. Demand in Likely Scenario

        3.2.3. Demand in Conservative Scenario

    3.3. Opportunity Map Analysis

    3.4. Investment Feasibility Matrix

    3.5. PESTLE and Porter’s Analysis

    3.6. Regulatory Landscape

        3.6.1. By Key Regions

        3.6.2. By Key Countries

    3.7. Regional Parent Market Outlook

4. Global Market Analysis 2019 to 2023 and Forecast, 2024 to 2034

    4.1. Historical Market Size Value (US$ Million) Analysis, 2019 to 2023

    4.2. Current and Future Market Size Value (US$ Million) Projections, 2024 to 2034

        4.2.1. Y-o-Y Growth Trend Analysis

        4.2.2. Absolute $ Opportunity Analysis

5. Global Market Analysis 2019 to 2023 and Forecast 2024 to 2034, By Product Type

    5.1. Introduction / Key Findings

    5.2. Historical Market Size Value (US$ Million) Analysis By Product Type, 2019 to 2023

    5.3. Current and Future Market Size Value (US$ Million) Analysis and Forecast By Product Type, 2024 to 2034

        5.3.1. Food & Beverages

        5.3.2. Personal Care

        5.3.3. Household Care

        5.3.4. Others

    5.4. Y-o-Y Growth Trend Analysis By Product Type, 2019 to 2023

    5.5. Absolute $ Opportunity Analysis By Product Type, 2024 to 2034

6. Global Market Analysis 2019 to 2023 and Forecast 2024 to 2034, By Mode of Transportation

    6.1. Introduction / Key Findings

    6.2. Historical Market Size Value (US$ Million) Analysis By Mode of Transportation, 2019 to 2023

    6.3. Current and Future Market Size Value (US$ Million) Analysis and Forecast By Mode of Transportation, 2024 to 2034

        6.3.1. Railways

        6.3.2. Airways

        6.3.3. Roadways

        6.3.4. Seaways

    6.4. Y-o-Y Growth Trend Analysis By Mode of Transportation, 2019 to 2023

    6.5. Absolute $ Opportunity Analysis By Mode of Transportation, 2024 to 2034

7. Global Market Analysis 2019 to 2023 and Forecast 2024 to 2034, By Region

    7.1. Introduction

    7.2. Historical Market Size Value (US$ Million) Analysis By Region, 2019 to 2023

    7.3. Current Market Size Value (US$ Million) Analysis and Forecast By Region, 2024 to 2034

        7.3.1. North America

        7.3.2. Latin America

        7.3.3. Western Europe

        7.3.4. Eastern Europe

        7.3.5. South Asia and Pacific

        7.3.6. East Asia

        7.3.7. Middle East and Africa

    7.4. Market Attractiveness Analysis By Region

8. North America Market Analysis 2019 to 2023 and Forecast 2024 to 2034, By Country

    8.1. Historical Market Size Value (US$ Million) Trend Analysis By Market Taxonomy, 2019 to 2023

    8.2. Market Size Value (US$ Million) Forecast By Market Taxonomy, 2024 to 2034

        8.2.1. By Country

            8.2.1.1. USA

            8.2.1.2. Canada

        8.2.2. By Product Type

        8.2.3. By Mode of Transportation

    8.3. Market Attractiveness Analysis

        8.3.1. By Country

        8.3.2. By Product Type

        8.3.3. By Mode of Transportation

    8.4. Key Takeaways

9. Latin America Market Analysis 2019 to 2023 and Forecast 2024 to 2034, By Country

    9.1. Historical Market Size Value (US$ Million) Trend Analysis By Market Taxonomy, 2019 to 2023

    9.2. Market Size Value (US$ Million) Forecast By Market Taxonomy, 2024 to 2034

        9.2.1. By Country

            9.2.1.1. Brazil

            9.2.1.2. Mexico

            9.2.1.3. Rest of Latin America

        9.2.2. By Product Type

        9.2.3. By Mode of Transportation

    9.3. Market Attractiveness Analysis

        9.3.1. By Country

        9.3.2. By Product Type

        9.3.3. By Mode of Transportation

    9.4. Key Takeaways

10. Western Europe Market Analysis 2019 to 2023 and Forecast 2024 to 2034, By Country

    10.1. Historical Market Size Value (US$ Million) Trend Analysis By Market Taxonomy, 2019 to 2023

    10.2. Market Size Value (US$ Million) Forecast By Market Taxonomy, 2024 to 2034

        10.2.1. By Country

            10.2.1.1. Germany

            10.2.1.2. UK

            10.2.1.3. France

            10.2.1.4. Spain

            10.2.1.5. Italy

            10.2.1.6. Rest of Western Europe

        10.2.2. By Product Type

        10.2.3. By Mode of Transportation

    10.3. Market Attractiveness Analysis

        10.3.1. By Country

        10.3.2. By Product Type

        10.3.3. By Mode of Transportation

    10.4. Key Takeaways

11. Eastern Europe Market Analysis 2019 to 2023 and Forecast 2024 to 2034, By Country

    11.1. Historical Market Size Value (US$ Million) Trend Analysis By Market Taxonomy, 2019 to 2023

    11.2. Market Size Value (US$ Million) Forecast By Market Taxonomy, 2024 to 2034

        11.2.1. By Country

            11.2.1.1. Poland

            11.2.1.2. Russia

            11.2.1.3. Czech Republic

            11.2.1.4. Romania

            11.2.1.5. Rest of Eastern Europe

        11.2.2. By Product Type

        11.2.3. By Mode of Transportation

    11.3. Market Attractiveness Analysis

        11.3.1. By Country

        11.3.2. By Product Type

        11.3.3. By Mode of Transportation

    11.4. Key Takeaways

12. South Asia and Pacific Market Analysis 2019 to 2023 and Forecast 2024 to 2034, By Country

    12.1. Historical Market Size Value (US$ Million) Trend Analysis By Market Taxonomy, 2019 to 2023

    12.2. Market Size Value (US$ Million) Forecast By Market Taxonomy, 2024 to 2034

        12.2.1. By Country

            12.2.1.1. India

            12.2.1.2. Bangladesh

            12.2.1.3. Australia

            12.2.1.4. New Zealand

            12.2.1.5. Rest of South Asia and Pacific

        12.2.2. By Product Type

        12.2.3. By Mode of Transportation

    12.3. Market Attractiveness Analysis

        12.3.1. By Country

        12.3.2. By Product Type

        12.3.3. By Mode of Transportation

    12.4. Key Takeaways

13. East Asia Market Analysis 2019 to 2023 and Forecast 2024 to 2034, By Country

    13.1. Historical Market Size Value (US$ Million) Trend Analysis By Market Taxonomy, 2019 to 2023

    13.2. Market Size Value (US$ Million) Forecast By Market Taxonomy, 2024 to 2034

        13.2.1. By Country

            13.2.1.1. China

            13.2.1.2. Japan

            13.2.1.3. South Korea

        13.2.2. By Product Type

        13.2.3. By Mode of Transportation

    13.3. Market Attractiveness Analysis

        13.3.1. By Country

        13.3.2. By Product Type

        13.3.3. By Mode of Transportation

    13.4. Key Takeaways

14. Middle East and Africa Market Analysis 2019 to 2023 and Forecast 2024 to 2034, By Country

    14.1. Historical Market Size Value (US$ Million) Trend Analysis By Market Taxonomy, 2019 to 2023

    14.2. Market Size Value (US$ Million) Forecast By Market Taxonomy, 2024 to 2034

        14.2.1. By Country

            14.2.1.1. GCC Countries

            14.2.1.2. South Africa

            14.2.1.3. Israel

            14.2.1.4. Rest of MEA

        14.2.2. By Product Type

        14.2.3. By Mode of Transportation

    14.3. Market Attractiveness Analysis

        14.3.1. By Country

        14.3.2. By Product Type

        14.3.3. By Mode of Transportation

    14.4. Key Takeaways

15. Key Countries Market Analysis

    15.1. USA

        15.1.1. Market Share Analysis, 2023

            15.1.1.1. By Product Type

            15.1.1.2. By Mode of Transportation

    15.2. Canada

        15.2.1. Market Share Analysis, 2023

            15.2.1.1. By Product Type

            15.2.1.2. By Mode of Transportation

    15.3. Brazil

        15.3.1. Market Share Analysis, 2023

            15.3.1.1. By Product Type

            15.3.1.2. By Mode of Transportation

    15.4. Mexico

        15.4.1. Market Share Analysis, 2023

            15.4.1.1. By Product Type

            15.4.1.2. By Mode of Transportation

    15.5. Germany

        15.5.1. Market Share Analysis, 2023

            15.5.1.1. By Product Type

            15.5.1.2. By Mode of Transportation

    15.6. UK

        15.6.1. Market Share Analysis, 2023

            15.6.1.1. By Product Type

            15.6.1.2. By Mode of Transportation

    15.7. France

        15.7.1. Market Share Analysis, 2023

            15.7.1.1. By Product Type

            15.7.1.2. By Mode of Transportation

    15.8. Spain

        15.8.1. Market Share Analysis, 2023

            15.8.1.1. By Product Type

            15.8.1.2. By Mode of Transportation

    15.9. Italy

        15.9.1. Market Share Analysis, 2023

            15.9.1.1. By Product Type

            15.9.1.2. By Mode of Transportation

    15.10. Poland

        15.10.1. Market Share Analysis, 2023

            15.10.1.1. By Product Type

            15.10.1.2. By Mode of Transportation

    15.11. Russia

        15.11.1. Market Share Analysis, 2023

            15.11.1.1. By Product Type

            15.11.1.2. By Mode of Transportation

    15.12. Czech Republic

        15.12.1. Market Share Analysis, 2023

            15.12.1.1. By Product Type

            15.12.1.2. By Mode of Transportation

    15.13. Romania

        15.13.1. Market Share Analysis, 2023

            15.13.1.1. By Product Type

            15.13.1.2. By Mode of Transportation

    15.14. India

        15.14.1. Market Share Analysis, 2023

            15.14.1.1. By Product Type

            15.14.1.2. By Mode of Transportation

    15.15. Bangladesh

        15.15.1. Market Share Analysis, 2023

            15.15.1.1. By Product Type

            15.15.1.2. By Mode of Transportation

    15.16. Australia

        15.16.1. Market Share Analysis, 2023

            15.16.1.1. By Product Type

            15.16.1.2. By Mode of Transportation

    15.17. New Zealand

        15.17.1. Market Share Analysis, 2023

            15.17.1.1. By Product Type

            15.17.1.2. By Mode of Transportation

    15.18. China

        15.18.1. Market Share Analysis, 2023

            15.18.1.1. By Product Type

            15.18.1.2. By Mode of Transportation

    15.19. Japan

        15.19.1. Market Share Analysis, 2023

            15.19.1.1. By Product Type

            15.19.1.2. By Mode of Transportation

    15.20. South Korea

        15.20.1. Market Share Analysis, 2023

            15.20.1.1. By Product Type

            15.20.1.2. By Mode of Transportation

    15.21. GCC Countries

        15.21.1. Market Share Analysis, 2023

            15.21.1.1. By Product Type

            15.21.1.2. By Mode of Transportation

    15.22. South Africa

        15.22.1. Market Share Analysis, 2023

            15.22.1.1. By Product Type

            15.22.1.2. By Mode of Transportation

    15.23. Israel

        15.23.1. Market Share Analysis, 2023

            15.23.1.1. By Product Type

            15.23.1.2. By Mode of Transportation

16. Market Structure Analysis

    16.1. Competition Dashboard

    16.2. Competition Benchmarking

    16.3. Market Share Analysis of Top Players

        16.3.1. By Regional

        16.3.2. By Product Type

        16.3.3. By Mode of Transportation

17. Competition Analysis

    17.1. Competition Deep Dive

        17.1.1. C.H. Robinson Worldwide Inc.

            17.1.1.1. Overview

            17.1.1.2. Product Portfolio

            17.1.1.3. Profitability by Market Segments

            17.1.1.4. Sales Footprint

            17.1.1.5. Strategy Overview

                17.1.1.5.1. Marketing Strategy

        17.1.2. United Parcel Service, Inc. (UPS)

            17.1.2.1. Overview

            17.1.2.2. Product Portfolio

            17.1.2.3. Profitability by Market Segments

            17.1.2.4. Sales Footprint

            17.1.2.5. Strategy Overview

                17.1.2.5.1. Marketing Strategy

        17.1.3. FedEx Corp

            17.1.3.1. Overview

            17.1.3.2. Product Portfolio

            17.1.3.3. Profitability by Market Segments

            17.1.3.4. Sales Footprint

            17.1.3.5. Strategy Overview

                17.1.3.5.1. Marketing Strategy

        17.1.4. Deutsche Post AG

            17.1.4.1. Overview

            17.1.4.2. Product Portfolio

            17.1.4.3. Profitability by Market Segments

            17.1.4.4. Sales Footprint

            17.1.4.5. Strategy Overview

                17.1.4.5.1. Marketing Strategy

        17.1.5. Kuehne+Nagel International AG

            17.1.5.1. Overview

            17.1.5.2. Product Portfolio

            17.1.5.3. Profitability by Market Segments

            17.1.5.4. Sales Footprint

            17.1.5.5. Strategy Overview

                17.1.5.5.1. Marketing Strategy

        17.1.6. A.P. Moller - Maersk

            17.1.6.1. Overview

            17.1.6.2. Product Portfolio

            17.1.6.3. Profitability by Market Segments

            17.1.6.4. Sales Footprint

            17.1.6.5. Strategy Overview

                17.1.6.5.1. Marketing Strategy

        17.1.7. Schenker AG

            17.1.7.1. Overview

            17.1.7.2. Product Portfolio

            17.1.7.3. Profitability by Market Segments

            17.1.7.4. Sales Footprint

            17.1.7.5. Strategy Overview

                17.1.7.5.1. Marketing Strategy

        17.1.8. DSV Solutions

            17.1.8.1. Overview

            17.1.8.2. Product Portfolio

            17.1.8.3. Profitability by Market Segments

            17.1.8.4. Sales Footprint

            17.1.8.5. Strategy Overview

                17.1.8.5.1. Marketing Strategy

        17.1.9. Nippon Express Holdings, Inc.

            17.1.9.1. Overview

            17.1.9.2. Product Portfolio

            17.1.9.3. Profitability by Market Segments

            17.1.9.4. Sales Footprint

            17.1.9.5. Strategy Overview

                17.1.9.5.1. Marketing Strategy

        17.1.10. Landstar System Holdings, Inc.

            17.1.10.1. Overview

            17.1.10.2. Product Portfolio

            17.1.10.3. Profitability by Market Segments

            17.1.10.4. Sales Footprint

            17.1.10.5. Strategy Overview

                17.1.10.5.1. Marketing Strategy

18. Assumptions & Acronyms Used

19. Research Methodology

List of Tables

Table 1: Global Market Value (US$ Million) Forecast by Region, 2019 to 2034

Table 2: Global Market Value (US$ Million) Forecast by Product Type, 2019 to 2034

Table 3: Global Market Value (US$ Million) Forecast by Mode of Transportation, 2019 to 2034

Table 4: North America Market Value (US$ Million) Forecast by Country, 2019 to 2034

Table 5: North America Market Value (US$ Million) Forecast by Product Type, 2019 to 2034

Table 6: North America Market Value (US$ Million) Forecast by Mode of Transportation, 2019 to 2034

Table 7: Latin America Market Value (US$ Million) Forecast by Country, 2019 to 2034

Table 8: Latin America Market Value (US$ Million) Forecast by Product Type, 2019 to 2034

Table 9: Latin America Market Value (US$ Million) Forecast by Mode of Transportation, 2019 to 2034

Table 10: Western Europe Market Value (US$ Million) Forecast by Country, 2019 to 2034

Table 11: Western Europe Market Value (US$ Million) Forecast by Product Type, 2019 to 2034

Table 12: Western Europe Market Value (US$ Million) Forecast by Mode of Transportation, 2019 to 2034

Table 13: Eastern Europe Market Value (US$ Million) Forecast by Country, 2019 to 2034

Table 14: Eastern Europe Market Value (US$ Million) Forecast by Product Type, 2019 to 2034

Table 15: Eastern Europe Market Value (US$ Million) Forecast by Mode of Transportation, 2019 to 2034

Table 16: South Asia and Pacific Market Value (US$ Million) Forecast by Country, 2019 to 2034

Table 17: South Asia and Pacific Market Value (US$ Million) Forecast by Product Type, 2019 to 2034

Table 18: South Asia and Pacific Market Value (US$ Million) Forecast by Mode of Transportation, 2019 to 2034

Table 19: East Asia Market Value (US$ Million) Forecast by Country, 2019 to 2034

Table 20: East Asia Market Value (US$ Million) Forecast by Product Type, 2019 to 2034

Table 21: East Asia Market Value (US$ Million) Forecast by Mode of Transportation, 2019 to 2034

Table 22: Middle East and Africa Market Value (US$ Million) Forecast by Country, 2019 to 2034

Table 23: Middle East and Africa Market Value (US$ Million) Forecast by Product Type, 2019 to 2034

Table 24: Middle East and Africa Market Value (US$ Million) Forecast by Mode of Transportation, 2019 to 2034

List of Charts

Figure 1: Global Market Value (US$ Million) by Product Type, 2024 to 2034

Figure 2: Global Market Value (US$ Million) by Mode of Transportation, 2024 to 2034

Figure 3: Global Market Value (US$ Million) by Region, 2024 to 2034

Figure 4: Global Market Value (US$ Million) Analysis by Region, 2019 to 2034

Figure 5: Global Market Value Share (%) and BPS Analysis by Region, 2024 to 2034

Figure 6: Global Market Y-o-Y Growth (%) Projections by Region, 2024 to 2034

Figure 7: Global Market Value (US$ Million) Analysis by Product Type, 2019 to 2034

Figure 8: Global Market Value Share (%) and BPS Analysis by Product Type, 2024 to 2034

Figure 9: Global Market Y-o-Y Growth (%) Projections by Product Type, 2024 to 2034

Figure 10: Global Market Value (US$ Million) Analysis by Mode of Transportation, 2019 to 2034

Figure 11: Global Market Value Share (%) and BPS Analysis by Mode of Transportation, 2024 to 2034

Figure 12: Global Market Y-o-Y Growth (%) Projections by Mode of Transportation, 2024 to 2034

Figure 13: Global Market Attractiveness by Product Type, 2024 to 2034

Figure 14: Global Market Attractiveness by Mode of Transportation, 2024 to 2034

Figure 15: Global Market Attractiveness by Region, 2024 to 2034

Figure 16: North America Market Value (US$ Million) by Product Type, 2024 to 2034

Figure 17: North America Market Value (US$ Million) by Mode of Transportation, 2024 to 2034

Figure 18: North America Market Value (US$ Million) by Country, 2024 to 2034

Figure 19: North America Market Value (US$ Million) Analysis by Country, 2019 to 2034

Figure 20: North America Market Value Share (%) and BPS Analysis by Country, 2024 to 2034

Figure 21: North America Market Y-o-Y Growth (%) Projections by Country, 2024 to 2034

Figure 22: North America Market Value (US$ Million) Analysis by Product Type, 2019 to 2034

Figure 23: North America Market Value Share (%) and BPS Analysis by Product Type, 2024 to 2034

Figure 24: North America Market Y-o-Y Growth (%) Projections by Product Type, 2024 to 2034

Figure 25: North America Market Value (US$ Million) Analysis by Mode of Transportation, 2019 to 2034

Figure 26: North America Market Value Share (%) and BPS Analysis by Mode of Transportation, 2024 to 2034

Figure 27: North America Market Y-o-Y Growth (%) Projections by Mode of Transportation, 2024 to 2034

Figure 28: North America Market Attractiveness by Product Type, 2024 to 2034

Figure 29: North America Market Attractiveness by Mode of Transportation, 2024 to 2034

Figure 30: North America Market Attractiveness by Country, 2024 to 2034

Figure 31: Latin America Market Value (US$ Million) by Product Type, 2024 to 2034

Figure 32: Latin America Market Value (US$ Million) by Mode of Transportation, 2024 to 2034

Figure 33: Latin America Market Value (US$ Million) by Country, 2024 to 2034

Figure 34: Latin America Market Value (US$ Million) Analysis by Country, 2019 to 2034

Figure 35: Latin America Market Value Share (%) and BPS Analysis by Country, 2024 to 2034

Figure 36: Latin America Market Y-o-Y Growth (%) Projections by Country, 2024 to 2034

Figure 37: Latin America Market Value (US$ Million) Analysis by Product Type, 2019 to 2034

Figure 38: Latin America Market Value Share (%) and BPS Analysis by Product Type, 2024 to 2034

Figure 39: Latin America Market Y-o-Y Growth (%) Projections by Product Type, 2024 to 2034

Figure 40: Latin America Market Value (US$ Million) Analysis by Mode of Transportation, 2019 to 2034

Figure 41: Latin America Market Value Share (%) and BPS Analysis by Mode of Transportation, 2024 to 2034

Figure 42: Latin America Market Y-o-Y Growth (%) Projections by Mode of Transportation, 2024 to 2034

Figure 43: Latin America Market Attractiveness by Product Type, 2024 to 2034

Figure 44: Latin America Market Attractiveness by Mode of Transportation, 2024 to 2034

Figure 45: Latin America Market Attractiveness by Country, 2024 to 2034

Figure 46: Western Europe Market Value (US$ Million) by Product Type, 2024 to 2034

Figure 47: Western Europe Market Value (US$ Million) by Mode of Transportation, 2024 to 2034

Figure 48: Western Europe Market Value (US$ Million) by Country, 2024 to 2034

Figure 49: Western Europe Market Value (US$ Million) Analysis by Country, 2019 to 2034

Figure 50: Western Europe Market Value Share (%) and BPS Analysis by Country, 2024 to 2034

Figure 51: Western Europe Market Y-o-Y Growth (%) Projections by Country, 2024 to 2034

Figure 52: Western Europe Market Value (US$ Million) Analysis by Product Type, 2019 to 2034

Figure 53: Western Europe Market Value Share (%) and BPS Analysis by Product Type, 2024 to 2034

Figure 54: Western Europe Market Y-o-Y Growth (%) Projections by Product Type, 2024 to 2034

Figure 55: Western Europe Market Value (US$ Million) Analysis by Mode of Transportation, 2019 to 2034

Figure 56: Western Europe Market Value Share (%) and BPS Analysis by Mode of Transportation, 2024 to 2034

Figure 57: Western Europe Market Y-o-Y Growth (%) Projections by Mode of Transportation, 2024 to 2034

Figure 58: Western Europe Market Attractiveness by Product Type, 2024 to 2034

Figure 59: Western Europe Market Attractiveness by Mode of Transportation, 2024 to 2034

Figure 60: Western Europe Market Attractiveness by Country, 2024 to 2034

Figure 61: Eastern Europe Market Value (US$ Million) by Product Type, 2024 to 2034

Figure 62: Eastern Europe Market Value (US$ Million) by Mode of Transportation, 2024 to 2034

Figure 63: Eastern Europe Market Value (US$ Million) by Country, 2024 to 2034

Figure 64: Eastern Europe Market Value (US$ Million) Analysis by Country, 2019 to 2034

Figure 65: Eastern Europe Market Value Share (%) and BPS Analysis by Country, 2024 to 2034

Figure 66: Eastern Europe Market Y-o-Y Growth (%) Projections by Country, 2024 to 2034

Figure 67: Eastern Europe Market Value (US$ Million) Analysis by Product Type, 2019 to 2034

Figure 68: Eastern Europe Market Value Share (%) and BPS Analysis by Product Type, 2024 to 2034

Figure 69: Eastern Europe Market Y-o-Y Growth (%) Projections by Product Type, 2024 to 2034

Figure 70: Eastern Europe Market Value (US$ Million) Analysis by Mode of Transportation, 2019 to 2034

Figure 71: Eastern Europe Market Value Share (%) and BPS Analysis by Mode of Transportation, 2024 to 2034

Figure 72: Eastern Europe Market Y-o-Y Growth (%) Projections by Mode of Transportation, 2024 to 2034

Figure 73: Eastern Europe Market Attractiveness by Product Type, 2024 to 2034

Figure 74: Eastern Europe Market Attractiveness by Mode of Transportation, 2024 to 2034

Figure 75: Eastern Europe Market Attractiveness by Country, 2024 to 2034

Figure 76: South Asia and Pacific Market Value (US$ Million) by Product Type, 2024 to 2034

Figure 77: South Asia and Pacific Market Value (US$ Million) by Mode of Transportation, 2024 to 2034

Figure 78: South Asia and Pacific Market Value (US$ Million) by Country, 2024 to 2034

Figure 79: South Asia and Pacific Market Value (US$ Million) Analysis by Country, 2019 to 2034

Figure 80: South Asia and Pacific Market Value Share (%) and BPS Analysis by Country, 2024 to 2034

Figure 81: South Asia and Pacific Market Y-o-Y Growth (%) Projections by Country, 2024 to 2034

Figure 82: South Asia and Pacific Market Value (US$ Million) Analysis by Product Type, 2019 to 2034

Figure 83: South Asia and Pacific Market Value Share (%) and BPS Analysis by Product Type, 2024 to 2034

Figure 84: South Asia and Pacific Market Y-o-Y Growth (%) Projections by Product Type, 2024 to 2034

Figure 85: South Asia and Pacific Market Value (US$ Million) Analysis by Mode of Transportation, 2019 to 2034

Figure 86: South Asia and Pacific Market Value Share (%) and BPS Analysis by Mode of Transportation, 2024 to 2034

Figure 87: South Asia and Pacific Market Y-o-Y Growth (%) Projections by Mode of Transportation, 2024 to 2034

Figure 88: South Asia and Pacific Market Attractiveness by Product Type, 2024 to 2034

Figure 89: South Asia and Pacific Market Attractiveness by Mode of Transportation, 2024 to 2034

Figure 90: South Asia and Pacific Market Attractiveness by Country, 2024 to 2034

Figure 91: East Asia Market Value (US$ Million) by Product Type, 2024 to 2034

Figure 92: East Asia Market Value (US$ Million) by Mode of Transportation, 2024 to 2034

Figure 93: East Asia Market Value (US$ Million) by Country, 2024 to 2034

Figure 94: East Asia Market Value (US$ Million) Analysis by Country, 2019 to 2034

Figure 95: East Asia Market Value Share (%) and BPS Analysis by Country, 2024 to 2034

Figure 96: East Asia Market Y-o-Y Growth (%) Projections by Country, 2024 to 2034

Figure 97: East Asia Market Value (US$ Million) Analysis by Product Type, 2019 to 2034

Figure 98: East Asia Market Value Share (%) and BPS Analysis by Product Type, 2024 to 2034

Figure 99: East Asia Market Y-o-Y Growth (%) Projections by Product Type, 2024 to 2034

Figure 100: East Asia Market Value (US$ Million) Analysis by Mode of Transportation, 2019 to 2034

Figure 101: East Asia Market Value Share (%) and BPS Analysis by Mode of Transportation, 2024 to 2034

Figure 102: East Asia Market Y-o-Y Growth (%) Projections by Mode of Transportation, 2024 to 2034

Figure 103: East Asia Market Attractiveness by Product Type, 2024 to 2034

Figure 104: East Asia Market Attractiveness by Mode of Transportation, 2024 to 2034

Figure 105: East Asia Market Attractiveness by Country, 2024 to 2034

Figure 106: Middle East and Africa Market Value (US$ Million) by Product Type, 2024 to 2034

Figure 107: Middle East and Africa Market Value (US$ Million) by Mode of Transportation, 2024 to 2034

Figure 108: Middle East and Africa Market Value (US$ Million) by Country, 2024 to 2034

Figure 109: Middle East and Africa Market Value (US$ Million) Analysis by Country, 2019 to 2034

Figure 110: Middle East and Africa Market Value Share (%) and BPS Analysis by Country, 2024 to 2034

Figure 111: Middle East and Africa Market Y-o-Y Growth (%) Projections by Country, 2024 to 2034

Figure 112: Middle East and Africa Market Value (US$ Million) Analysis by Product Type, 2019 to 2034

Figure 113: Middle East and Africa Market Value Share (%) and BPS Analysis by Product Type, 2024 to 2034

Figure 114: Middle East and Africa Market Y-o-Y Growth (%) Projections by Product Type, 2024 to 2034

Figure 115: Middle East and Africa Market Value (US$ Million) Analysis by Mode of Transportation, 2019 to 2034

Figure 116: Middle East and Africa Market Value Share (%) and BPS Analysis by Mode of Transportation, 2024 to 2034

Figure 117: Middle East and Africa Market Y-o-Y Growth (%) Projections by Mode of Transportation, 2024 to 2034

Figure 118: Middle East and Africa Market Attractiveness by Product Type, 2024 to 2034

Figure 119: Middle East and Africa Market Attractiveness by Mode of Transportation, 2024 to 2034

Figure 120: Middle East and Africa Market Attractiveness by Country, 2024 to 2034

Recommendations

Packaging

FMCG Packaging Market

Published : May 2023

Services and Utilities

eCommerce Logistics Market

Published : April 2023

Technology

Logistics Robots Market

Published : February 2023

Explore Services and Utilities Insights

View Reports