FMCG Packaging Market Outlook (2023 to 2033)

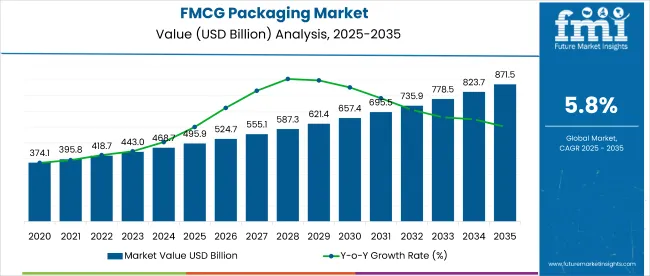
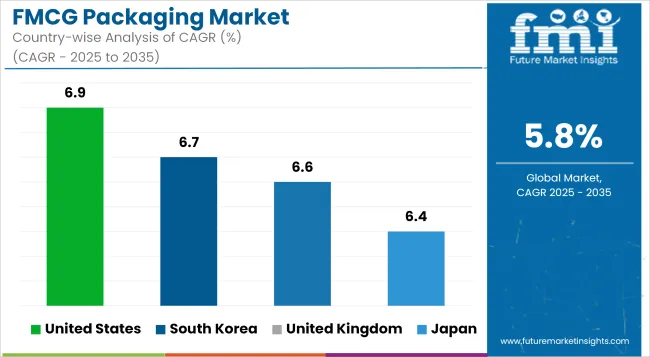
The FMCG packaging market is expected to expand its roots at an average CAGR of 5.8% during the forecast period. The market is likely to hold a revenue of US$ 443.1 billion in 2023 while it is anticipated to cross a value of US$ 778.7 billion by 2033.

Attributes Details
FMCG Packaging Market CAGR (2023 to 2033) 5.8%
FMCG Packaging Market Size (2023) US$ 443.1 billion
FMCG Packaging Market Size (2033) US$ 778.7 billion

Don't pay for what you don't need

Customize your report by selecting specific countries or regions and save 30%!

2018 to 2022 FMCG Packaging Market Historic Outlook Vs Forecast for 2023 to 2033

Demand in the global FMCG packaging market is projected to grow at a 5.8% CAGR over the forecast period, in comparison with the 4.0% CAGR registered between 2018 to 2022.

The ubiquity of convenience and discount retailers and increasing production in the food and beverage sector are key factors driving the expansion of the market. Sales of dairy products such as milk, cheese, and yogurt have surged in the USA in recent years.

According to the USDA ERS, between 1975 and 2018, per capita cheese consumption increased from 14.3 pounds to 40 pounds. This has had a significant impact on the demand for various packaging formats.

In the FMCG industry, packaging accounts for a significant portion of the material costs associated with manufacturing a final product. As a result, manufacturers are inventing novel packaging methods to reduce operational costs.

Also, with the growing demand for nutritional foods, FMCG packaging players are reinventing their packaging to protect the nutritional content of perishable items.

How Increasing Adoption of Intelligent Packaging Is Boosting Sales?

Intelligent packaging offers a value-added experience to consumers. Technology-enabled packaging enables consumers to gain complete information about the product. Intelligent packaging is a smart way of identifying the quality and shelf life of consumable products.

Touchless codes such as barcode, QR codes, temperature and moisture indicators, and many others retrieve data in less time, which ultimately speed up buying decisions.

On the other hand, active packaging such as Modified Atmospheric Packaging (MAP) and Vacuum Atmospheric Packaging (VAP) ensure longer shelf life of the consumable products. As smart packaging offers opportunities to establish a brand presence to marketers, numerous end users such as food & beverages and pharmaceuticals are switching to smart packaging from traditional packaging formats.

As per FMI, intelligent packaging is preferred by 98 out of 100, which in turn is a big turning point in the packaging industry.

Ismail Sutaria
Ismail Sutaria

Principal Consultant

Talk to Analyst

Find your sweet spots for generating winning opportunities in this market.

Will The Expansion of the E-Commerce Sector Propel Sales of FMCG Packaging?

The expansion of the e-commerce sector has been fueled by shifting preference from conventional brick-and-mortar stores to online channel retailers. The increasing penetration of mobile devices has also led to more consumers preferring online retail.

In addition to this, home delivery services for food is becoming more popular because of rising urbanization and changing lifestyle. Growing demand for ready-to-eat or frozen foods is likely to fuel the market.

Online retail channels offer a plethora of products, ranging from food, and electronics, to personal care items under one roof. These products require different packaging formats for safety during transit. This is expected to continue pushing sales in the FMCG market over the assessment period.

Country-wise Insights

Country-wise Revenue Share:

Country United States
Revenue Share % (2022) 18.9%
Country Germany
Revenue Share % (2022) 5.6%
Country Japan
Revenue Share % (2022) 7.1%
Country Australia
Revenue Share % (2022) 1.9%
Country North America
Revenue Share % (2022) 28.5%
Country Europe
Revenue Share % (2022) 24.3%

Country-wise CAGR:

Country China
CAGR % (2023 to 2033) 6.0%
Country India
CAGR % (2023 to 2033) 7.4%
Country United Kingdom
CAGR % (2023 to 2033) 2.4%

Why is the USA FMCG Packaging Market Considered Lucrative?

Food and Beverage Manufacturers in the United States Prefer Flexible FMCG Packaging

The rapid expansion of the beverage sector in the United States is expected to drive sales in the market over the forecast period. Packaging and labeling companies that are working in collaboration with the beverage sector are emphasizing packaging innovation, and improving the words, fonts, and images to attract consumers. The nation leads the market as it held a market share of 18.9% in 2022. The North American region on the other side held a market share of 28.5% in 2022.

As per FMI, sales in the United States FMCG packaging market are projected to increase at a 5% CAGR over the forecast period.

In addition to this, the growing demand for sustainable and recyclable packaging formats is compelling manufacturers to launch innovative products. For instance, in January 2020, Ball Corporation introduced infinitely recyclable aluminum bottles that may be recycled into other metal products.

A re-closable threaded cap is included on the bottles, allowing customers to twist the top on and off. Companies in the FMCG sector are reconsidering their packaging choices. P&G, for example, wants to make all of its fabric care packaging in the USA recyclable by 2023.

How Is the India FMCG Packaging Market Faring?

FMCG Packaging Companies are Investing in Sustainable Packaging Formats

Increasing production and consumption in the pharmaceutical and food and beverage industries are driving sales in the Indian market. Growing investments in the food processing, personal care, and pharmaceuticals sectors are enabling the expansion of the FMCG packaging market in India. India is expected to thrive at a leading CAGR of 7.4% in the Asia Pacific region.

To maximize the packaging sector's potential in India, the government has been contacting industry experts. The Packaging Industry Association of India (PIAI), for example, drafts norms and guidelines to regulate packaging operations in the country.

Packaging consumption in India has surged by 200 percent in the last decade, from 4.3 kilograms per person per annum (pppa) to 8.6 kg pppa, according to the Indian Institute of Packaging (IIP).

Driven by these factors, demand in the Indian market is projected to grow at a robust 7.3% CAGR over the forecast period.

Get the data you need at a Fraction of the cost

Personalize your report by choosing insights you need
and save 40%!

Category-Wise Landscape

Category By Product Type
Leading Segment Rigid Packaging
Market Share (2023) 63.9%
Category By End Use
Leading Segment Food & Beverages
Market Share (2023) 56.2%

Why are Applications in the Food & Beverages Segment Rising?

Demand for Rigid Packaging in the Food and beverage Sector Will Remain High

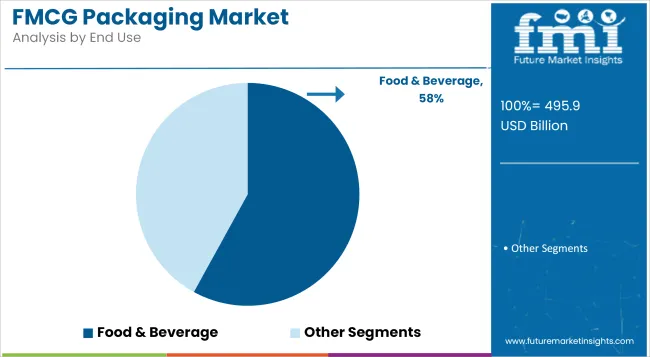
In terms of end use, sales in the food & beverage sector are projected to increase at a 6.1% CAGR over the forecast period. Beverage companies are investing in innovative packaging formats to improve sales. The segment held a major share of 63.9% in 2022.

For instance, AVE United Kingdom introduced its new range of bottling equipment in August 2019 in Monobloc (filler/capper) and Unibloc (rinser/filler/capper) models, that can handle a multitude of components in a single machine. The movable bottling equipment is intended to reduce costs related to plastic packaging.

Why is the Demand for Rigid Packaging High?

Sales of Rigid Packaging Will Gain Traction on The Back of the High Demand for Sustainable Solutions

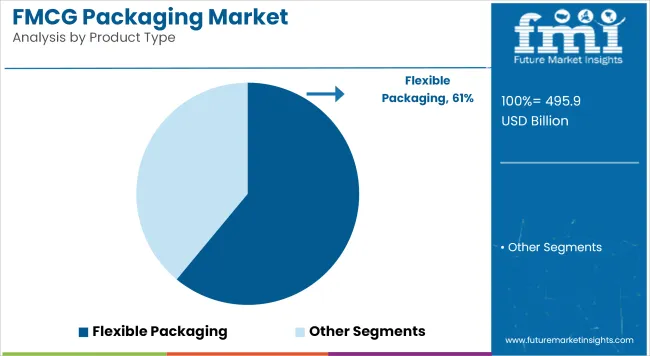
Rigid packaging, such as glass containers, plastic boxes, cans, and cardboard is utilized to package food, cosmetics, and personal care products. It is slightly more expensive and heavier than flexible packaging, but it provides better protection against heat and other environmental influences, such as moisture.

The emergence of novel rigid packaging solutions and innovative product development is creating growth prospects for market players. In response to growing single-use plastic waste, manufacturers are launching sustainable and eco-friendly rigid packaging solutions.

These include packaging products made of glass, wood, and metal. During the forecast period, sales in this segment are forecast to increase at a 5.5% CAGR.

Will Plastic Emerge as the Most Preferred FMCG Packaging Material?

FMCG Packaging Companies are Using Plastics to Manufacturer Innovative Packaging

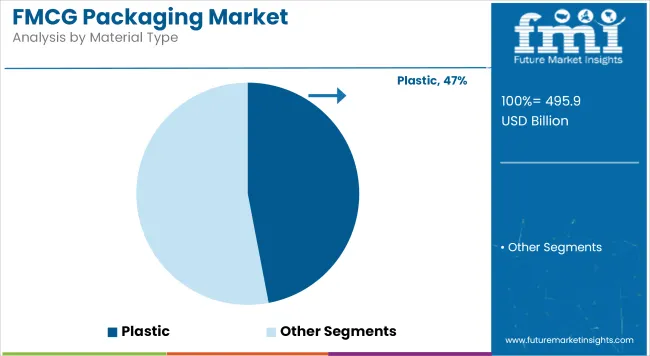
Based on the material, the plastic segment is forecast to expand at a considerable pace through 2032. PET and HDPE are the most often used materials in the manufacturing of bottles and jars. PVC is utilized in the fabrication of bottles, jars, and vials in some applications. However, as environmental concerns grow, producers are attempting to transition to PET and HDPE.

To enhance sustainability in the packaging sector, companies like Bizongo are developing biodegradable spill-proof lunch trays.

Competition Scenario

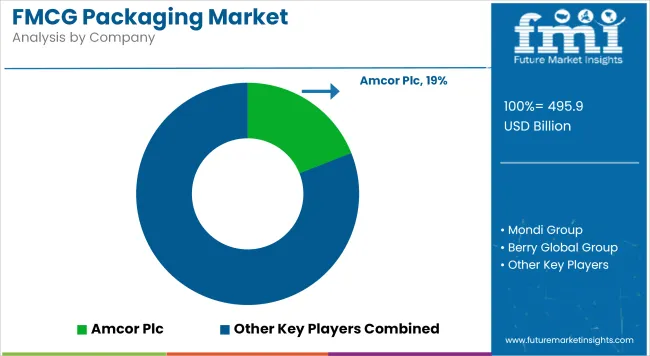
Leading players operating in the global FMCG packaging market are tailoring their services to more precise market niches by customizing products for various end users. In addition to this, players are investing in research and development to improve their product portfolios. For instance:

Market Developments

  • In January 2022, PFF Group introduced the fully recyclable food packaging product IMPACT-T which requires less plastic than PET packaging and enables increased use of post-consumer recycled (PCR) material, optimizing the resources used.
  • In January 2020, Amcor announced a partnership with Moda vacuum packaging solutions in North America and Latin America. Producers can obtain operational improvements and create total cost savings by integrating Amcor's shrink bag and roll stock film for meat and cheese with Moda'sModa's system.
  • Sealed Air Corporation has now renamed their company as See. This is likely to be the first step towards the reinvention of the company. The brand looks to build a market-driven, customer-first platform
  • WestRock Company has been named to Dow Jones Sustainability Index for the third consecutive year. The brand works on advancing social equity through forestry and works on transforming consumer behavior towards packaging.

Key Players

  • Berry Global Inc.
  • Crown Holdings
  • WestRock Company
  • Sealed Air Corporation
  • Sonoco Products Company
  • Ball Corporation
  • Kimberly-Clark Corporation
  • Mondi Plc
  • Huhtamaki Oyj
  • Ardagh Group S.A.

Key Segments Covered

By Product Type:

  • Flexible Packaging
    • Pouches & Sachets
    • Stick Packs
    • Bags & Sacks
    • Foils & Films

Rigid Packaging:

  • Boxes & Cartons
  • Trays
  • Tubes
  • Containers & Jars
  • Bottles
  • Cans
  • Blisters

By Material Type:

  • Plastic
  • Paper and Paperboard
  • Metal
  • Glass
  • Others (Wood, Foam, etc.)

By End Use:

  • Food & Beverage
  • Pharmaceuticals
  • Personal Care & Cosmetics
  • Homecare Products
  • Electronics
  • Others (Office Supplies, Textiles, etc.)

Key Regions Covered:

  • North America
    • UNITED STATES
    • Canada
  • Latin America
    • Brazil
    • Mexico
    • Rest of Latin America
  • Europe
    • Germany
    • U.K.
    • France
    • Spain
    • Russia
    • Rest of Europe
  • Japan
  • Asia Pacific Excluding Japan
    • China
    • India
    • Malaysia
    • Singapore
    • Australia
    • Rest of Asia Pacific Excluding Japan (APEJ)
  • Middle East and Africa
    • GCC Countries
    • Israel
    • South Africa
    • Middle East and Africa (MEA)

Frequently Asked Questions

How Big is the FMCG Packaging Market in 2023?

The market is valued at US$ 443.1 billion in 2023.

Who are the Leading Market Players?

Berry Global Inc., Crown Holdings, and WestRock Company are the leading market players.

What will be the Market Size in 2033?

The market is estimated to reach US$ 778.7 billion by 2033.

What Drives the Market Growth?

Increasing adoption of intelligent packaging drives the market prospects.

What was the Market Share of the United States in 2022?

The United States generated a share of 18.9% in 2022.

Table of Content
1. Executive Summary
    1.1. Global Market Outlook
    1.2. Demand-side Trends
    1.3. Supply-side Trends
    1.4. Technology Roadmap Analysis
    1.5. Analysis and Recommendations
2. Market Overview
    2.1. Market Coverage / Taxonomy
    2.2. Market Definition / Scope / Limitations
3. Market Background
    3.1. Market Dynamics
        3.1.1. Drivers
        3.1.2. Restraints
        3.1.3. Opportunity
        3.1.4. Trends
    3.2. Scenario Forecast
        3.2.1. Demand in Optimistic Scenario
        3.2.2. Demand in Likely Scenario
        3.2.3. Demand in Conservative Scenario
    3.3. Opportunity Map Analysis
    3.4. Product Life Cycle Analysis
    3.5. Supply Chain Analysis
        3.5.1. Supply Side Participants and their Roles
            3.5.1.1. Producers
            3.5.1.2. Mid-Level Participants (Traders/ Agents/ Brokers)
            3.5.1.3. Wholesalers and Distributors
        3.5.2. Value Added and Value Created at Node in the Supply Chain
        3.5.3. List of Raw Material Suppliers
        3.5.4. List of Existing and Potential Buyer’s
    3.6. Investment Feasibility Matrix
    3.7. Value Chain Analysis
        3.7.1. Profit Margin Analysis
        3.7.2. Wholesalers and Distributors
        3.7.3. Retailers
    3.8. PESTLE and Porter’s Analysis
    3.9. Regulatory Landscape
        3.9.1. By Key Regions
        3.9.2. By Key Countries
    3.10. Regional Parent Market Outlook
    3.11. Production and Consumption Statistics
    3.12. Import and Export Statistics
4. Global Market Analysis 2018 to 2022 and Forecast, 2023 to 2033
    4.1. Historical Market Size Value (US$ Million) & Volume (Units) Analysis, 2018 to 2022
    4.2. Current and Future Market Size Value (US$ Million) & Volume (Units) Projections, 2023 to 2033
        4.2.1. Y-o-Y Growth Trend Analysis
        4.2.2. Absolute $ Opportunity Analysis
5. Global Market Analysis 2018 to 2022 and Forecast 2023 to 2033, By Product Type
    5.1. Introduction / Key Findings
    5.2. Historical Market Size Value (US$ Million) & Volume (Units) Analysis By Product Type, 2018 to 2022
    5.3. Current and Future Market Size Value (US$ Million) & Volume (Units) Analysis and Forecast By Product Type, 2023 to 2033
        5.3.1. Flexible Packaging
            5.3.1.1. Pouches & Sachets
            5.3.1.2. Stick Packs
            5.3.1.3. Bags & Sacks
            5.3.1.4. Foils & Films
        5.3.2. Rigid Packaging
            5.3.2.1. Boxes & Cartons
            5.3.2.2. Trays
            5.3.2.3. Tubes
            5.3.2.4. Containers & Jars
            5.3.2.5. Bottles
            5.3.2.6. Cans
            5.3.2.7. Blisters
    5.4. Y-o-Y Growth Trend Analysis By Product Type, 2018 to 2022
    5.5. Absolute $ Opportunity Analysis By Product Type, 2023 to 2033
6. Global Market Analysis 2018 to 2022 and Forecast 2023 to 2033, By Material Type
    6.1. Introduction / Key Findings
    6.2. Historical Market Size Value (US$ Million) & Volume (Units) Analysis By Material Type, 2018 to 2022
    6.3. Current and Future Market Size Value (US$ Million) & Volume (Units) Analysis and Forecast By Material Type, 2023 to 2033
        6.3.1. Plastic
        6.3.2. Paper and Paperboard
        6.3.3. Metal
        6.3.4. Glass
        6.3.5. Others 
    6.4. Y-o-Y Growth Trend Analysis By Material Type, 2018 to 2022
    6.5. Absolute $ Opportunity Analysis By Material Type, 2023 to 2033
7. Global Market Analysis 2018 to 2022 and Forecast 2023 to 2033, By End Use
    7.1. Introduction / Key Findings
    7.2. Historical Market Size Value (US$ Million) & Volume (Units) Analysis By End Use, 2018 to 2022
    7.3. Current and Future Market Size Value (US$ Million) & Volume (Units) Analysis and Forecast By End Use, 2023 to 2033
        7.3.1. Food & Beverage
        7.3.2. Pharmaceuticals
        7.3.3. Personal Care & Cosmetics
        7.3.4. Homecare Products
        7.3.5. Electronics
        7.3.6. Others
    7.4. Y-o-Y Growth Trend Analysis By End Use, 2018 to 2022
    7.5. Absolute $ Opportunity Analysis By End Use, 2023 to 2033
8. Global Market Analysis 2018 to 2022 and Forecast 2023 to 2033, By Region
    8.1. Introduction
    8.2. Historical Market Size Value (US$ Million) & Volume (Units) Analysis By Region, 2018 to 2022
    8.3. Current Market Size Value (US$ Million) & Volume (Units) Analysis and Forecast By Region, 2023 to 2033
        8.3.1. North America
        8.3.2. Latin America
        8.3.3. Europe
        8.3.4. Asia Pacific
        8.3.5. MEA
    8.4. Market Attractiveness Analysis By Region
9. North America Market Analysis 2018 to 2022 and Forecast 2023 to 2033, By Country
    9.1. Historical Market Size Value (US$ Million) & Volume (Units) Trend Analysis By Market Taxonomy, 2018 to 2022
    9.2. Market Size Value (US$ Million) & Volume (Units) Forecast By Market Taxonomy, 2023 to 2033
        9.2.1. By Country
            9.2.1.1. U.S.
            9.2.1.2. Canada
        9.2.2. By Product Type
        9.2.3. By Material Type
        9.2.4. By End Use
    9.3. Market Attractiveness Analysis
        9.3.1. By Country
        9.3.2. By Product Type
        9.3.3. By Material Type
        9.3.4. By End Use
    9.4. Key Takeaways
10. Latin America Market Analysis 2018 to 2022 and Forecast 2023 to 2033, By Country
    10.1. Historical Market Size Value (US$ Million) & Volume (Units) Trend Analysis By Market Taxonomy, 2018 to 2022
    10.2. Market Size Value (US$ Million) & Volume (Units) Forecast By Market Taxonomy, 2023 to 2033
        10.2.1. By Country
            10.2.1.1. Brazil
            10.2.1.2. Mexico
            10.2.1.3. Rest of Latin America
        10.2.2. By Product Type
        10.2.3. By Material Type
        10.2.4. By End Use
    10.3. Market Attractiveness Analysis
        10.3.1. By Country
        10.3.2. By Product Type
        10.3.3. By Material Type
        10.3.4. By End Use
    10.4. Key Takeaways
11. Europe Market Analysis 2018 to 2022 and Forecast 2023 to 2033, By Country
    11.1. Historical Market Size Value (US$ Million) & Volume (Units) Trend Analysis By Market Taxonomy, 2018 to 2022
    11.2. Market Size Value (US$ Million) & Volume (Units) Forecast By Market Taxonomy, 2023 to 2033
        11.2.1. By Country
            11.2.1.1. Germany
            11.2.1.2. U.K.
            11.2.1.3. France
            11.2.1.4. Spain
            11.2.1.5. Italy
            11.2.1.6. Rest of Europe
        11.2.2. By Product Type
        11.2.3. By Material Type
        11.2.4. By End Use
    11.3. Market Attractiveness Analysis
        11.3.1. By Country
        11.3.2. By Product Type
        11.3.3. By Material Type
        11.3.4. By End Use
    11.4. Key Takeaways
12. Asia Pacific Market Analysis 2018 to 2022 and Forecast 2023 to 2033, By Country
    12.1. Historical Market Size Value (US$ Million) & Volume (Units) Trend Analysis By Market Taxonomy, 2018 to 2022
    12.2. Market Size Value (US$ Million) & Volume (Units) Forecast By Market Taxonomy, 2023 to 2033
        12.2.1. By Country
            12.2.1.1. China
            12.2.1.2. Japan
            12.2.1.3. South Korea
            12.2.1.4. Singapore
            12.2.1.5. Thailand
            12.2.1.6. Indonesia
            12.2.1.7. Australia
            12.2.1.8. New Zealand
            12.2.1.9. Rest of Asia Pacific
        12.2.2. By Product Type
        12.2.3. By Material Type
        12.2.4. By End Use
    12.3. Market Attractiveness Analysis
        12.3.1. By Country
        12.3.2. By Product Type
        12.3.3. By Material Type
        12.3.4. By End Use
    12.4. Key Takeaways
13. MEA Market Analysis 2018 to 2022 and Forecast 2023 to 2033, By Country
    13.1. Historical Market Size Value (US$ Million) & Volume (Units) Trend Analysis By Market Taxonomy, 2018 to 2022
    13.2. Market Size Value (US$ Million) & Volume (Units) Forecast By Market Taxonomy, 2023 to 2033
        13.2.1. By Country
            13.2.1.1. GCC Countries
            13.2.1.2. South Africa
            13.2.1.3. Israel
            13.2.1.4. Rest of MEA
        13.2.2. By Product Type
        13.2.3. By Material Type
        13.2.4. By End Use
    13.3. Market Attractiveness Analysis
        13.3.1. By Country
        13.3.2. By Product Type
        13.3.3. By Material Type
        13.3.4. By End Use
    13.4. Key Takeaways
14. Key Countries Market Analysis
    14.1. U.S.
        14.1.1. Pricing Analysis
        14.1.2. Market Share Analysis, 2022
            14.1.2.1. By Product Type
            14.1.2.2. By Material Type
            14.1.2.3. By End Use
    14.2. Canada
        14.2.1. Pricing Analysis
        14.2.2. Market Share Analysis, 2022
            14.2.2.1. By Product Type
            14.2.2.2. By Material Type
            14.2.2.3. By End Use
    14.3. Brazil
        14.3.1. Pricing Analysis
        14.3.2. Market Share Analysis, 2022
            14.3.2.1. By Product Type
            14.3.2.2. By Material Type
            14.3.2.3. By End Use
    14.4. Mexico
        14.4.1. Pricing Analysis
        14.4.2. Market Share Analysis, 2022
            14.4.2.1. By Product Type
            14.4.2.2. By Material Type
            14.4.2.3. By End Use
    14.5. Germany
        14.5.1. Pricing Analysis
        14.5.2. Market Share Analysis, 2022
            14.5.2.1. By Product Type
            14.5.2.2. By Material Type
            14.5.2.3. By End Use
    14.6. U.K.
        14.6.1. Pricing Analysis
        14.6.2. Market Share Analysis, 2022
            14.6.2.1. By Product Type
            14.6.2.2. By Material Type
            14.6.2.3. By End Use
    14.7. France
        14.7.1. Pricing Analysis
        14.7.2. Market Share Analysis, 2022
            14.7.2.1. By Product Type
            14.7.2.2. By Material Type
            14.7.2.3. By End Use
    14.8. Spain
        14.8.1. Pricing Analysis
        14.8.2. Market Share Analysis, 2022
            14.8.2.1. By Product Type
            14.8.2.2. By Material Type
            14.8.2.3. By End Use
    14.9. Italy
        14.9.1. Pricing Analysis
        14.9.2. Market Share Analysis, 2022
            14.9.2.1. By Product Type
            14.9.2.2. By Material Type
            14.9.2.3. By End Use
    14.10. China
        14.10.1. Pricing Analysis
        14.10.2. Market Share Analysis, 2022
            14.10.2.1. By Product Type
            14.10.2.2. By Material Type
            14.10.2.3. By End Use
    14.11. Japan
        14.11.1. Pricing Analysis
        14.11.2. Market Share Analysis, 2022
            14.11.2.1. By Product Type
            14.11.2.2. By Material Type
            14.11.2.3. By End Use
    14.12. South Korea
        14.12.1. Pricing Analysis
        14.12.2. Market Share Analysis, 2022
            14.12.2.1. By Product Type
            14.12.2.2. By Material Type
            14.12.2.3. By End Use
    14.13. Singapore
        14.13.1. Pricing Analysis
        14.13.2. Market Share Analysis, 2022
            14.13.2.1. By Product Type
            14.13.2.2. By Material Type
            14.13.2.3. By End Use
    14.14. Thailand
        14.14.1. Pricing Analysis
        14.14.2. Market Share Analysis, 2022
            14.14.2.1. By Product Type
            14.14.2.2. By Material Type
            14.14.2.3. By End Use
    14.15. Indonesia
        14.15.1. Pricing Analysis
        14.15.2. Market Share Analysis, 2022
            14.15.2.1. By Product Type
            14.15.2.2. By Material Type
            14.15.2.3. By End Use
    14.16. Australia
        14.16.1. Pricing Analysis
        14.16.2. Market Share Analysis, 2022
            14.16.2.1. By Product Type
            14.16.2.2. By Material Type
            14.16.2.3. By End Use
    14.17. New Zealand
        14.17.1. Pricing Analysis
        14.17.2. Market Share Analysis, 2022
            14.17.2.1. By Product Type
            14.17.2.2. By Material Type
            14.17.2.3. By End Use
    14.18. GCC Countries
        14.18.1. Pricing Analysis
        14.18.2. Market Share Analysis, 2022
            14.18.2.1. By Product Type
            14.18.2.2. By Material Type
            14.18.2.3. By End Use
    14.19. South Africa
        14.19.1. Pricing Analysis
        14.19.2. Market Share Analysis, 2022
            14.19.2.1. By Product Type
            14.19.2.2. By Material Type
            14.19.2.3. By End Use
    14.20. Israel
        14.20.1. Pricing Analysis
        14.20.2. Market Share Analysis, 2022
            14.20.2.1. By Product Type
            14.20.2.2. By Material Type
            14.20.2.3. By End Use
15. Market Structure Analysis
    15.1. Competition Dashboard
    15.2. Competition Benchmarking
    15.3. Market Share Analysis of Top Players
        15.3.1. By Regional
        15.3.2. By Product Type
        15.3.3. By Material Type
        15.3.4. By End Use
16. Competition Analysis
    16.1. Competition Deep Dive
        16.1.1. Berry Global Inc.
            16.1.1.1. Overview
            16.1.1.2. Product Portfolio
            16.1.1.3. Profitability by Market Segments
            16.1.1.4. Sales Footprint
            16.1.1.5. Strategy Overview
                16.1.1.5.1. Marketing Strategy
                16.1.1.5.2. Product Strategy
                16.1.1.5.3. Channel Strategy
        16.1.2. Crown Holdings
            16.1.2.1. Overview
            16.1.2.2. Product Portfolio
            16.1.2.3. Profitability by Market Segments
            16.1.2.4. Sales Footprint
            16.1.2.5. Strategy Overview
                16.1.2.5.1. Marketing Strategy
                16.1.2.5.2. Product Strategy
                16.1.2.5.3. Channel Strategy
        16.1.3. WestRock Company
            16.1.3.1. Overview
            16.1.3.2. Product Portfolio
            16.1.3.3. Profitability by Market Segments
            16.1.3.4. Sales Footprint
            16.1.3.5. Strategy Overview
                16.1.3.5.1. Marketing Strategy
                16.1.3.5.2. Product Strategy
                16.1.3.5.3. Channel Strategy
        16.1.4. Sealed Air Corporation
            16.1.4.1. Overview
            16.1.4.2. Product Portfolio
            16.1.4.3. Profitability by Market Segments
            16.1.4.4. Sales Footprint
            16.1.4.5. Strategy Overview
                16.1.4.5.1. Marketing Strategy
                16.1.4.5.2. Product Strategy
                16.1.4.5.3. Channel Strategy
        16.1.5. Sonoco Products Company
            16.1.5.1. Overview
            16.1.5.2. Product Portfolio
            16.1.5.3. Profitability by Market Segments
            16.1.5.4. Sales Footprint
            16.1.5.5. Strategy Overview
                16.1.5.5.1. Marketing Strategy
                16.1.5.5.2. Product Strategy
                16.1.5.5.3. Channel Strategy
        16.1.6. Ball Corporation
            16.1.6.1. Overview
            16.1.6.2. Product Portfolio
            16.1.6.3. Profitability by Market Segments
            16.1.6.4. Sales Footprint
            16.1.6.5. Strategy Overview
                16.1.6.5.1. Marketing Strategy
                16.1.6.5.2. Product Strategy
                16.1.6.5.3. Channel Strategy
        16.1.7. Kimberly-Clark Corporation
            16.1.7.1. Overview
            16.1.7.2. Product Portfolio
            16.1.7.3. Profitability by Market Segments
            16.1.7.4. Sales Footprint
            16.1.7.5. Strategy Overview
                16.1.7.5.1. Marketing Strategy
                16.1.7.5.2. Product Strategy
                16.1.7.5.3. Channel Strategy
        16.1.8. Mondi Plc
            16.1.8.1. Overview
            16.1.8.2. Product Portfolio
            16.1.8.3. Profitability by Market Segments
            16.1.8.4. Sales Footprint
            16.1.8.5. Strategy Overview
                16.1.8.5.1. Marketing Strategy
                16.1.8.5.2. Product Strategy
                16.1.8.5.3. Channel Strategy
        16.1.9. Huhtamaki Oyj
            16.1.9.1. Overview
            16.1.9.2. Product Portfolio
            16.1.9.3. Profitability by Market Segments
            16.1.9.4. Sales Footprint
            16.1.9.5. Strategy Overview
                16.1.9.5.1. Marketing Strategy
                16.1.9.5.2. Product Strategy
                16.1.9.5.3. Channel Strategy
        16.1.10. Ardagh Group S.A.
            16.1.10.1. Overview
            16.1.10.2. Product Portfolio
            16.1.10.3. Profitability by Market Segments
            16.1.10.4. Sales Footprint
            16.1.10.5. Strategy Overview
                16.1.10.5.1. Marketing Strategy
                16.1.10.5.2. Product Strategy
                16.1.10.5.3. Channel Strategy
17. Assumptions & Acronyms Used
18. Research Methodology
Recommendations

Packaging

Rigid Industrial Packaging Market

April 2023

REP-GB-10086

333 pages

Packaging

Intelligent Packaging Market

February 2023

REP-GB-13604

240 pages

Explore Packaging Insights

View Reports
Future Market Insights

FMCG Packaging Market

Schedule a Call