Furniture Market Size, Share, and Forecast Outlook 2025 to 2035

The global furniture market is expected to reach USD 684.5 billion by 2035 from its 2025 base of USD 540 billion with a forecasted CAGR of 2.4% from 2025 to 2035. The industry benefits from strong consumer sentiment in residential renovation, growing demand for multifunctional pieces, and evolving design preferences across indoor and outdoor categories.
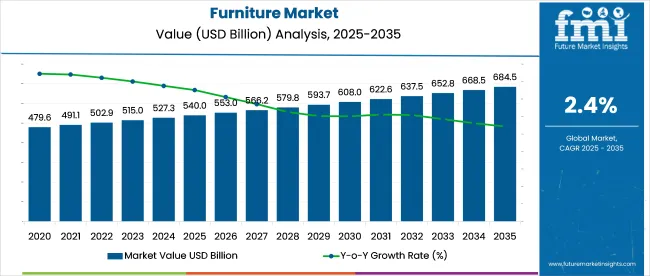
Quick Stats for Furniture Market

  • Market Size (2025): USD 540 Billion
  • Forecast Size (2035): USD 684.5 Billion
  • CAGR (2025 to 2035): 2.4%
  • Leading Segment (2025): Indoor Furniture - 69%
  • Key Growth Region: Asia Pacific
  • Major Players: IKEA, Ashley Furniture, La-Z-Boy, Steelcase, Godrej Interio

Furniture Market

Attribute Detail
Market Size (2025) USD 540 Billion
Market Size (2035) USD 684.5 Billion
CAGR (2025 to 2035) 2.4%

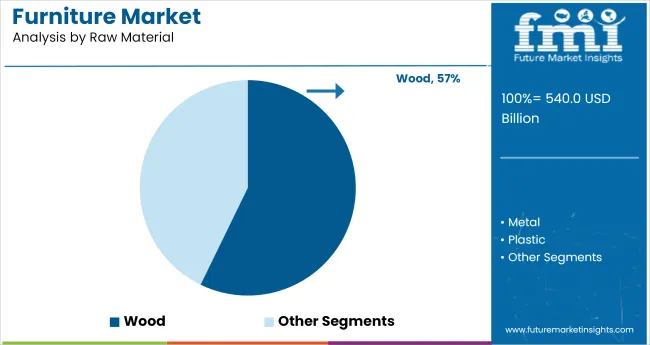
In 2025, wood emerges as the leading raw material, accounting for 57% of global sales due to its durability, traditional appeal, and aesthetic versatility across both residential and hospitality applications. Other raw materials such as metal and engineered plastics continue to gain relevance, especially in modular and lightweight designs for commercial settings.

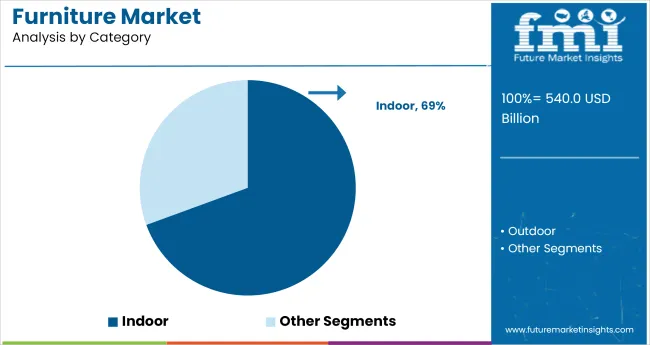
In terms of usage category, indoor furniture contributes 69% of the global revenue in 2025. Products like beds, sofas, tables, and wardrobes dominate, especially in urban households where frequent renovations and functional preferences shape buying behavior. Outdoor furniture continues to expand gradually, driven by increased patio furnishing, garden setups, and balcony usage in temperate zones and resort-based hospitality.

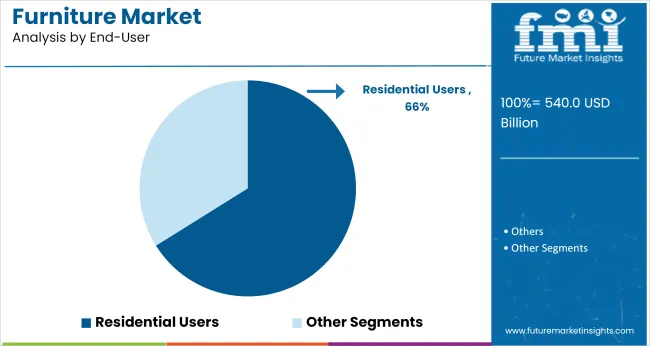
Residential end-users command a 66% share in 2025, making it the primary driver of revenue across both developed and emerging markets. Rising disposable incomes, enhanced access to e-commerce platforms, and increasing residential construction-especially in Asia Pacific and the Gulf region-are propelling this demand.

As per IKEA’s 2025 Sustainability Report, 97% of its wood is now FSC-certified or recycled, with VOC emissions reduced by 8% and logistics emissions down 12% YoY. IKEA is also transitioning to bio-based adhesives and aims for an 80% reduction in logistics emissionsby 2030. These efforts reflect a growing industry emphasis on low-emission materials, quality assurance, and efficient sourcing, particularly in North America and Europe.

The furniture market captures 42% of the interior design and decoration market and 38% within home and living, driven by sustained demand for functional and aesthetic furnishings across residential and mixed-use developments. In the hospitality and commercial infrastructure sector, a 34% share reflects bulk procurement across hotels, offices, and institutional facilities.

A 29% contribution to the wood and wood-based products market highlights high material dependency, particularly for hardwood and engineered panels. Within the broader consumer goods market, furniture comprises just 11%, indicating lower frequency of purchase. Its 8% share in construction materials and 5% in real estate links to post-occupancy capital spend.

Analysis of Furniture Market by Top Investment Segments

The furniture market is segmented by raw material into wood, metal, plastic, and others, with wood leading due to high consumer preference for durability and design versatility. Category-wise, indoor furniture dominates, driven by demand for living room, bedroom, and modular office setups. Among end users, the residential sector holds the largest share, accounting for over 60% of total demand globally.
Wood Remains the Dominant Material in Furniture Production

Furniture Market Analysis By Raw Material

Wood is projected to command 57% of the global furniture market by 2025, but it faces competition from plastic and metal in cost-sensitive and commercial use-cases. Hardwood (e.g., oak, walnut) continues to dominate premium ranges for durability and aesthetics, while engineered wood (MDF, particleboard) supports budget and modular solutions.

In contrast, metal is gaining traction in institutional and outdoor furniture for its strength and low maintenance, particularly in healthcare and educational spaces. Plastic furniture, while declining in high-end indoor use, is still preferred in low-income and semi-outdoor environments due to price and portability. Sustainability drives a growing shift to FSC-certified wood, especially in the EU and North America.
  • FSC-certified wood uses up 21% YoY in Europe.
  • Metal holds over 30% share in commercial furniture lines.
  • Plastic demand persists in rural markets and outdoor use.

Indoor Furniture Dominates Category-Wise Market Demand

Furniture Market Analysis By Category

Indoor furniture leads with 69% of market share in 2025, supported by demand for bedroom sets, living room units, and home-office setups. Rising urban density boosts demand for modular, multifunctional furniture in small apartments. Meanwhile, outdoor furniture is a fast-growing but still niche segment, especially in luxury real estate, hospitality, and premium homes.

Climate-resilient finishes and water-resistant woods are expanding its use cases. Still, indoor products generate higher repeat purchases and customization demand. The contrast lies in volume versus value - indoor furniture drives mass volume; outdoor focuses on premium, seasonal, and hospitality-led orders.
  • Indoor furniture benefits from e-commerce-led personalization.
  • Outdoor furniture sees 9% CAGR in luxury hospitality sector.
  • Post-pandemic WFH trends sustain ergonomic indoor product demand.

Residential Segment Leads Furniture End Use Globally

Furniture Market Analysis By End User

Residential applications account for 66% of total market value in 2025. This includes homeowners and renters purchasing furniture for living, bedroom, and study purposes. Urban millennials favor minimalist, smart furniture that blends aesthetics and storage. In contrast, commercial and institutional buyers prioritize durability and functionality over design.

Hotels, offices, and schools increasingly demand standardized, stackable, and easy-to-clean furniture, often made from metal or composite materials. The residential segment leads innovation, while the commercial segment favors cost-efficiency and regulatory compliance (e.g., fire retardant certifications).

  • Smart furniture adoption higher among residential buyers in metros.
  • Hospitality sector spends more on outdoor and lobby furnishings.
  • Institutional users prefer standard-sized, ergonomic metal furniture.

Top Furniture Market Dynamics

Material-conscious buying, connected features, and layout flexibility are reshaping the furniture market. Buyers are prioritizing natural builds, functional add-ons, and customizable formats suited to evolving lifestyle and space needs.

Natural Material Preference Shaping Buying Behavior

Consumers are showing a strong preference for furniture made from natural and responsibly sourced materials. Brands are introducing items built with reclaimed wood, fast-growing timbers, and low-impact finishes. Buyers are asking for furniture free from harmful chemicals, encouraging the use of water-based coatings and solid wood frames. Furniture makers are also focusing on reusability and long-lasting designs. This shift is changing product development strategies, store assortments, and marketing messaging to meet new consumer standards.

  • Reclaimed and fast-growing woods are gaining popularity in furniture collections.
  • Water-based paints and low-emission coatings are preferred by health-conscious customers.
  • Long-use furniture is being marketed with emphasis on durability and reusability.

Connected Features Becoming Everyday Expectations

Furniture with built-in features is being requested by buyers who seek ease and comfort in their living spaces. Items like coffee tables with USB ports, beds with reading lights, and desks with charging docks are now standard in many product lines. Households are selecting products that serve more than one use, such as sofas that become beds or dining tables with hidden storage. This demand is influencing furniture designers to blend form with everyday functionality.
  • Beds and recliners now come with plug-and-play features like USB and lighting.
  • Convertible tables and compact shelving serve dual purposes in smaller rooms.
  • Comfort-driven buyers prefer items with everyday functionality over decorative extras.

Top Countries Designing, Building, and Scaling Furniture Market Growth

Country Wise Analysis Of Furniture Market

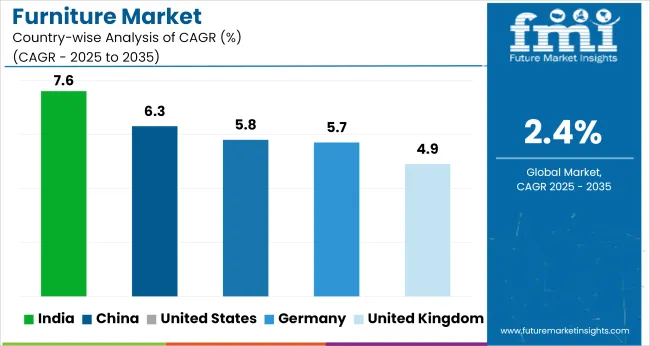
Countries Projected CAGR (2025 to 2035)
United States 5.8%
United Kingdom 4.9%
Germany 5.7%
China 6.3%
India 7.6%

While the global furniture market is projected to grow at a modest 2.39% CAGR from 2025 to 2035, BRICS and emerging economies are setting a distinctly faster pace. India leads all major markets with a 7.6% CAGR-over three times the global average-driven by rising residential construction, a booming online furniture segment, and formalization of unorganized carpentry networks. China follows at 6.3%, with strong export recovery, rising domestic customization demand, and regional hub expansion in Tier 3 cities.

The United States, an OECD member, is forecast at 5.8%, led by aging home replacements, modular designs, and growth in urban rental housing. Germany and the United Kingdom trail slightly, growing at 5.687% and 4.93% respectively, reflecting higher market maturity, slower household formation, and tighter sustainability regulations.

In contrast, India’s growth premium of +217% over the global average signals a long runway, especially as organized retail penetration remains under 25% compared to over 70% in the USA. The report covers a detailed analysis of 40+ countries, and the top five countries have been shared as a reference.

Expansion Outlook for the United States Furniture Sector

The furniture market in the United States is projected to expand at a CAGR of 5.8% from 2025 to 2035, supported by lifestyle shifts toward compact living and mobile-friendly interiors. Over 60% of renters now prefer modular options to accommodate space limitations and job mobility. Renovation-driven upgrades remain common among aging homeowners focused on comfort and safety.

Digital-first platforms contribute more than 30% of total sales, offering fast customization. Growth in suburban housing also boosts demand for adaptable furniture formats. The domestic supply base is scaling to serve regional preferences and faster fulfillment across key urban zones.

  • Urban furniture buyers favor reconfiguration flexibility over permanence.
  • Digital customization has replaced bulk stock as the key retail differentiator.
  • Seniors increasingly purchase assistive and height-adjustable furniture formats.

Growth Trends in the Furniture Market of the United Kingdom

Projected to grow at a CAGR of 4.93% between 2025 and 2035, the furniture industry in the United Kingdom is being reshaped by hybrid work culture and import substitutions. Nearly 28 % of buyers now opt for refurbished or upcycled furniture, aligning with practical reuse. Compact apartments in cities demand functional yet stylish solutions, while home offices drive growth in ergonomic product lines.

Local manufacturers now fulfill 45% of internal demand, aided by Brexit-induced import limitations. Modular and tool-free assembly furniture is gaining popularity among mobile renters and young professionals across London, Manchester, and Birmingham.

  • City dwellers increasingly choose flat-pack models for flexible arrangements.
  • Local sourcing has displaced import-heavy segments in entry-level categories.
  • Circular furniture models gain traction among eco-conscious millennials.

Growth Outlook for the Furniture Sector in China

The furniture sector in China is expected to grow at a CAGR of 6.3% from 2025 to 2035, driven by dual momentum in domestic and export markets. More than 40% of new launches cater to tier-3 and tier-4 cities where compact spaces and price sensitivity influence designs.

Export volume rebounded by 12% post-2024, particularly from the European Union. Localized production hubs in Shandong and Guangdong have improved fulfillment speeds and lowered logistics costs. Smart layouts, embedded storage, and dual-purpose components dominate catalogues, meeting the evolving expectations of space-conscious households and value-focused international clients.

  • Tier-based designs allow city-specific catalogues with efficient distribution.
  • Compliance with EU material norms has accelerated export recovery.
  • Logistics optimization is shortening inventory turnover cycles nationwide.

Expansion and Formalization of the Furniture Market in India

Recording a projected CAGR of 7.6% from 2025 to 2035, the furniture market in India is expanding due to rapid urbanization, rising income levels, and digital retail adoption. Organized brands are replacing fragmented carpentry services by offering cost-effective, ready-to-assemble products with modern aesthetics.

Less than 25% of the market is formal, offering immense headroom for growth. E-commerce platforms see over 20% annual increases in order volume, especially in tier-2 and tier-3 cities. Infrastructure schemes such as Smart Cities and PLI initiatives support localized production, allowing brands to deliver fast, affordable furniture tailored to small-space living.

  • Modular kits are preferred in nuclear households with limited space.
  • Mobile-first platforms dominate consumer touchpoints in regional markets.
  • Government-backed clusters boost low-cost manufacturing scalability.

Market Direction and Demand Drivers in the Furniture Industry of Germany

Expected to expand at a CAGR of 5.7% from 2025 to 2035, the furniture industry in Germany is guided by quality assurance, minimalism, and environmental compliance. Over 70 % of new designs meet formal certification standards, responding to buyer demand for safety and durability.

In cities such as Berlin and Hamburg, space constraints have driven growth in convertible and stackable furniture options. Circular production increased by 22% in 2024, with institutions driving large-scale procurement. Manufacturers continue to lead in the European mid-premium segment by integrating engineering precision with clean-line product aesthetics.
  • Universities and public housing contracts favor dual-purpose furniture models.
  • Minimalist formats outperform decorative items in metropolitan showrooms.
  • Circular economy policies support closed-loop material sourcing and reuse.

Leading Furniture Market Suppliers

Furniture Market Analysis By Company

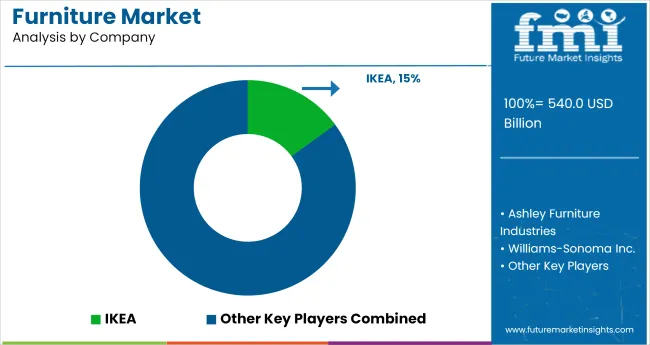
Leading Company - IKEA

Market Share - 15%

The global furniture market is dominated by leading players such as IKEA, Ashley Furniture Industries, and Williams-Sonoma Inc., known for their large-scale manufacturing, design innovation, and omnichannel retail presence. These dominant companies drive growth through affordable modular designs, sustainable sourcing, and global supply chains.

Key players including Steelcase Inc., Herman Miller Inc. (MillerKnoll), and HNI Corporation focus on ergonomic solutions, commercial furniture, and workspace innovation. Emerging players such as Godrej Interio, Häfele, La-Z-Boy Inc., and Okamura Corporation cater to regional markets with custom offerings, smart furniture solutions, and rising e-commerce integration. Growth is supported by urbanization, lifestyle upgrades, and demand for multifunctional designs.

Recent Industry News

  • IKEA adopts Matter smart home standard: IKEA will launch 20+ Matter-over-Thread devices starting January 2026, including new lights, sensors, and Bluetooth speakers, with full integration through an upgraded Dirigera hub, enhancing compatibility across all major smart home platforms.
  • IKEA opens first Upstate New York store: IKEA is set to open a 70,000 sqft store at Destiny USA mall in Syracuse by Fall 2025, featuring a full showroom, Swedish café, marketplace, and sustainable “As-Is” product department.

Key Players

  • IKEA
  • Ashley Furniture Industries
  • Williams-Sonoma Inc.
  • Steelcase Inc.
  • Herman Miller Inc. (MillerKnoll)
  • HNI Corporation
  • Godrej Interio
  • Häfele
  • La-Z-Boy Inc.
  • Okamura Corporation

Report Scope for Furniture Market

Report Attributes Details
Industry Size (2025) USD 540 Billion
Projected Industry Size (2035) USD 684.5 Billion
CAGR (2025 to 2035) 2.4%
Base Year for Estimation 2024
Historical Period 2020 to 2024
Forecast Period 2025 to 2035
Quantitative Units USD Billion for Value, Million Units for Volume
Raw Material Segments (Segment 1) Wood, Metal, Plastic, Others
Category Segments (Segment 2) Indoor, Outdoor
End-User Segments (Segment 3) Residential, Others (Commercial, Institutional, Hospitality)
Countries Covered United States, Canada, United Kingdom, Germany, France, Italy, China, India, Japan, Australia, Brazil, Mexico, South Korea, South Africa, Saudi Arabia, UAE
Key Players Influencing the Market IKEA, Ashley Furniture Industries, Williams-Sonoma Inc., Steelcase Inc., Herman Miller Inc. (MillerKnoll), HNI Corporation, Godrej Interio, Häfele, La-Z-Boy Inc., Okamura Corporation
Additional Attributes Includes dollar sales, segment share, growth in modular, e-commerce penetration, demand for sustainable raw materials, home-office trends, and expansion of organized furniture retail

Key Segments

By Raw Material:

This segment is categorized into wood, metal, plastic, and other materials.

By Category:

The segmentation includes indoor and outdoor categories.

By End-User:

This segment covers residential users and other end-use sectors such as commercial or institutional applications.

By Region:

The regional segmentation includes North America, Latin America, Europe, the Middle East and Africa, East Asia, South Asia, and Oceania.

Table of Content

  1. Executive Summary
    • Global Market Outlook
    • Demand-side Trends
    • Supply-side Trends
    • Technology Roadmap Analysis
    • Analysis and Recommendations
  2. Market Overview
    • Market Coverage/Taxonomy
    • Market Definition/Scope/Limitations
  3. Market Background
    • Market Dynamics
      • Drivers
      • Restraints
      • Opportunity
      • Trends
    • Scenario Forecast
      • Demand in Optimistic Scenario
      • Demand in Likely Scenario
      • Demand in Conservative Scenario
    • Opportunity Map Analysis
    • Product Life Cycle Analysis
    • Supply Chain Analysis
      • Supply Side Participants and their Roles
        • Producers
        • Mid-Level Participants (Traders/ Agents/ Brokers)
        • Wholesalers and Distributors
      • Value Added and Value Created at Node in the Supply Chain
      • List of Raw Material Suppliers
      • List of Existing and Potential Buyer’s
    • Investment Feasibility Matrix
    • Value Chain Analysis
      • Profit Margin Analysis
      • Wholesalers and Distributors
      • Retailers
    • PESTLE and Porter’s Analysis
    • Regulatory Landscape
      • By Key Regions
      • By Key Countries
    • Regional Parent Market Outlook
    • Production and Consumption Statistics
    • Import and Export Statistics
  4. Global Market Analysis 2020 to 2024 and Forecast, 2025 to 2035
    • Historical Market Size Value (USD Billion) & Volume (kilotons) Analysis, 2020 to 2024
    • Current and Future Market Size Value (USD Billion) & Volume (kilotons) Projections, 2025 to 2035
      • Y-o-Y Growth Trend Analysis
      • Absolute $ Opportunity Analysis
  5. Global Market Pricing Analysis 2020 to 2024 and Forecast 2025 to 2035
  6. Global Market Analysis 2020 to 2024 and Forecast 2025 to 2035, By Raw Material
    • Introduction/Key Findings
    • Historical Market Size Value (USD Billion) & Volume (kilotons) Analysis By Raw Material, 2020 to 2024
    • Current and Future Market Size Value (USD Billion) & Volume (kilotons) Analysis and Forecast By Raw Material, 2025 to 2035
      • wood
      • Metal
      • Plastic
      • Others
    • Y-o-Y Growth Trend Analysis By Raw Material, 2020 to 2024
    • Absolute $ Opportunity Analysis By Raw Material, 2025 to 2035
  7. Global Market Analysis 2020 to 2024 and Forecast 2025 to 2035, By Category
    • Introduction/Key Findings
    • Historical Market Size Value (USD Billion) & Volume (kilotons) Analysis By Category, 2020 to 2024
    • Current and Future Market Size Value (USD Billion) & Volume (kilotons) Analysis and Forecast By Category, 2025 to 2035
      • indoor
      • Outdoor
    • Y-o-Y Growth Trend Analysis By Category, 2020 to 2024
    • Absolute $ Opportunity Analysis By Category, 2025 to 2035
  8. Global Market Analysis 2020 to 2024 and Forecast 2025 to 2035, By End-User
    • Introduction/Key Findings
    • Historical Market Size Value (USD Billion) & Volume (kilotons) Analysis By End-User, 2020 to 2024
    • Current and Future Market Size Value (USD Billion) & Volume (kilotons) Analysis and Forecast By End-User, 2025 to 2035
      • Residential users
      • Others
        • Commercial
        • Institutional Applications
    • Y-o-Y Growth Trend Analysis By End-User, 2020 to 2024
    • Absolute $ Opportunity Analysis By End-User, 2025 to 2035
  9. Global Market Analysis 2020 to 2024 and Forecast 2025 to 2035, By Region
    • Introduction
    • Historical Market Size Value (USD Billion) & Volume (kilotons) Analysis By Region, 2020 to 2024
    • Current Market Size Value (USD Billion) & Volume (kilotons) Analysis and Forecast By Region, 2025 to 2035
      • North America
      • Latin America
      • Western Europe
      • Eastern Europe
      • East Asia
      • South Asia & Pacific
      • Middle East and Africa
    • Market Attractiveness Analysis By Region
  10. North America Market Analysis 2020 to 2024 and Forecast 2025 to 2035, By Country
    • Historical Market Size Value (USD Billion) & Volume (kilotons) Trend Analysis By Market Taxonomy, 2020 to 2024
    • Market Size Value (USD Billion) & Volume (kilotons) Forecast By Market Taxonomy, 2025 to 2035
      • By Country
        • USA
        • Canada
        • Mexico
      • By Raw Material
      • By Category
      • By End-User
    • Market Attractiveness Analysis
      • By Country
      • By Raw Material
      • By Category
      • By End-User
    • Key Takeaways
  11. Latin America Market Analysis 2020 to 2024 and Forecast 2025 to 2035, By Country
    • Historical Market Size Value (USD Billion) & Volume (kilotons) Trend Analysis By Market Taxonomy, 2020 to 2024
    • Market Size Value (USD Billion) & Volume (kilotons) Forecast By Market Taxonomy, 2025 to 2035
      • By Country
        • Brazil
        • Argentina
        • Rest of LATAM
      • By Raw Material
      • By Category
      • By End-User
    • Market Attractiveness Analysis
      • By Country
      • By Raw Material
      • By Category
      • By End-User
    • Key Takeaways
  12. Western Europe Market Analysis 2020 to 2024 and Forecast 2025 to 2035, By Country
    • Historical Market Size Value (USD Billion) & Volume (kilotons) Trend Analysis By Market Taxonomy, 2020 to 2024
    • Market Size Value (USD Billion) & Volume (kilotons) Forecast By Market Taxonomy, 2025 to 2035
      • By Country
        • Germany
        • Italy
        • France
        • UK
        • Spain
        • BENELUX
        • Nordic
        • Rest of W.Europe
      • By Raw Material
      • By Category
      • By End-User
    • Market Attractiveness Analysis
      • By Country
      • By Raw Material
      • By Category
      • By End-User
    • Key Takeaways
  13. Eastern Europe Market Analysis 2020 to 2024 and Forecast 2025 to 2035, By Country
    • Historical Market Size Value (USD Billion) & Volume (kilotons) Trend Analysis By Market Taxonomy, 2020 to 2024
    • Market Size Value (USD Billion) & Volume (kilotons) Forecast By Market Taxonomy, 2025 to 2035
      • By Country
        • Russia
        • Hungary
        • Poland
        • Balkan & Baltics
        • Rest of E. Europe
      • By Raw Material
      • By Category
      • By End-User
    • Market Attractiveness Analysis
      • By Country
      • By Raw Material
      • By Category
      • By End-User
    • Key Takeaways
  14. East Asia Market Analysis 2020 to 2024 and Forecast 2025 to 2035, By Country
    • Historical Market Size Value (USD Billion) & Volume (kilotons) Trend Analysis By Market Taxonomy, 2020 to 2024
    • Market Size Value (USD Billion) & Volume (kilotons) Forecast By Market Taxonomy, 2025 to 2035
      • By Country
        • China
        • Japan
        • South Korea
      • By Raw Material
      • By Category
      • By End-User
    • Market Attractiveness Analysis
      • By Country
      • By Raw Material
      • By Category
      • By End-User
    • Key Takeaways
  15. South Asia & Pacific Market Analysis 2020 to 2024 and Forecast 2025 to 2035, By Country
    • Historical Market Size Value (USD Billion) & Volume (kilotons) Trend Analysis By Market Taxonomy, 2020 to 2024
    • Market Size Value (USD Billion) & Volume (kilotons) Forecast By Market Taxonomy, 2025 to 2035
      • By Country
        • India
        • Australia & New Zealand
        • ASEAN
        • Rest of SAP
      • By Raw Material
      • By Category
      • By End-User
    • Market Attractiveness Analysis
      • By Country
      • By Raw Material
      • By Category
      • By End-User
    • Key Takeaways
  16. Middle East and Africa Market Analysis 2020 to 2024 and Forecast 2025 to 2035, By Country
    • Historical Market Size Value (USD Billion) & Volume (kilotons) Trend Analysis By Market Taxonomy, 2020 to 2024
    • Market Size Value (USD Billion) & Volume (kilotons) Forecast By Market Taxonomy, 2025 to 2035
      • By Country
        • GCC Countries
        • Northern Africa
        • South Africa
        • Turkiye
        • Rest of MEA
      • By Raw Material
      • By Category
      • By End-User
    • Market Attractiveness Analysis
      • By Country
      • By Raw Material
      • By Category
      • By End-User
    • Key Takeaways
  17. Key Countries Market Analysis
    • USA
      • Pricing Analysis
      • Market Share Analysis, 2024
        • By Raw Material
        • By Category
        • By End-User
    • Canada
      • Pricing Analysis
      • Market Share Analysis, 2024
        • By Raw Material
        • By Category
        • By End-User
    • Brazil
      • Pricing Analysis
      • Market Share Analysis, 2024
        • By Raw Material
        • By Category
        • By End-User
    • Mexico
      • Pricing Analysis
      • Market Share Analysis, 2024
        • By Raw Material
        • By Category
        • By End-User
    • Argentina
      • Pricing Analysis
      • Market Share Analysis, 2024
        • By Raw Material
        • By Category
        • By End-User
  18. Market Structure Analysis
    • Competition Dashboard
    • Competition Benchmarking
    • Market Share Analysis of Top Players
      • By Regional
      • By Raw Material
      • By Category
      • By End-User
  19. Competition Analysis
    • Competition Deep Dive
      • IKEA
        • Overview
        • Product Portfolio
        • Profitability by Market Segments (Product/Age /Sales Channel/Region)
        • Sales Footprint
        • Strategy Overview
          • Marketing Strategy
          • Product Strategy
          • Channel Strategy
      • Ashley Industries
        • Overview
        • Product Portfolio
        • Profitability by Market Segments (Product/Age /Sales Channel/Region)
        • Sales Footprint
        • Strategy Overview
          • Marketing Strategy
          • Product Strategy
          • Channel Strategy
      • Williams-Sonoma Inc.
        • Overview
        • Product Portfolio
        • Profitability by Market Segments (Product/Age /Sales Channel/Region)
        • Sales Footprint
        • Strategy Overview
          • Marketing Strategy
          • Product Strategy
          • Channel Strategy
      • Steelcase Inc.
        • Overview
        • Product Portfolio
        • Profitability by Market Segments (Product/Age /Sales Channel/Region)
        • Sales Footprint
        • Strategy Overview
          • Marketing Strategy
          • Product Strategy
          • Channel Strategy
      • Herman Miller Inc. (MillerKnoll)
        • Overview
        • Product Portfolio
        • Profitability by Market Segments (Product/Age /Sales Channel/Region)
        • Sales Footprint
        • Strategy Overview
          • Marketing Strategy
          • Product Strategy
          • Channel Strategy
      • HNI Corporation
        • Overview
        • Product Portfolio
        • Profitability by Market Segments (Product/Age /Sales Channel/Region)
        • Sales Footprint
        • Strategy Overview
          • Marketing Strategy
          • Product Strategy
          • Channel Strategy
      • Godrej Interio
        • Overview
        • Product Portfolio
        • Profitability by Market Segments (Product/Age /Sales Channel/Region)
        • Sales Footprint
        • Strategy Overview
          • Marketing Strategy
          • Product Strategy
          • Channel Strategy
      • Häfele
        • Overview
        • Product Portfolio
        • Profitability by Market Segments (Product/Age /Sales Channel/Region)
        • Sales Footprint
        • Strategy Overview
          • Marketing Strategy
          • Product Strategy
          • Channel Strategy
      • La-Z-Boy Inc.
        • Overview
        • Product Portfolio
        • Profitability by Market Segments (Product/Age /Sales Channel/Region)
        • Sales Footprint
        • Strategy Overview
          • Marketing Strategy
          • Product Strategy
          • Channel Strategy
      • Okamura Corporation
        • Overview
        • Product Portfolio
        • Profitability by Market Segments (Product/Age /Sales Channel/Region)
        • Sales Footprint
        • Strategy Overview
          • Marketing Strategy
          • Product Strategy
          • Channel Strategy
  20. Assumptions & Acronyms Used
  21. Research Methodology

List of Tables

  • Table 1: Global Market Value (USD Billion) Forecast by Region, 2020-2035
  • Table 2: Global Market Volume (kilotons) Forecast by Region, 2020-2035
  • Table 3: Global Market Value (USD Billion) Forecast by Raw Material, 2020-2035
  • Table 4: Global Market Volume (kilotons) Forecast by Raw Material, 2020-2035
  • Table 5: Global Market Value (USD Billion) Forecast by Category, 2020-2035
  • Table 6: Global Market Volume (kilotons) Forecast by Category, 2020-2035
  • Table 7: Global Market Value (USD Billion) Forecast by End-User, 2020-2035
  • Table 8: Global Market Volume (kilotons) Forecast by End-User, 2020-2035
  • Table 9: North America Market Value (USD Billion) Forecast by Country, 2020-2035
  • Table 10: North America Market Volume (kilotons) Forecast by Country, 2020-2035
  • Table 11: North America Market Value (USD Billion) Forecast by Raw Material, 2020-2035
  • Table 12: North America Market Volume (kilotons) Forecast by Raw Material, 2020-2035
  • Table 13: North America Market Value (USD Billion) Forecast by Category, 2020-2035
  • Table 14: North America Market Volume (kilotons) Forecast by Category, 2020-2035
  • Table 15: North America Market Value (USD Billion) Forecast by End-User, 2020-2035
  • Table 16: North America Market Volume (kilotons) Forecast by End-User, 2020-2035
  • Table 17: Latin America Market Value (USD Billion) Forecast by Country, 2020-2035
  • Table 18: Latin America Market Volume (kilotons) Forecast by Country, 2020-2035
  • Table 19: Latin America Market Value (USD Billion) Forecast by Raw Material, 2020-2035
  • Table 20: Latin America Market Volume (kilotons) Forecast by Raw Material, 2020-2035
  • Table 21: Latin America Market Value (USD Billion) Forecast by Category, 2020-2035
  • Table 22: Latin America Market Volume (kilotons) Forecast by Category, 2020-2035
  • Table 23: Latin America Market Value (USD Billion) Forecast by End-User, 2020-2035
  • Table 24: Latin America Market Volume (kilotons) Forecast by End-User, 2020-2035
  • Table 25: Western Europe Market Value (USD Billion) Forecast by Country, 2020-2035
  • Table 26: Western Europe Market Volume (kilotons) Forecast by Country, 2020-2035
  • Table 27: Western Europe Market Value (USD Billion) Forecast by Raw Material, 2020-2035
  • Table 28: Western Europe Market Volume (kilotons) Forecast by Raw Material, 2020-2035
  • Table 29: Western Europe Market Value (USD Billion) Forecast by Category, 2020-2035
  • Table 30: Western Europe Market Volume (kilotons) Forecast by Category, 2020-2035
  • Table 31: Western Europe Market Value (USD Billion) Forecast by End-User, 2020-2035
  • Table 32: Western Europe Market Volume (kilotons) Forecast by End-User, 2020-2035
  • Table 33: Eastern Europe Market Value (USD Billion) Forecast by Country, 2020-2035
  • Table 34: Eastern Europe Market Volume (kilotons) Forecast by Country, 2020-2035
  • Table 35: Eastern Europe Market Value (USD Billion) Forecast by Raw Material, 2020-2035
  • Table 36: Eastern Europe Market Volume (kilotons) Forecast by Raw Material, 2020-2035
  • Table 37: Eastern Europe Market Value (USD Billion) Forecast by Category, 2020-2035
  • Table 38: Eastern Europe Market Volume (kilotons) Forecast by Category, 2020-2035
  • Table 39: Eastern Europe Market Value (USD Billion) Forecast by End-User, 2020-2035
  • Table 40: Eastern Europe Market Volume (kilotons) Forecast by End-User, 2020-2035
  • Table 41: East Asia Market Value (USD Billion) Forecast by Country, 2020-2035
  • Table 42: East Asia Market Volume (kilotons) Forecast by Country, 2020-2035
  • Table 43: East Asia Market Value (USD Billion) Forecast by Raw Material, 2020-2035
  • Table 44: East Asia Market Volume (kilotons) Forecast by Raw Material, 2020-2035
  • Table 45: East Asia Market Value (USD Billion) Forecast by Category, 2020-2035
  • Table 46: East Asia Market Volume (kilotons) Forecast by Category, 2020-2035
  • Table 47: East Asia Market Value (USD Billion) Forecast by End-User, 2020-2035
  • Table 48: East Asia Market Volume (kilotons) Forecast by End-User, 2020-2035
  • Table 49: South Asia & Pacific Market Value (USD Billion) Forecast by Country, 2020-2035
  • Table 50: South Asia & Pacific Market Volume (kilotons) Forecast by Country, 2020-2035
  • Table 51: South Asia & Pacific Market Value (USD Billion) Forecast by Raw Material, 2020-2035
  • Table 52: South Asia & Pacific Market Volume (kilotons) Forecast by Raw Material, 2020-2035
  • Table 53: South Asia & Pacific Market Value (USD Billion) Forecast by Category, 2020-2035
  • Table 54: South Asia & Pacific Market Volume (kilotons) Forecast by Category, 2020-2035
  • Table 55: South Asia & Pacific Market Value (USD Billion) Forecast by End-User, 2020-2035
  • Table 56: South Asia & Pacific Market Volume (kilotons) Forecast by End-User, 2020-2035
  • Table 57: Middle East and Africa Market Value (USD Billion) Forecast by Country, 2020-2035
  • Table 58: Middle East and Africa Market Volume (kilotons) Forecast by Country, 2020-2035
  • Table 59: Middle East and Africa Market Value (USD Billion) Forecast by Raw Material, 2020-2035
  • Table 60: Middle East and Africa Market Volume (kilotons) Forecast by Raw Material, 2020-2035
  • Table 61: Middle East and Africa Market Value (USD Billion) Forecast by Category, 2020-2035
  • Table 62: Middle East and Africa Market Volume (kilotons) Forecast by Category, 2020-2035
  • Table 63: Middle East and Africa Market Value (USD Billion) Forecast by End-User, 2020-2035
  • Table 64: Middle East and Africa Market Volume (kilotons) Forecast by End-User, 2020-2035

List of Figures

  • Figure 1: Global Market Volume (kilotons) Forecast 2020-2035
  • Figure 2: Global Market Pricing Analysis
  • Figure 3: Global Market Value (USD Billion) Forecast 2020-2035
  • Figure 4: Global Market Value Share and BPS Analysis by Raw Material, 2025 and 2035
  • Figure 5: Global Market Y-o-Y Growth Comparison by Raw Material, 2025-2035
  • Figure 6: Global Market Attractiveness Analysis by Raw Material
  • Figure 7: Global Market Value Share and BPS Analysis by Category, 2025 and 2035
  • Figure 8: Global Market Y-o-Y Growth Comparison by Category, 2025-2035
  • Figure 9: Global Market Attractiveness Analysis by Category
  • Figure 10: Global Market Value Share and BPS Analysis by End-User, 2025 and 2035
  • Figure 11: Global Market Y-o-Y Growth Comparison by End-User, 2025-2035
  • Figure 12: Global Market Attractiveness Analysis by End-User
  • Figure 13: Global Market Value (USD Billion) Share and BPS Analysis by Region, 2025 and 2035
  • Figure 14: Global Market Y-o-Y Growth Comparison by Region, 2025-2035
  • Figure 15: Global Market Attractiveness Analysis by Region
  • Figure 16: North America Market Incremental $ Opportunity, 2025-2035
  • Figure 17: Latin America Market Incremental $ Opportunity, 2025-2035
  • Figure 18: Western Europe Market Incremental $ Opportunity, 2025-2035
  • Figure 19: Eastern Europe Market Incremental $ Opportunity, 2025-2035
  • Figure 20: East Asia Market Incremental $ Opportunity, 2025-2035
  • Figure 21: South Asia & Pacific Market Incremental $ Opportunity, 2025-2035
  • Figure 22: Middle East and Africa Market Incremental $ Opportunity, 2025-2035
  • Figure 23: North America Market Value Share and BPS Analysis by Country, 2025 and 2035
  • Figure 24: North America Market Value Share and BPS Analysis by Raw Material, 2025 and 2035
  • Figure 25: North America Market Y-o-Y Growth Comparison by Raw Material, 2025-2035
  • Figure 26: North America Market Attractiveness Analysis by Raw Material
  • Figure 27: North America Market Value Share and BPS Analysis by Category, 2025 and 2035
  • Figure 28: North America Market Y-o-Y Growth Comparison by Category, 2025-2035
  • Figure 29: North America Market Attractiveness Analysis by Category
  • Figure 30: North America Market Value Share and BPS Analysis by End-User, 2025 and 2035
  • Figure 31: North America Market Y-o-Y Growth Comparison by End-User, 2025-2035
  • Figure 32: North America Market Attractiveness Analysis by End-User
  • Figure 33: Latin America Market Value Share and BPS Analysis by Country, 2025 and 2035
  • Figure 34: Latin America Market Value Share and BPS Analysis by Raw Material, 2025 and 2035
  • Figure 35: Latin America Market Y-o-Y Growth Comparison by Raw Material, 2025-2035
  • Figure 36: Latin America Market Attractiveness Analysis by Raw Material
  • Figure 37: Latin America Market Value Share and BPS Analysis by Category, 2025 and 2035
  • Figure 38: Latin America Market Y-o-Y Growth Comparison by Category, 2025-2035
  • Figure 39: Latin America Market Attractiveness Analysis by Category
  • Figure 40: Latin America Market Value Share and BPS Analysis by End-User, 2025 and 2035
  • Figure 41: Latin America Market Y-o-Y Growth Comparison by End-User, 2025-2035
  • Figure 42: Latin America Market Attractiveness Analysis by End-User
  • Figure 43: Western Europe Market Value Share and BPS Analysis by Country, 2025 and 2035
  • Figure 44: Western Europe Market Value Share and BPS Analysis by Raw Material, 2025 and 2035
  • Figure 45: Western Europe Market Y-o-Y Growth Comparison by Raw Material, 2025-2035
  • Figure 46: Western Europe Market Attractiveness Analysis by Raw Material
  • Figure 47: Western Europe Market Value Share and BPS Analysis by Category, 2025 and 2035
  • Figure 48: Western Europe Market Y-o-Y Growth Comparison by Category, 2025-2035
  • Figure 49: Western Europe Market Attractiveness Analysis by Category
  • Figure 50: Western Europe Market Value Share and BPS Analysis by End-User, 2025 and 2035
  • Figure 51: Western Europe Market Y-o-Y Growth Comparison by End-User, 2025-2035
  • Figure 52: Western Europe Market Attractiveness Analysis by End-User
  • Figure 53: Eastern Europe Market Value Share and BPS Analysis by Country, 2025 and 2035
  • Figure 54: Eastern Europe Market Value Share and BPS Analysis by Raw Material, 2025 and 2035
  • Figure 55: Eastern Europe Market Y-o-Y Growth Comparison by Raw Material, 2025-2035
  • Figure 56: Eastern Europe Market Attractiveness Analysis by Raw Material
  • Figure 57: Eastern Europe Market Value Share and BPS Analysis by Category, 2025 and 2035
  • Figure 58: Eastern Europe Market Y-o-Y Growth Comparison by Category, 2025-2035
  • Figure 59: Eastern Europe Market Attractiveness Analysis by Category
  • Figure 60: Eastern Europe Market Value Share and BPS Analysis by End-User, 2025 and 2035
  • Figure 61: Eastern Europe Market Y-o-Y Growth Comparison by End-User, 2025-2035
  • Figure 62: Eastern Europe Market Attractiveness Analysis by End-User
  • Figure 63: East Asia Market Value Share and BPS Analysis by Country, 2025 and 2035
  • Figure 64: East Asia Market Value Share and BPS Analysis by Raw Material, 2025 and 2035
  • Figure 65: East Asia Market Y-o-Y Growth Comparison by Raw Material, 2025-2035
  • Figure 66: East Asia Market Attractiveness Analysis by Raw Material
  • Figure 67: East Asia Market Value Share and BPS Analysis by Category, 2025 and 2035
  • Figure 68: East Asia Market Y-o-Y Growth Comparison by Category, 2025-2035
  • Figure 69: East Asia Market Attractiveness Analysis by Category
  • Figure 70: East Asia Market Value Share and BPS Analysis by End-User, 2025 and 2035
  • Figure 71: East Asia Market Y-o-Y Growth Comparison by End-User, 2025-2035
  • Figure 72: East Asia Market Attractiveness Analysis by End-User
  • Figure 73: South Asia & Pacific Market Value Share and BPS Analysis by Country, 2025 and 2035
  • Figure 74: South Asia & Pacific Market Value Share and BPS Analysis by Raw Material, 2025 and 2035
  • Figure 75: South Asia & Pacific Market Y-o-Y Growth Comparison by Raw Material, 2025-2035
  • Figure 76: South Asia & Pacific Market Attractiveness Analysis by Raw Material
  • Figure 77: South Asia & Pacific Market Value Share and BPS Analysis by Category, 2025 and 2035
  • Figure 78: South Asia & Pacific Market Y-o-Y Growth Comparison by Category, 2025-2035
  • Figure 79: South Asia & Pacific Market Attractiveness Analysis by Category
  • Figure 80: South Asia & Pacific Market Value Share and BPS Analysis by End-User, 2025 and 2035
  • Figure 81: South Asia & Pacific Market Y-o-Y Growth Comparison by End-User, 2025-2035
  • Figure 82: South Asia & Pacific Market Attractiveness Analysis by End-User
  • Figure 83: Middle East and Africa Market Value Share and BPS Analysis by Country, 2025 and 2035
  • Figure 84: Middle East and Africa Market Value Share and BPS Analysis by Raw Material, 2025 and 2035
  • Figure 85: Middle East and Africa Market Y-o-Y Growth Comparison by Raw Material, 2025-2035
  • Figure 86: Middle East and Africa Market Attractiveness Analysis by Raw Material
  • Figure 87: Middle East and Africa Market Value Share and BPS Analysis by Category, 2025 and 2035
  • Figure 88: Middle East and Africa Market Y-o-Y Growth Comparison by Category, 2025-2035
  • Figure 89: Middle East and Africa Market Attractiveness Analysis by Category
  • Figure 90: Middle East and Africa Market Value Share and BPS Analysis by End-User, 2025 and 2035
  • Figure 91: Middle East and Africa Market Y-o-Y Growth Comparison by End-User, 2025-2035
  • Figure 92: Middle East and Africa Market Attractiveness Analysis by End-User
  • Figure 93: Global Market - Tier Structure Analysis
  • Figure 94: Global Market - Company Share Analysis

Frequently Asked Questions

What is the estimated market size of the Furniture Market in 2025?

The Industry is expected to be valued at USD 540 billion in 2025.

What is the projected value of the Furniture Market by 2035?

The Industry is forecast to reach USD 684.5 billion by 2035.

What is the anticipated CAGR for the Furniture Market during 2025 to 2035?

The Industry is projected to grow at a CAGR of 2.4% over the forecast period.

Which segment dominates the Furniture Market in 2025?

Indoor segment holds 69% of the Industry share in 2025.

Who is the leading company in the Furniture Market and what is its market share?

IKEA is the leading company with a 15% Industry share.

Explore Similar Insights

Future Market Insights

Furniture Market