Reports

- Global Locations -

Headquarters

Future Market Insights, Inc.

Christiana Corporate, 200
Continental Drive, Suite 401,
Newark, Delaware - 19713,
United States

T: +1-845-579-5705

Americas

Future Market Insights, Inc.

616 Corporate Way, Suite 2-9018,
Valley Cottage, NY 10989, United States

T: +1-347-918-3531

MEA

Future Market Insights

1602-6 Jumeirah Bay X2 Tower, Plot No: JLT-PH2-X2A,
Jumeirah Lakes Towers, Dubai,
United Arab Emirates

Europe

Future Market Insights

3rd Floor, 207 Regent Street,
W1B 3HH London
United Kingdom

T: + 44 (0) 20 8123 9659
D: +44 (0) 20 3287 4268

Asia Pacific

Future Market Insights

Office No. 401-A, 4th Floor,
VANTAGE 9, S.No. 36/1/1,
Baner, Pune 411045, India

Garbage Bags Market Outlook (2022 to 2032)

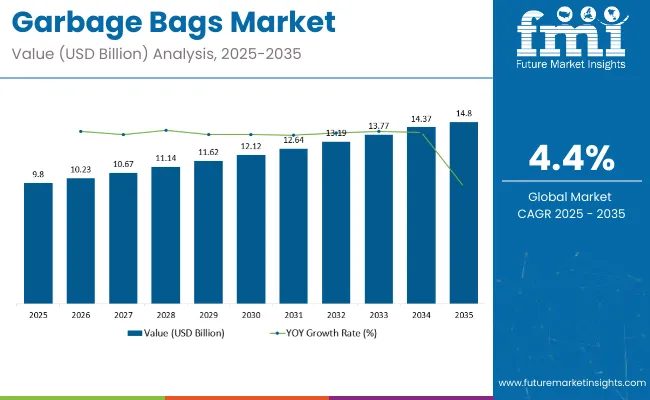
[342 pages Report] The global garbage bags market is projected to have a moderate-paced CAGR of 5.8% during the forecast period. The current valuation of the market is US$ 8.1 Billion in 2022. The market value of the garbage bags market is anticipated to reach a high of US$ 13.6 Billion by the year 2032. A historical CAGR of 4.73% has been recorded by the experts of Future Market Insights for the concerned market. The collective value share for the three countries accounts for 36%, as per the analysis. This growth is supported by the following:

  • Rising consumer demand for eco-friendly and easily disposable garbage bags is expected to drive market growth.
  • Awareness regarding the usage of environmentally sustainable products is anticipated to fuel the demand for disposable garbage bags.
  • Growing awareness regarding cleanliness and hygiene amongst the populace is largely fueling the demand for the concerned product.
  • An increase in housing facilities across the globe is expected to provide ease in the consumption of trash cans among households and, thereby, garbage bags.
  • Easy accessibility and reasonable pricing in stores is an aspect that has led to surging demand for garbage bags in hospitals, residences, and other business establishments.
  • The rise in purchasing power of consumers has fueled the demand for convenient, odour control properties and cost-effective garbage bags for collecting waste, deliberately expanding the market size for garbage bags.
  • Ban on single-use plastic bags to promote biodegradable alternatives to give a new face to the forum.
  • An upsurge of waste generation in the wake of urbanization has created the utmost need for garbage bags, coupled with the demand from commercial places and households are likely to bolster the dynamics in the garbage bags market through 2032.

Although the market is projected to have healthy growth, it has been revealed by expert analysts at FMI that certain aspects are likely to curb the growth of the forum during the period 2022 to 2032. These elements are the key restraints prevailing in the market and are identified as follows:

  • Government regulations concerning the usage of plastic garbage bags are likely to inhibit the expansion of the market through the estimated period of study.
  • Significant environmental hazards associated with garbage bags, like land, air, and water pollution, are forecast to pose a threat and hinder the pace of advancement for the garbage bags market through 2032.

Don't pay for what you don't need

Customize your report by selecting specific countries or regions and save 30%!

Plant-based Garbage Bags Curates Growth Opportunities for Market Players

While analyzing the market in-depth, it is identified that garbage bags are available in a wide variety that, includes industrial garbage bags, black garbage bags to heat pools, lawn garbage bags, contractor garbage bags, compostable garbage bags, and more.

The analysts at FMI have identified that certain new advances have taken place in the global garbage bags marketplace, which includes the use of plant-based garbage bags.

The usage of these plant-based garbage bags is gaining rapid traction amongst the urban populace, owing to their reusable, sustainable, and recyclable nature. The environmentally-concerned base of customers is nowadays preferring biodegradable trash bags. It is witnessed that the ban on plastic bags worldwide, causing harm to the ecosystem, has drastically affected the sustainable products market.

The demand for sustainable suppliers and green skill development programs are also some causes that promote the usage of plant-based garbage bags across the globe. Therefore, it is anticipated that the global garbage bags market is likely to have lucrative growth prospects for the manufacturers prevailing in the market during the forthcoming years.

Report Attribute Details
Garbage Bags Market Value (2022) US$ 8.1 Billion
Garbage Bags Market Anticipated Value (2032) US$ 13.6 Billion
Garbage Bags Projected Growth Rate (2022 to 2032) 5.8%

A Contrast with the Historical Market Scenario

The statistics collected by Future Market Insights, it gets to reveal that the global forum of garbage bags has witnessed an unprecedented surge over the past few years. The manufacturers in the market are in tandem with the growing demand for garbage bags. There has been a gradual rise from a 4.73% CAGR during the period 2017 to 2021 to a CAGR of 5.8% in the forecast period.

This substantial growth in the market size can be vastly attributed to the changing preference of consumers to dispose of trash in a sanitary way. Most significantly, garbage bags are witnessed to provide a means for households to help the environment by disposing of recyclables or decreasing garbage, which might otherwise end up getting littered in backyards and public places.

Public awareness of the necessity of cleanliness and sanitation, coupled with an increase in waste output throughout the globe, is a major demand driver reshaping the landscape for key players in the garbage bags market. Increased focus on new garbage bag breakdown methods or processes is expected to boost the usage of these trash bags in the estimated study period.

Ismail Sutaria
Ismail Sutaria

Principal Consultant

Talk to Analyst

Find your sweet spots for generating winning opportunities in this market.

Comparative Analysis of Adjacent Markets

Garbage Bags Market:

Differentiating Aspects Garbage Bags Market
CAGR 5.8%
Market Valuation in 2022 US$ 8.1 Billion
Projected Market Value in 2032 US$ 13.6 Billion
Drivers
  • Rising awareness about hygiene and concern about waste management amongst the populace to drive growth.
  • Reasonable pricing and easy availability to fuel market demand for garbage bags.

Biodegradable Trash Bags Market:

Differentiating Aspects Biodegradable Trash Bags Market
CAGR 7.8%
Market Valuation in 2022 US$ 2,563.13 Million
Projected Market Value in 2032 US$ 5,431.99 Million
Drivers
  • Rapid urbanization and ban on plastic garbage bags to bolster demand for biodegradable trash bags.
  • Green skill development programs and the trend of sustainable products are fueling market expansion.

Scented Trash Bags Market:

Differentiating Aspects Scented Trash Bags Market
CAGR 3.5%
Market Valuation in 2022 US$ 1.7 Billion
Projected Market Value in 2032 US$ 2.3 Billion
Drivers
  • Consumer preference for eco-friendlier options to boost demand for bioplastics-scented trash bags.
  • Properties like fresh aroma, leak-proof, puncture resistance, and tear-resistance are likely to fuel the market propulsion for scented trash bags.

Category-wise Insights

Domineering Segments in Tandem with Consumer Preference

Recyclable Garbage Bags - By Product Type

By product type, the market is segmented into recyclable and non-recyclable garbage bags. It has been studied by the analysts at Future Market Insights that the recyclable garbage bags segment is likely to hold a major market share, recording a CAGR of 5.6% through the forecast period.

The prime reasons determining the propulsion of this segment can be identified below:

  • Recyclable garbage bags can be easily disposed of and are more environment-friendly in comparison to non-recyclable types.
  • Recyclable garbage bags are widely available in different sizes as per the convenience of the consumers and are least prone to tearing as compared to the other variants, which results in large consumer demand for this product.

Hospitality Sector - By End-use

By end-use, the market is segmented into residential, commercial, hospitality, and industrial. It has been identified that the hospitality segment is most likely to witness the maximum positive change, along with recording the highest growth. This segment has registered a CAGR of 3.91% during the base year.

The rapid propulsion of this segment is owing to:

  • The increase in waste generated by resorts, restaurants, hotels, hospitals, and other commercial entities, is driving the demand for garbage bags.
  • They urge hotels and restaurants to keep the surroundings clean and protect the interests of the customers since dirty surroundings can lead to dissatisfied customers in the hospitality industry.

Hypermarkets and Supermarkets - By Distribution Channel

By distribution channel, the market is segmented into online stores, convenience stores, hypermarkets & supermarkets, and others. The hypermarkets & supermarkets segment is expected to hold the dominant share through the forecast period, owing to:

  • The availability of a wide variety of cleaning and washing items is simultaneously boosting the sales of garbage bags by customers.
  • The provision of discounts and coupons in such stores on select product purchases are exclusively attracting the customers towards bagging this product from such stores.

Get the data you need at a Fraction of the cost

Personalize your report by choosing insights you need
and save 40%!

Specialty Hues and Scented Garbage Bags to Gain Prominence in the United States

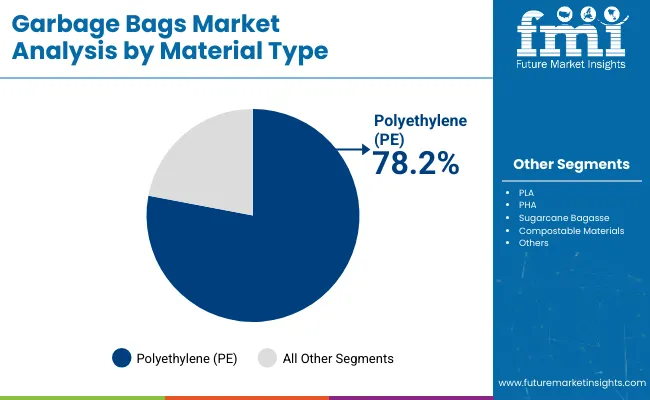
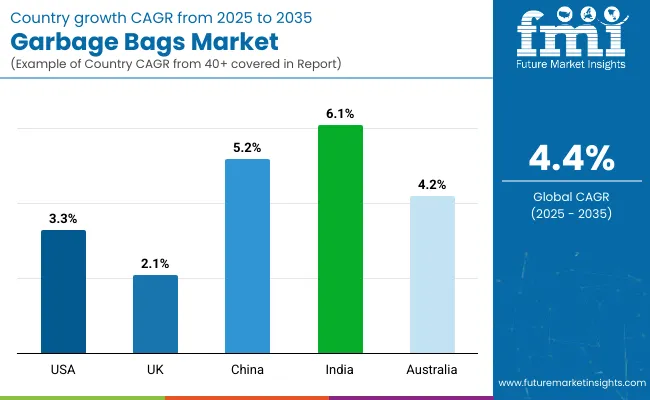
The US garbage bags market is valued at US$ 2.59 billion in 2022, and it is projected to be worth US$ 5.58 billion by 2032, registering a CAGR of 7.98%. Polyethylene bags, usually made from polyethylene, are tough and light and hold garbage securely without leaking or spilling. Therefore, they are widely used across residential, commercial, and industrial settings.

In the United States, plastic trash bags witness significant demand from the residential sector. In the United States, cities and states have taken steps toward zero-waste policies. The ban on single-use plastic bags has been passed in 11 states, the ban on expanded polystyrene containers has been passed in seven states, and more cities are considering bans on other single-use food ware and packaging.

Home Depot, a multinational home improvement retail corporation based in the United States, makes available, as per consumer demand, innovative types of trash bags, such as vanilla, cinnamon, and spring flowers scented bags, and garbage bags in soft pastel colors. These bags currently make up more than half of all 13-gallon garbage bags.

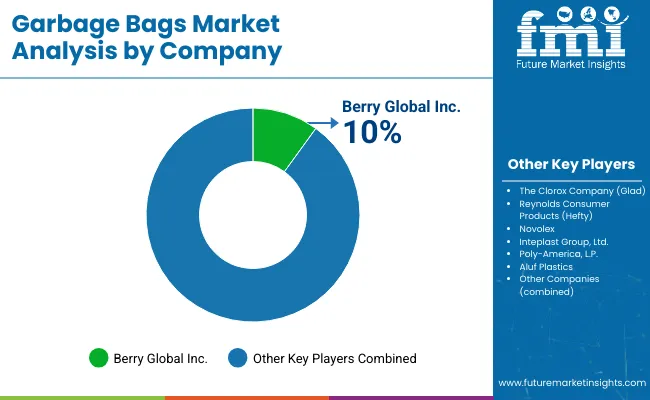
Due to some key players in the US garbage bag market, such as Berry Global Inc. and Reynolds Consumer Products LLC, competition is fierce. As a result of strategic partnerships, market players can develop new products, which fuels the market's growth.

For instance, For the development of next-generation plastics technologies that reduce energy consumption and carbon emissions, the US Department of Energy (DOE) announced USD 13.4 million in funding in January 2022. Seven selected Research and Development projects will help turn plastic films into valuable materials and develop biodegradable and recyclable plastics under the direction of industry and universities.

A Mantra for Soaring European Market Share: Reducing Plastic Footprints

The garbage bags market share in Europe is estimated to surpass US$ 3618.70 by 2032, advancing at a CAGR of 4.7%. Market growth for garbage bags in Europe is expected to be driven by the growing need for waste management. In 2015, the European Commission made separate waste collection mandatory.

By the directive, paper, metal, plastic, and glass waste should be collected separately to improve waste management practices. By December 31, 2023, the commission plans to establish a separate bio-waste collection system, as well as a textile and hazardous household waste collection system, by January 1, 2025.

Over the forecast period, the European region is expected to account for 31.9% of the market share. According to the European Commission, in recent years, 492 kg of municipal waste per capita has been generated.

As part of their efforts to strengthen their market position in the Europe garbage market, key players are launching various products. The Eco Blend Max trash can line, launched by Novolex in November 2019, is made from 50% post-consumer recycled plastic (PCR). The trash can liners are designed to fit commonly available trash cans.

Increasing Adoption and Hygiene Awareness have Led to the Rise in the Use of Garbage Bags in Japan

Developments in the manufacturing sector have led to higher adoption of garbage bags in Japanese markets. This can be attributed to the high standard of living in Japan, which has contributed to a high disposable income. In Japan, garbage bags are considered more of a commodity than a luxury.

With rapid urbanization in emerging markets, garbage bags have become increasingly popular. With continued development in Japan and higher disposable incomes, garbage bag consumption is expected to rise.

Garbage bags are widely utilized in the retail, industrial, and institutional segments. Demand for star-sealed bottom garbage bags is high due to the high durability and storage capacities of these bags. Drawstring garbage bags are widely used in the retail segment but are rarely used in the institutional and industrial segments, as these are not available for large capacities.

Increasing Garbage Transportation and Distribution Facilities are Driving Korea's Demand for Garbage Bags

The growing awareness among individuals about hygiene and cleanliness of the environment represents one of the key factors driving the garbage bags market in Korea. Additionally, the Korean government and regulatory bodies have taken numerous measures to promote the use of garbage bags, propelling the market's expansion.

Additionally, individuals are becoming more interested in new garbage bag breakdown methods and processes, which are positively impacting the market. The demand for garbage bags in Korea is also being catalyzed by improved waste processing methods and garbage transportation and distribution facilities.

As an additional benefit, garbage bags can be used to store and carry waste without spreading diseases or infections. Apart from this, the increasing demand for waterproof garbage bags in the automotive industry is offering lucrative growth opportunities to end-users.

Regional Insights

Specialty Hues and Scented Garbage Bags to Gain Prominence in the United States

It is anticipated that the North American region is likely to dominate the global market share for garbage bags. It is projected that this region is going to exhibit a CAGR of 8.26% during the forecast period. 

In the United States, plastic trash bags witness significant demand from the residential sector. US cities and states are taking strides toward a zero-waste policy. Around 11 states in the country have passed bans on single-use plastic bags, seven states have passed bans on expanded polystyrene containers, and more cities are considering bans on other single-use food wares and packaging.

According to Home Depot, a United States-based multinational home improvement retail corporation, innovative types of trash bags like scented bags available in vanilla, cinnamon, and spring flowers, and garbage bags in soft pastel colors are made available as per consumer demand currently make up more than half of all 13-gallon garbage bags.

Reduction of Plastic Footprints - Mantra to Surging Market Share in Europe

The garbage bags market share in Europe is estimated to surpass US$ 3618.70 by 2032 by 2032, advancing at a CAGR of 4.7%

The growing need for waste management is expected to foster the market growth of trash bags in Europe. The European Commission made separate waste collection mandatory in the year 2015. According to the directive, the waste should be separately collected as paper, metal, plastic, and glass waste so as to improve waste management practices. The commission is also planning for a separate collection system for bio-waste by December 31, 2023, and a system for textile and hazardous household wastes by January 1, 2025, as well.

The European regions accounted for a market share of 31.9% in 2021. Increasing waste generation is expected to drive demand for garbage bags over the forecast period. According to European Commission, 492 kg of municipal waste per capita was generated in recent years.

Municipal Solid Waste in China to Act as a Boon for the Garbage Bags Market

The presence of a high population in China is leading to the generation of a large amount of waste. Forecasts suggest that the volume of China’s waste would be double that of America’s municipal solid waste. Though the Chinese authorities are rigorously involved in reducing the amount of waste generated in the country, there still exists waste that ends up in landfills and flows into the oceans.

China accounts for 29% of global garbage bag production, and its initiative is to reduce the country’s single-use plastic, with the aim of recycling 35% of waste generated, boosting the garbage bag production industry.

At the same time, China is the leading force in the global digital economy consisting of 42% of global transactions. This creates an opportunity for innovative digital solutions to manage waste that ensures proper waste management.

Start-up Ecosystem

New Entrants to Foster Innovation in the Global Market

The startups in the garbage bags market are adding a new edge to the properties of excavators by curating innovations beyond the imagination. They are continually upgrading the garbage bags with advanced technology and curating innovative types of bags that are gaining consumer attention, like bright and vibrant colors and soft pastels, along with scented garbage bags. Start-up firms are triggering the expansion of the market with their unique attempts.

Top Start-ups to Watch For

Start-up Company Tombag
Country Australia
Description It is a certified B Corp Australian enterprise on a mansion to rid the world of single-use garbage bags with their sustainable and reusable garbage bags. The bags manufactured by this firm are waterproof, washable, and reusable.
Start-up Company Navkar Plastic
Country India
Description This start-up firm from New Delhi is manufacturing biodegradable garbage bags for abiding by the government regulations of going greener and manufacturing environment-friendly products.

Competitive Landscape

Industry Biggies Stirring Up the Market-o-nomics

Key players are focusing on launching new products in order to strengthen their market presence in the global garbage bags market. The nature of the global garbage bags market is fragmented owing to the presence of multiple vendors.

Leading players in the garbage bags market are investing in product quality improvement and innovative launches to attract better revenues. Others are engaging in joint ventures, merger and acquisition strategies, and other collaborative efforts to ensure a significant position in the overall market competition.

3 Iconic Companies Having Major Dominance

  • Berry Global

Berry Global is headquartered in the US and operates the business under various segments such as Engineered Materials, Health, Hygiene & Specialties, and Consumer Packaging. The company offers various types of garbage bags.

  • The Clorox Company

The Clorox Company is headquartered in the US and offers products through the following business segments-Cleaning, Household, Lifestyle, and International. The company offers various types of garbage bags through its sub-brand, The Glad Products Company.

  • Harwal Group of Companies

Harwal Group of Companies is headquartered in UAE and offers products through the following business units: Building materials, Industrial products, Consumer products, Packaging solutions, Furniture, and Refrigerators. The company offers 30G, 50G, 55G, and 55G heavy-duty, and other garbage bags.

Recent Developments

  • In July 2022, Reynolds Consumer Products launched an updated line of small and medium waste bags with premium features.
  • In August 2021, Reynolds Consumer Products announced the expansion of its Hefty EnergyBag program to encompass Fulton, Gwinnett, Cherokee, and Forsyth counties in the Greater Atlanta area. In 2018, the initiative was launched in Cobb County, Georgia, for the first time. As a result of this expansion, the Hefty EnergyBag program is now available to almost 1.4 million families in the United States across all active programs.
  • In February 2020, The RKW Group, a German plastic firm manufacturer expanded its waste bag production facilities by commissioning 2 production lines of capacity 3000 tonnes per year at the site of Echte, Germany.
  • In June 2020, Polykar Industries Inc., a Quebec-based American leader in sustainable packaging set up their plant at Ville Saint Laurent. The plant has the capacity to recycle 10,000 tonnes of commercial and industrial plastic waste annually and therefore can be efficiently utilized to develop a large b=volume of recyclable garbage bags.
  • In November 2019, Novolex launched Eco Blend Max, a new line of trash can liners made with 50% post-consumer recycled (PCR) plastic. This trash can liner is designed to fit the commonly available trash cans.

Some of the other key companies identified are

  • Terdex GmbH
  • Novplasta
  • Extrapack Ltd.
  • Dagoplast AS
  • International Plastic, Inc.
  • MirPack TM
  • Plasta.It
  • Primax D.o.o

Key Segments in the Garbage Bags Market

By Material Type:

  • Polyethylene
  • Polypropylene (PP)
  • Others

By Capacity:

  • EPS
  • PUR
  • VIP
  • PCM
  • Others

By End-use:

  • Services
  • Healthcare
  • Industrial Product & Construction
  • Retail
  • Hospitality
  • Other

By Region:

  • North America
  • Latin America
  • Asia Pacific
  • Middle East & Africa (MEA)
  • Europe

Frequently Asked Questions

The growth outlook for the garbage bags market is predicted to advance at a CAGR of 5.8% from 2022 to 2032.

The North American region is anticipated to lead the garbage bags market during the forecast period.

The market valuation of the garbage bags market stands at US$ 8.1 Billion in 2022.

The garbage bags market is likely to hold a valuation of US$ 13.6 Billion by 2032.

The hospitality sector is the key driver in the garbage bags market.

Table of Content

1. Executive Summary | Garbage Bags Market

    1.1. Global Market Outlook

    1.2. Market Analysis

    1.3. Analysis and Recommendations

2. Market Overview

    2.1. Market Coverage

    2.2. Market Definition

3. Key Market Trends

    3.1. Key Trends Impacting the Market

    3.2. Product Innovation Trends

4. Key Success Factors

    4.1. Product Adoption Analysis

    4.2. Product USPs / Features

5. Global Market Demand Analysis 2016 to 2022 and Forecast, 2022 to 2031

    5.1. Historical Market Volume (Million Units) Analysis, 2016 to 2022

    5.2. Current and Future Market Volume (Million Units) Projections, 2022 to 2031

    5.3. Y-o-Y Growth Trend Analysis

6. Global Market - Pricing Analysis

    6.1. Regional Pricing Analysis

    6.2. Pricing Break-up

    6.3. Global Average Pricing Analysis Benchmark

7. Global Market Demand (Value in US$ Million) Analysis 2016 to 2022 and Forecast, 2022 to 2031

    7.1. Historical Market Value (US$ Million) Analysis, 2016 to 2022

    7.2. Current and Future Market Value (US$ Million) Projections, 2022 to 2031

        7.2.1. Y-o-Y Growth Trend Analysis

        7.2.2. Absolute $ Opportunity Analysis

8. Market Background

    8.1. Global Packaging Market Outlook

    8.2. Global Rigid Packaging Market Outlook

    8.3. Mergers and Acquisitions in Packaging Industries Outlook

    8.4. Key Industry Perspective: What Industry Leaders are saying?

    8.5. Macro-Economic Factors

        8.5.1. Global GDP Growth Outlook

        8.5.2. GDP Per Capita

        8.5.3. Manufacturing Value Added

        8.5.4. Industrial Production

    8.6. Forecast Factors - Relevance & Impact

        8.6.1. Global Industrial Sector Growth 

        8.6.2. E-Commerce Industry Growth

        8.6.3. Organized Retail Industry Growth

        8.6.4. Regional Manufacturing Value-Added Growth

        8.6.5. Segmental Revenue Growth of Key Players

        8.6.6. Top Companies Historical Revenue Growth

    8.7. Value Chain Analysis

        8.7.1. Key Participants

            8.7.1.1. Raw Material Suppliers

            8.7.1.2. Manufacturers

            8.7.1.3. Distributors

        8.7.2. Profitability Margin

    8.8. Market Dynamics

        8.8.1. Drivers

        8.8.2. Restraints

        8.8.3. Opportunity Analysis

    8.9. Impact of COVID-19 

        8.9.1. Current Statistics and Probable Future Impact 

        8.9.2. Impact of COVID-19 on Market

9. Global Market Analysis 2016 to 2022 and Forecast 2022 to 2031, By Material Type

    9.1. Introduction

    9.2. Historical Market Size (US$ Million) and Volume (Million Units) Analysis, By Material Type, 2016 to 2022

    9.3. Current and Future Market Size (US$ Million) and Volume (Million Units) Analysis and Forecast, By Material Type, 2022 to 2031

        9.3.1. Polyethylene

        9.3.2. Polypropylene (PP)

        9.3.3. Others

    9.4. Market Attractiveness Analysis, By Material Type

10. Global Market Analysis 2016 to 2022 and Forecast 2022 to 2031, By Capacity

    10.1. Introduction 

    10.2. Historical Market Size (US$ Million) and Volume Analysis, By Capacity, 2016 to 2022

    10.3. Current and Future Market Size (US$ Million) and Volume Analysis and Forecast, By Capacity,2022 to 2031

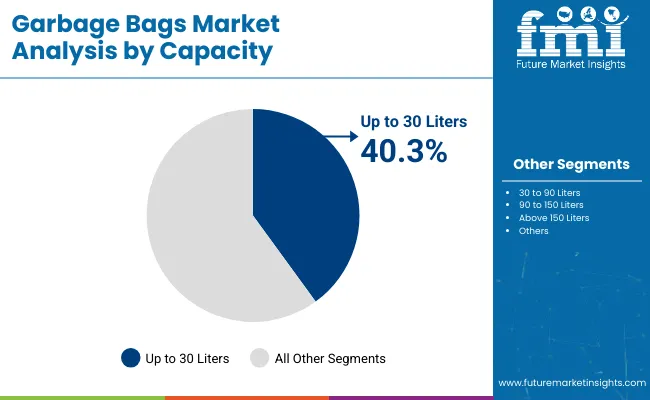
        10.3.1. Up to 30 Litres

        10.3.2. 30-90 Litres

        10.3.3. 90-150 Litres

        10.3.4. Above 150 Litres

    10.4. Market Attractiveness Analysis, By Capacity

11. Global Market Analysis 2016 to 2022 and Forecast 2022 to 2031, By Sales Channel

    11.1. Introduction

    11.2. Historical Market Size (US$ Million) and Volume Analysis, By Sales Channel, 2016 to 2022

    11.3. Current and Future Market Size (US$ Million) and Volume Analysis and Forecast, By Sales Channel, 2022 to 2031

        11.3.1. Direct Sales (Manufacturers)

        11.3.2. Distributors/Wholesalers

    11.4. Market Attractiveness Analysis, By Sales Channel

12. Global Market Analysis 2016 to 2022 and Forecast 2022 to 2031, By End Use

    12.1. Introduction 

    12.2. Historical Market Size (US$ Million) and Volume Analysis, By End Use, 2016 to 2022

    12.3. Current and Future Market Size (US$ Million) and Volume Analysis and Forecast, By End Use, 2022 to 2031

        12.3.1. Services

        12.3.2. Healthcare

        12.3.3. Industrial Product & Construction

        12.3.4. Retail

        12.3.5. Hospitality

        12.3.6. Civil Government

        12.3.7. Defense

        12.3.8. Transportation

    12.4. Market Attractiveness Analysis, By End Use

13. Global Market Analysis 2016 to 2022 and Forecast 2022 to 2031, by Region

    13.1. Introduction

    13.2. Historical Market Size (US$ Million) and Volume Analysis, by Region, 2016 to 2022

    13.3. Current Market Size (US$ Million) and Volume Analysis and Forecast, by Region, 2022 to 2031

        13.3.1. North America

        13.3.2. Latin America

        13.3.3. Europe

        13.3.4. Middle East and Africa (MEA)

        13.3.5. East Asia

        13.3.6. South Asia

        13.3.7. Oceania

    13.4. Market Attractiveness Analysis, by Region

14. North America Market Analysis 2016 to 2022 and Forecast 2022 to 2031

    14.1. Introduction

    14.2. Pricing Analysis

    14.3. Historical Market Size (US$ Million) and Volume (Million Units) Analysis, by Market Taxonomy, 2016 to 2022

    14.4. Market Size (US$ Million) and Volume (Million Units) Forecast, by Market Taxonomy, 2022 to 2031

        14.4.1. By Country

            14.4.1.1. The US

            14.4.1.2. Canada

        14.4.2. By Material Type

        14.4.3. By Capacity

        14.4.4. By Sales Channel

        14.4.5. By End Use

    14.5. Market Attractiveness Analysis

        14.5.1. By Country

        14.5.2. By Material Type

        14.5.3. By Capacity

        14.5.4. By Sales Channel

        14.5.5. By End Use

15. Latin America Market Analysis 2016 to 2022 and Forecast 2022 to 2031

    15.1. Introduction

    15.2. Pricing Analysis

    15.3. Historical Market Size (US$ Million) and Volume (Million Units) Analysis, by Market Taxonomy, 2016 to 2022

    15.4. Market Size (US$ Million) and Volume (Million Units) Forecast, by Market Taxonomy, 2022 to 2031

        15.4.1. By Country

            15.4.1.1. Brazil

            15.4.1.2. Mexico

            15.4.1.3. Argentina

            15.4.1.4. Rest of Latin America

        15.4.2. By Material Type

        15.4.3. By Capacity

        15.4.4. By Sales Channel

        15.4.5. By End Use

    15.5. Market Attractiveness Analysis

        15.5.1. By Country

        15.5.2. By Material Type

        15.5.3. By Capacity

        15.5.4. By Sales Channel

        15.5.5. By End Use

16. Europe Market Analysis 2016 to 2022 and Forecast 2022 to 2031

    16.1. Introduction

    16.2. Pricing Analysis

    16.3. Historical Market Size (US$ Million) and Volume (Million Units) Analysis, by Market Taxonomy, 2016 to 2022

    16.4. Market Size (US$ Million) and Volume (Million Units) Forecast, by Market Taxonomy, 2022 to 2031

        16.4.1. By Country

            16.4.1.1. Germany

            16.4.1.2. Italy

            16.4.1.3. France

            16.4.1.4. The UK

            16.4.1.5. Spain

            16.4.1.6. BENELUX

            16.4.1.7. Nordics

            16.4.1.8. Russia

            16.4.1.9. Poland

            16.4.1.10. Rest of Europe

        16.4.2. By Material Type

        16.4.3. By Capacity

        16.4.4. By Sales Channel

        16.4.5. By End Use

    16.5. Market Attractiveness Analysis

        16.5.1. By Country

        16.5.2. By Material Type

        16.5.3. By Capacity

        16.5.4. By Sales Channel

        16.5.5. By End Use

17. Middle East and Africa Market Analysis 2016 to 2022 and Forecast 2022 to 2031

    17.1. Introduction

    17.2. Pricing Analysis

    17.3. Historical Market Size (US$ Million) and Volume (Million Units) Analysis, by Market Taxonomy, 2016 to 2022

    17.4. Market Size (US$ Million) and Volume (Million Units) Forecast, by Market Taxonomy, 2022 to 2031

        17.4.1. By Country

            17.4.1.1. GCC Countries

            17.4.1.2. Turkey

            17.4.1.3. Northern Africa

            17.4.1.4. South Africa

            17.4.1.5. Rest of Middle East and Africa

        17.4.2. By Material Type

        17.4.3. By Capacity

        17.4.4. By Sales Channel

        17.4.5. By End Use

    17.5. Market Attractiveness Analysis

        17.5.1. By Country

        17.5.2. By Material Type

        17.5.3. By Capacity

        17.5.4. By Sales Channel

        17.5.5. By End Use

18. East Asia Market Analysis 2016 to 2022 and Forecast 2022 to 2031

    18.1. Introduction

    18.2. Pricing Analysis

    18.3. Historical Market Size (US$ Million) and Volume (Million Units) Analysis, by Market Taxonomy, 2016 to 2022

    18.4. Market Size (US$ Million) and Volume (Million Units) Forecast, by Market Taxonomy, 2022 to 2031

        18.4.1. By Country

            18.4.1.1. China

            18.4.1.2. Japan

            18.4.1.3. South Korea

        18.4.2. By Material Type

        18.4.3. By Capacity

        18.4.4. By Sales Channel

        18.4.5. By End Use

    18.5. Market Attractiveness Analysis

        18.5.1. By Country

        18.5.2. By Material Type

        18.5.3. By Capacity

        18.5.4. By Sales Channel

        18.5.5. By End Use

19. South Asia Market Analysis 2016 to 2022 and Forecast 2022 to 2031

    19.1. Introduction

    19.2. Pricing Analysis

    19.3. Historical Market Size (US$ Million) and Volume (Million Units) Analysis, by Market Taxonomy, 2016 to 2022

    19.4. Market Size (US$ Million) and Volume (Million Units) Forecast, by Market Taxonomy, 2022 to 2031

        19.4.1. By Country

            19.4.1.1. India

            19.4.1.2. Thailand

            19.4.1.3. Indonesia

            19.4.1.4. Malaysia

            19.4.1.5. Rest of South Asia

        19.4.2. By Material Type

        19.4.3. By Capacity

        19.4.4. By Sales Channel

        19.4.5. By End Use

    19.5. Market Attractiveness Analysis

        19.5.1. By Country

        19.5.2. By Material Type

        19.5.3. By Capacity

        19.5.4. By Sales Channel

        19.5.5. By End Use

20. Oceania Market Analysis 2016 to 2022 and Forecast 2022 to 2031

    20.1. Introduction

    20.2. Pricing Analysis

    20.3. Historical Market Size (US$ Million) and Volume (Million Units) Analysis, by Market Taxonomy, 2016 to 2022

    20.4. Market Size (US$ Million) and Volume (Million Units) Forecast, by Market Taxonomy, 2022 to 2031

        20.4.1.  By Country

            20.4.1.1. Australia 

            20.4.1.2. New Zealand

        20.4.2. By Material Type

        20.4.3. By Capacity

        20.4.4. By Sales Channel

        20.4.5. By End Use

    20.5. Market Attractiveness Analysis

        20.5.1. By Country

        20.5.2. By Material Type

        20.5.3. By Capacity

        20.5.4. By Sales Channel

        20.5.5. By End Use

21. Market Country-wise Analysis 2022 & 2030

    21.1. The US Market Analysis

        21.1.1. Market Volume (Million Units) and Value (US$ Million) Analysis and Forecast, by Market Taxonomy

            21.1.1.1. By Material Type

            21.1.1.2. By Capacity

            21.1.1.3. By Sales Channel

            21.1.1.4. By End Use

    21.2. Canada Market Analysis

        21.2.1. Market Volume (Million Units) and Value (US$ Million) Analysis and Forecast, by Market Taxonomy

            21.2.1.1. By Material Type

            21.2.1.2. By Capacity

            21.2.1.3. By Sales Channel

            21.2.1.4. By End Use

    21.3. Brazil Market Analysis

        21.3.1. Market Volume (Million Units) and Value (US$ Million) Analysis and Forecast, by Market Taxonomy

            21.3.1.1. By Material Type

            21.3.1.2. By Capacity

            21.3.1.3. By Sales Channel

            21.3.1.4. By End Use

    21.4. Mexico Market Analysis

        21.4.1. Market Volume (Million Units) and Value (US$ Million) Analysis and Forecast, by Market Taxonomy

            21.4.1.1. By Material Type

            21.4.1.2. By Capacity

            21.4.1.3. By Sales Channel

            21.4.1.4. By End Use

    21.5. Germany Market Analysis

        21.5.1. Market Volume (Million Units) and Value (US$ Million) Analysis and Forecast, by Market Taxonomy

            21.5.1.1. By Material Type

            21.5.1.2. By Capacity

            21.5.1.3. By Sales Channel

            21.5.1.4. By End Use

    21.6. Italy Market Analysis

        21.6.1. Market Volume (Million Units) and Value (US$ Million) Analysis and Forecast, by Market Taxonomy

            21.6.1.1. By Material Type

            21.6.1.2. By Capacity

            21.6.1.3. By Sales Channel

            21.6.1.4. By End Use

    21.7. France Market Analysis

        21.7.1. Market Volume (Million Units) and Value (US$ Million) Analysis and Forecast, by Market Taxonomy

            21.7.1.1. By Material Type

            21.7.1.2. By Capacity

            21.7.1.3. By Sales Channel

            21.7.1.4. By End Use

    21.8. The UK Market Analysis

        21.8.1. Market Volume (Million Units) and Value (US$ Million) Analysis and Forecast, by Market Taxonomy

            21.8.1.1. By Material Type

            21.8.1.2. By Capacity

            21.8.1.3. By Sales Channel

            21.8.1.4. By End Use

    21.9. Spain Market Analysis

        21.9.1. Market Volume (Million Units) and Value (US$ Million) Analysis and Forecast, by Market Taxonomy

            21.9.1.1. By Material Type

            21.9.1.2. By Capacity

            21.9.1.3. By Sales Channel

            21.9.1.4. By End Use

    21.10. Russia Market Analysis

        21.10.1. Market Volume (Million Units) and Value (US$ Million) Analysis and Forecast, by Market Taxonomy

            21.10.1.1. By Material Type

            21.10.1.2. By Capacity

            21.10.1.3. By Sales Channel

            21.10.1.4. By End Use

    21.11. Poland Market Analysis

        21.11.1. Market Volume (Million Units) and Value (US$ Million) Analysis and Forecast, by Market Taxonomy

            21.11.1.1. By Material Type

            21.11.1.2. By Capacity

            21.11.1.3. By Sales Channel

            21.11.1.4. By End Use

    21.12. Turkey Market Analysis

        21.12.1. Market Volume (Million Units) and Value (US$ Million) Analysis and Forecast, by Market Taxonomy

            21.12.1.1. By Material Type

            21.12.1.2. By Capacity

            21.12.1.3. By Sales Channel

            21.12.1.4. By End Use

    21.13. South Africa Market Analysis

        21.13.1. Market Volume (Million Units) and Value (US$ Million) Analysis and Forecast, by Market Taxonomy

            21.13.1.1. By Material Type

            21.13.1.2. By Capacity

            21.13.1.3. By Sales Channel

            21.13.1.4. By End Use

    21.14. GCC Countries Market Analysis

        21.14.1. Market Volume (Million Units) and Value (US$ Million) Analysis and Forecast, by Market Taxonomy

            21.14.1.1. By Material Type

            21.14.1.2. By Capacity

            21.14.1.3. By Sales Channel

            21.14.1.4. By End Use

    21.15. Japan Market Analysis

        21.15.1. Market Volume (Million Units) and Value (US$ Million) Analysis and Forecast, by Market Taxonomy

            21.15.1.1. By Material Type

            21.15.1.2. By Capacity

            21.15.1.3. By Sales Channel

            21.15.1.4. By End Use

    21.16. South Korea Market Analysis

        21.16.1. Market Volume (Million Units) and Value (US$ Million) Analysis and Forecast, by Market Taxonomy

            21.16.1.1. By Material Type

            21.16.1.2. By Capacity

            21.16.1.3. By Sales Channel

            21.16.1.4. By End Use

    21.17. India Market Analysis

        21.17.1. Market Volume (Million Units) and Value (US$ Million) Analysis and Forecast, by Market Taxonomy

            21.17.1.1. By Material Type

            21.17.1.2. By Capacity

            21.17.1.3. By Sales Channel

            21.17.1.4. By End Use

    21.18. China Market Analysis

        21.18.1. Market Volume (Million Units) and Value (US$ Million) Analysis and Forecast, by Market Taxonomy

            21.18.1.1. By Material Type

            21.18.1.2. By Capacity

            21.18.1.3. By Sales Channel

            21.18.1.4. By End Use

    21.19. Australia Market Analysis

        21.19.1. Market Volume (Million Units) and Value (US$ Million) Analysis and Forecast, by Market Taxonomy

            21.19.1.1. By Material Type

            21.19.1.2. By Capacity

            21.19.1.3. By Sales Channel

            21.19.1.4. By End Use

    21.20. New Zealand Market Analysis

        21.20.1. Market Volume (Million Units) and Value (US$ Million) Analysis and Forecast, by Market Taxonomy

            21.20.1.1. By Material Type

            21.20.1.2. By Capacity

            21.20.1.3. By Sales Channel

            21.20.1.4. By End Use

22. Market Structure Analysis

    22.1. Market Analysis, by Tier of Companies 

    22.2. Market Share Analysis of Top Players

    22.3. Market Presence Analysis

        22.3.1. By Regional footprint of Players

        22.3.2. Product foot print by Players

23. Competition Analysis

    23.1. Competition Dashboard

    23.2. Competition Benchmarking

    23.3. Competition Deep Dive 

        23.3.1. Terdex GmbH

            23.3.1.1. Overview

            23.3.1.2. Product Portfolio

            23.3.1.3. Profitability by Market Segments

            23.3.1.4. Sales Footprint

            23.3.1.5. Strategy Overview

                23.3.1.5.1. Marketing Strategy

                23.3.1.5.2. Product Strategy

                23.3.1.5.3. Channel Strategy

        23.3.2. Novplasta

            23.3.2.1. Overview

            23.3.2.2. Product Portfolio

            23.3.2.3. Profitability by Market Segments

            23.3.2.4. Sales Footprint

            23.3.2.5. Strategy Overview

                23.3.2.5.1. Marketing Strategy

                23.3.2.5.2. Product Strategy

                23.3.2.5.3. Channel Strategy

        23.3.3. S.R.O, Extrapack Ltd.

            23.3.3.1. Overview

            23.3.3.2. Product Portfolio

            23.3.3.3. Profitability by Market Segments

            23.3.3.4. Sales Footprint

            23.3.3.5. Strategy Overview

                23.3.3.5.1. Marketing Strategy

                23.3.3.5.2. Product Strategy

                23.3.3.5.3. Channel Strategy

        23.3.4. Dagoplast AS

            23.3.4.1. Overview

            23.3.4.2. Product Portfolio

            23.3.4.3. Profitability by Market Segments

            23.3.4.4. Sales Footprint

            23.3.4.5. Strategy Overview

                23.3.4.5.1. Marketing Strategy

                23.3.4.5.2. Product Strategy

                23.3.4.5.3. Channel Strategy

        23.3.5. International Plastic, Inc.

            23.3.5.1. Overview

            23.3.5.2. Product Portfolio

            23.3.5.3. Profitability by Market Segments

            23.3.5.4. Sales Footprint

            23.3.5.5. Strategy Overview

                23.3.5.5.1. Marketing Strategy

                23.3.5.5.2. Product Strategy

                23.3.5.5.3. Channel Strategy

        23.3.6. MirPack TM

            23.3.6.1. Overview

            23.3.6.2. Product Portfolio

            23.3.6.3. Profitability by Market Segments

            23.3.6.4. Sales Footprint

            23.3.6.5. Strategy Overview

                23.3.6.5.1. Marketing Strategy

                23.3.6.5.2. Product Strategy

                23.3.6.5.3. Channel Strategy

        23.3.7. Pack-It BV

            23.3.7.1. Overview

            23.3.7.2. Product Portfolio

            23.3.7.3. Profitability by Market Segments

            23.3.7.4. Sales Footprint

            23.3.7.5. Strategy Overview

                23.3.7.5.1. Marketing Strategy

                23.3.7.5.2. Product Strategy

                23.3.7.5.3. Channel Strategy

        23.3.8. Achaika Plastic S.A

            23.3.8.1. Overview

            23.3.8.2. Product Portfolio

            23.3.8.3. Profitability by Market Segments

            23.3.8.4. Sales Footprint

            23.3.8.5. Strategy Overview

                23.3.8.5.1. Marketing Strategy

                23.3.8.5.2. Product Strategy

                23.3.8.5.3. Channel Strategy 

        23.3.9. Plasta. It

            23.3.9.1. Overview

            23.3.9.2. Product Portfolio

            23.3.9.3. Profitability by Market Segments

            23.3.9.4. Sales Footprint

            23.3.9.5. Strategy Overview

                23.3.9.5.1. Marketing Strategy

                23.3.9.5.2. Product Strategy

                23.3.9.5.3. Channel Strategy

        23.3.10. Primax D.o.o

            23.3.10.1. Overview

            23.3.10.2. Product Portfolio

            23.3.10.3. Profitability by Market Segments

            23.3.10.4. Sales Footprint

            23.3.10.5. Strategy Overview

                23.3.10.5.1. Marketing Strategy

                23.3.10.5.2. Product Strategy

                23.3.10.5.3. Channel Strategy

*The above list is indicative in nature and is subject to change during the course of research

24. Assumptions and Acronyms Used

25. Research Methodology

Don't pay for what you don't need

Customize your report by selecting specific countries or regions and save 30%!

List of Tables

Table 01: Global Market Value (US$ Million) by Material Type, 2016H-2031F,

Table 02: Global Market Volume (Million Units) by Material Type, 2016H-2031F

Table 03: Global Market Value (US$ Million) by Capacity Type, 2016H-2031F,

Table 04: Global Market Volume (Million Units) by Capacity Type, 2016H-2031F

Table 05: Global Market Value (US$ Million) by Sales Channel, 2016H-2031F,

Table 06: Global Market Volume (Million Units) by Sales Channel, 2016H-2031F

Table 07: Global Market Value (US$ Million) by End Use, 2016H-2031F,

Table 08: Global Market Volume (Million Units) by End Use, 2016H-2031F,

Table 09: Global Market Value (US$ Million) by Region, 2015H-2030F,

Table 10: Global Market Volume (Million Units) by Region, 2015H-2030F,

Table 11: North America Market Value (US$ Million) by Material Type, 2016H-2031F

Table 12: North America Market Volume (Million Units) by Material Type, 2016H-2031F

Table 13: North America Market Value (US$ Million) by Capacity Type, 2016H-2031F

Table 14: North America Market Volume (Million Units) by Capacity Type, 2016H-2031F

Table 15: North America Market Value (US$ Million) by Sales Channel, 2016H-2031F

Table 16: North America Market Volume (Million Units) by Sales Channel, 2016H-2031F

Table 17: North America Market Value (US$ Million) by End Use, 2016H-2031F

Table 18: North America Market Volume (Million Units) by End Use, 2016H-2031F

Table 19: North America Market Value (US$ Million) by Country, 2016H-2031F

Table 20: North America Market Volume (Million Units) by Country, 2016H-2031F

Table 21: Latin America Market Value (US$ Million) by Material Type, 2016H-2031F

Table 22: Latin America Market Volume (Million Units) by Material Type, 2016H-2031F

Table 23: Latin America Market Value (US$ Million) by Capacity Type, 2016H-2031F

Table 24: Latin America Market Volume (Million Units) by Capacity Type, 2016H-2031F

Table 25: Latin America Market Value (US$ Million) by Sales Channel, 2016H-2031F

Table 26: Latin America Market Volume (Million Units) by Sales Channel, 2016H-2031F

Table 27: Latin America Market Value (US$ Million) by End Use, 2016H-2031F

Table 28: Latin America Market Volume (Million Units) by End Use, 2016H-2031F

Table 29: Latin America Market Value (US$ Million) by Country, 2016H-2031F

Table 30: Latin America Market Volume (Million Units) by Country, 2016H-2031F

Table 31: Europe Market Value (US$ Million) by Material Type, 2016H-2031F,

Table 32: Europe Market Volume (Million Units) by Material Type, 2016H-2031F

Table 33: Europe Market Value (US$ Million) by Capacity Type, 2016H-2031F,

Table 34: Europe Market Volume (Million Units) by Capacity Type, 2016H-2031F

Table 35: Europe Market Value (US$ Million) by Sales Channel, 2016H-2031F,

Table 36: Europe Market Volume (Million Units) by Sales Channel, 2016H-2031F

Table 37: Europe Market Value (US$ Million) by End Use, 2016H-2031F,

Table 38: Europe Market Volume ( Million Units) by End Use, 2016H-2031F,

Table 39: Europe Market Value (US$ Million) by Country, 2016H-2031F,

Table 40: Europe Market Volume (Million Units) by Country, 2016H-2031F,

Table 41: MEA Market Value (US$ Million) by Material, 2016H-2031F,

Table 42: MEA Market Volume (Million Units) by Material, 2016H-2031F

Table 43: MEA Market Value (US$ Million) by Capacity, 2016H-2031F,

Table 44: MEA Market Volume (Million Units) by Capacity, 2016H-2031F

Table 45: MEA Market Value (US$ Million) by Sales Channel, 2016H-2031F,

Table 46: MEA Market Volume (Million Units) by Sales Channel, 2016H-2031F

Table 47: MEA Market Value (US$ Million) by End Use, 2016H-2031F,

Table 48: MEA Market Volume (Million Units) by End Use, 2016H-2031F,

Table 49: MEA Market Value (US$ Million) by Country, 2016H-2031F,

Table 50: MEA Market Volume (Million Units) by Country, 2016H-2031F,

Table 51: East Asia Market Value (US$ Million) by Material Type, 2015H-2031F,

Table 52: East Asia Market Volume (Million Units) by Material Type, 2015H-2031F

Table 53: East Asia Market Value (US$ Million) by Capacity Type, 2015H-2031F,

Table 54: East Asia Market Volume (Million Units) by Capacity Type, 2015H-2031F

Table 55: East Asia Market Value (US$ Million) by Sales Channel, 2015H-2031F,

Table 56: East Asia Market Volume (Million Units) by Sales Channel, 2015H-2031F

Table 57: East Asia Market Value (US$ Million) by End Use, 2015H-2031F,

Table 58: East Asia Garbage Market Volume (Million Units) by End Use, 2015H-2031F,

Table 59: East Asia Market Value (US$ Million) by Country, 2015H-2031F,

Table 60: East Asia Market Volume (Million Units) by Country, 2015H-2031F

Table 61: South Asia Market Value (US$ Million) by Material Type, 2015H-2031F,

Table 62: South Asia Market Volume (Million Units) by Material Type, 2015H-2031F

Table 63: South Asia Market Value (US$ Million) by Capacity Type, 2015H-2031F,

Table 64: South Asia Market Volume (Million Units) by Capacity Type, 2015H-2031F

Table 65: South Asia Market Value (US$ Million) by Sales Channel, 2015H-2031F,

Table 66: South Asia Market Volume (Million Units) by Sales Channel, 2015H-2031F

Table 67: South Asia Market Value (US$ Million) by End Use, 2015H-2031F,

Table 68: South Asia Garbage Market Volume (Million Units) by End Use, 2015H-2031F,

Table 69: South Asia Market Value (US$ Million) by Country, 2015H-2031F,

Table 70: South Asia Market Volume (Million Units) by Country, 2015H-2031F

Table 71: Oceania Market Value (US$ Million) by Material Type, 2015H-2031F,

Table 72: Oceania Market Volume (Million Units) by Material Type, 2015H-2031F

Table 73: Oceania Market Value (US$ Million) by Capacity Type, 2015H-2031F,

Table 74: Oceania Market Volume (Million Units) by Capacity Type, 2015H-2031F

Table 75: Oceania Market Value (US$ Million) by Sales Channel, 2015H-2031F,

Table 76: Oceania Market Volume (Million Units) by Sales Channel, 2015H-2031F

Table 77: Oceania Market Value (US$ Million) by End Use, 2015H-2031F,

Table 78: Oceania Garbage Market Volume (Million Units) by End Use, 2015H-2031F,

Table 79: Oceania Market Value (US$ Million) by Country, 2015H-2031F,

Table 80: Oceania Market Volume (Million Units) by Country, 2015H-2031F
Ismail Sutaria
Ismail Sutaria

Principal Consultant

Talk to Analyst

Find your sweet spots for generating winning opportunities in this market.

List of Charts

Figure 01: Global Market Share Analysis by Material Type, 2022E & 2031F

Figure 02: Global Market Y-o-Y Analysis by Material Type, 2020A-2031F

Figure 03: Global Market Attractiveness Analysis by Material Type, 2022E-2031F

Figure 04: Global Market Share Analysis by Capacity Type, 2022E & 2031F

Figure 05: Global Market Y-o-Y Analysis by Capacity Type, 2020A-2031F

Figure 06: Global Market Attractiveness Analysis by Capacity Type, 2022E-2031F

Figure 07: Global Market Share Analysis by Sales Channel, 2022E & 2031F

Figure 08: Global Market Y-o-Y Analysis by Sales Channel, 2020A-2031F

Figure 09: Global Market Attractiveness Analysis by Sales Channel, 2022E-2031F

Figure 10: Global Market Share Analysis by End Use, 2022E & 2031F

Figure 11: Global Market Y-o-Y Analysis by End Use, 2020A-2031F

Figure 12: Global Market Attractiveness Analysis by End Use, 2022E-2031F

Figure 13: Global Market Share Analysis by Region, 2020E & 2030F

Figure 14: Global Market Attractiveness Analysis by Region, 2020E-2030F

Figure 15: North America Market Share Analysis by Material Type, 2022E & 2031F

 Figure 16: North America Market Y-o-Y Analysis by Material Type, 2020A-2031F

Figure 17: North America Market Attractiveness Analysis by Material Type, 2022E-2031F

Figure 18: North America Market Share Analysis by Capacity Type, 2022E & 2031F

Figure 19: North America Market Y-o-Y Analysis by Capacity Type, 2020A-2031F

Figure 20: North America Market Attractiveness Analysis by Capacity Type, 2022E-2031F

Figure 21: North America Market Share Analysis by Sales Channel, 2022E & 2031F

Figure 22: North America Market Y-o-Y Analysis by Sales Channel, 2020A-2031F

Figure 23: North America Market Attractiveness Analysis by Sales Channel, 2022E-2031F

Figure 24: North America Market Share Analysis by End Use, 2022E & 2031F

Figure 25: North America Market Y-o-Y Analysis by End Use, 2020A-2031F

Figure 26: North America Market Attractiveness Analysis by End Use, 2022E-2031F

Figure 27: North America Market Share Analysis by Country, 2022E & 2031F

Figure 28: North America Market Attractiveness Analysis by Country, 2022E-2031F

Figure 29: Latin America Market Share Analysis by Material Type, 2022E & 2031F

 Figure 30: Latin America Market Y-o-Y Analysis by Material Type, 2020A-2031F

Figure 31: Latin America Market Attractiveness Analysis by Material Type, 2022E-2031F

Figure 32: Latin America Market Share Analysis by Capacity Type, 2022E & 2031F

Figure 33: Latin America Market Y-o-Y Analysis by Capacity Type, 2020A-2031F

Figure 34: Latin America Market Attractiveness Analysis by Capacity Type, 2022E-2031F

Figure 35: Latin America Market Share Analysis by Sales Channel, 2022E & 2031F

Figure 36: Latin America Market Y-o-Y Analysis by Sales Channel, 2020A-2031F

Figure 37: Latin America Market Attractiveness Analysis by Sales Channel, 2022E-2031F

Figure 38: Latin America Market Share Analysis by End Use, 2022E & 2031F

Figure 39: Latin America Market Y-o-Y Analysis by End Use, 2020A-2031F

Figure 40: Latin America Market Attractiveness Analysis by End Use, 2022E-2031F

Figure 41: Latin America Market Share Analysis by Country, 2022E & 2031F

Figure 42: Latin America Market Attractiveness Analysis by Country, 2022E-2031F

Figure 43: Europe Market Share Analysis by Material Type, 2022E & 2031F

Figure 44: Europe Market Y-o-Y Analysis by Material Type, 2020A-2031F

Figure 45: Europe Market Attractiveness Analysis by Material Type, 2020E-2031F

Figure 46: Europe Market Share Analysis by Capacity Type, 2020E & 2030F

Figure 47: Europe Market Y-o-Y Analysis by Capacity Type, 2020A-2031F

Figure 48: Europe Market Attractiveness Analysis by CapacityType, 2022E-2031F

Figure 49: Europe Market Share Analysis by Sales Channel, 2022E & 2031F

Figure 50: Europe Market Y-o-Y Analysis by Sales Channel, 2020A-2031F

Figure 51: Europe Market Attractiveness Analysis by Sales Channel, 2022E-2031F

Figure 52: Europe Market Share Analysis by End Use, 2022E & 2031F

Figure 53: Europe Market Y-o-Y Analysis by End Use, 2020A-2031F

Figure 54: Europe Market Attractiveness Analysis by End Use, 2022E-2031F

Figure 55: Europe Market Share Analysis by Country, 2022E & 2031F

Figure 56: Europe Market Attractiveness Analysis by Country, 2022E-2031F

Figure 57: MEA Market Share Analysis by Material, 2022E & 2031F

Figure 58: MEA Market Y-o-Y Analysis by Material, 2020A-2031F

Figure 59: MEA Market Attractiveness Analysis by Material, 2022E-2031F

Figure 60: MEA Market Share Analysis by Capacity, 2022E & 2031F

Figure 61: MEA Market Y-o-Y Analysis by Capacity, 2020A-2031F

Figure 62: MEA Market Attractiveness Analysis by Capacity, 2022E-2031F

Figure 63: MEA Market Share Analysis by Sales Channel, 2022E & 2031F

Figure 64: MEA Market Y-o-Y Analysis by Sales Channel, 2020A-2031F

Figure 65: MEA Market Attractiveness Analysis by Sales Channel, 2022E-2031F

Figure 66: MEA Market Share Analysis by End Use, 2022E & 2031F

Figure 67: MEA Market Y-o-Y Analysis by End Use, 2020A-2031F

Figure 68: MEA Market Attractiveness Analysis by End Use, 2022E-2031F

Figure 69: MEA Market Share Analysis by Country, 2020E & 2030F

Figure 70: MEA Market Attractiveness Analysis by Country, 2020E-2030F

Figure 71: East Asia Market Share Analysis by Material Type, 2022E & 2031F

Figure 72: East Asia Market Y-o-Y Analysis by Material Type, 2021A-2031F

Figure 73: East Asia Market Attractiveness Analysis by Material Type, 2022E-2031F

Figure 74: East Asia Market Share Analysis by Capacity Type, 2022E & 2031F

Figure 75: East Asia Market Y-o-Y Analysis by Capacity Type, 2021A-2031F

Figure 76: East Asia Market Attractiveness Analysis by Capacity Type, 2022E-2031F

Figure 77: East Asia Market Share Analysis by Sales Channel, 2022E & 2031F

Figure 78: East Asia Market Y-o-Y Analysis by Sales Channel, 2021A-2031F

Figure 79: East Asia Market Attractiveness Analysis by Sales Channel, 2022E-2031F

Figure 80: East Asia Market Share Analysis by End Use, 2022E & 2031F

Figure 81: East Asia Market Y-o-Y Analysis by End Use, 2021A-2031F

Figure 82: East Asia Market Attractiveness Analysis by End Use, 2022E-2031F

Figure 83: East Asia Market Share Analysis by Country, 2022E & 2031F

Figure 84: East Asia Market Attractiveness Analysis by Country, 2022E-2031F

Figure 85: South Asia Market Share Analysis by Material Type, 2022E & 2031F

Figure 86: South Asia Market Y-o-Y Analysis by Material Type, 2021A-2031F

Figure 87: South Asia Market Attractiveness Analysis by Material Type, 2022E-2031F

Figure 88: South Asia Market Share Analysis by Capacity Type, 2022E & 2031F

Figure 89: South Asia Market Y-o-Y Analysis by Capacity Type, 2021A-2031F

Figure 90: South Asia Market Attractiveness Analysis by Capacity Type, 2022E-2031F

Figure 91: South Asia Market Share Analysis by Sales Channel, 2022E & 2031F

Figure 92: South Asia Market Y-o-Y Analysis by Sales Channel, 2021A-2031F

Figure 93: South Asia Market Attractiveness Analysis by Sales Channel, 2022E-2031F

Figure 94: South Asia Market Share Analysis by End Use, 2022E & 2031F

Figure 95: South Asia Market Y-o-Y Analysis by End Use, 2021A-2031F

Figure 96: South Asia Market Attractiveness Analysis by End Use, 2022E-2031F

Figure 97: South Asia Market Share Analysis by Country, 2022E & 2031F

Figure 98: South Asia Market Attractiveness Analysis by Country, 2022E-2031F

Figure 99: Oceania Market Share Analysis by Material Type, 2022E & 2031F

Figure 100: Oceania Market Y-o-Y Analysis by Material Type, 2021A-2031F

Figure 101: Oceania Market Attractiveness Analysis by Material Type, 2022E-2031F

Figure 102: Oceania Market Share Analysis by Capacity Type, 2022E & 2031F

Figure 103: Oceania Market Y-o-Y Analysis by Capacity Type, 2021A-2031F

Figure 104: Oceania Market Attractiveness Analysis by Capacity Type, 2022E-2031F

Figure 105: Oceania Market Share Analysis by Sales Channel, 2022E & 2031F

Figure 106: Oceania Market Y-o-Y Analysis by Sales Channel, 2021A-2031F

Figure 107: Oceania Market Attractiveness Analysis by Sales Channel, 2022E-2031F

Figure 108: Oceania Market Share Analysis by End Use, 2022E & 2031F

Figure 109: Oceania Market Y-o-Y Analysis by End Use, 2021A-2031F

Figure 110: Oceania Market Attractiveness Analysis by End Use, 2022E-2031F

Figure 111: Oceania Market Share Analysis by Country, 2022E & 2031F

Figure 112: Oceania Market Attractiveness Analysis by Country, 2022E-2031F

Recommendations

Industrial Automation

Trash Rack Cleaning Machine Market

Published : June 2023

Packaging

Trash Can Liners Market

Published : July 2022

Packaging

Scented Trash Bags Market

Published : May 2022

Explore Packaging Insights

View Reports