Jumbo Bags Market Size and Share Forecast Outlook 2025 to 2035

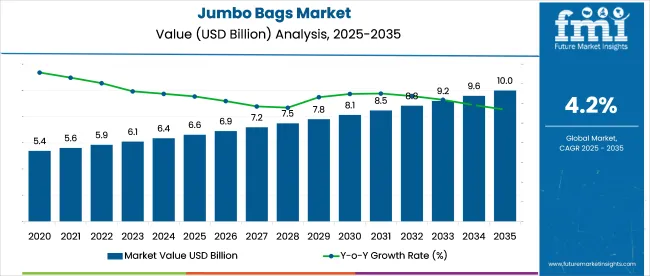
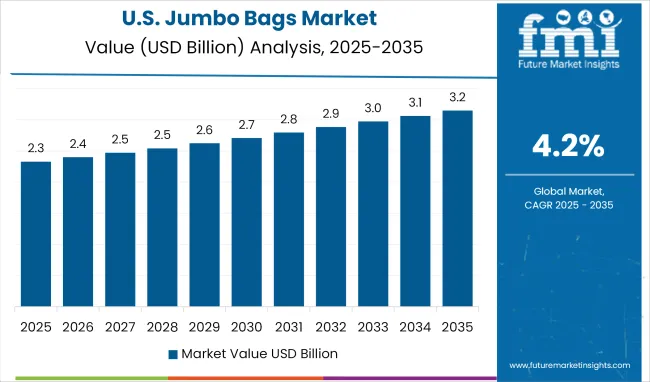
The global jumbo bags market is anticipated to rise from USD 6.6 billion in 2025 to USD 10 billion by 2035, reflecting a steady CAGR of 4.2%. This upward trajectory is largely attributed to the growing need for resilient, high-capacity packaging in sectors such as agriculture, chemicals, and construction.

Quick Stats of Jumbo Bags Market

  • Market Value (2025): USD 6.6 Billion
  • Forecast Value (2035): USD 10 Billion
  • Forecast CAGR: 4.2% (2025 to 2035)
  • Product Leader in 2025: Type C Jumbo Bags (Electrostatic Discharge Protection)
  • Top Distribution Channel: Direct-to-End-User (via B2B Industrial Supply Contracts)
  • Key Growth Region: Asia-Pacific (with India and China as primary growth hubs)
  • Leading Player: Greif Inc.

Jumbo Bags Market

Attribute Detail
Market Size (2025) USD 6.6 billion
Market Size (2035) USD 10 billion
CAGR (2025 to 2035) 4.2%

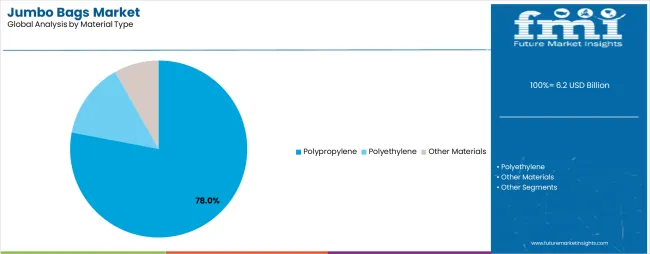
Flexible Intermediate Bulk Containers (FIBCs), capable of carrying loads between 500 and 2,000 kilograms, are widely adopted for their cost efficiency in transportation and optimal use of storage space. Market growth is further supported by increasing demand for antistatic variants (Types C and D) in hazardous environments, along with advancements in liners offering UV resistance and barriers against moisture and oxygen.

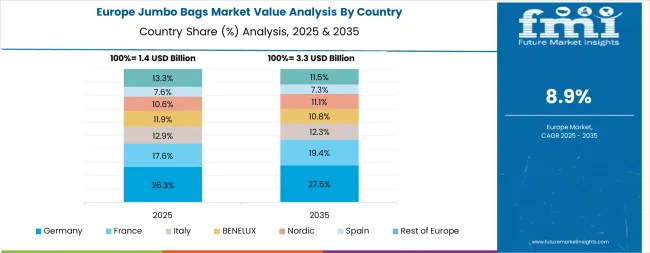
The Asia-Pacific region remains at the forefront due to its robust industrial base and strong agri-export volumes, while Europe and North America continue to shift toward reusable bulk packaging solutions to streamline logistics and reduce warehousing overheads.

The market accounts for varying shares across its parent markets, averaging between 3% and 12% depending on sector-specific integration and material handling intensity. Within the packaging industry, it contributes approximately 6%, largely confined to industrial and bulk-use applications. In the logistics and supply chain sector, its share is under 5%, as it caters to a specific niche in dry bulk transport. In the bulk material handling equipment market, jumbo bags represent around 10-12% of consumables linked to filling, unloading, and intermediate storage.

Their use in the industrial chemicals sector holds a stronger share of 8-10%, due to stringent transport requirements. In agriculture packaging, the market accounts for nearly 7%, particularly in large-volume seed, grain, and fertilizer exports.

In a June 2024 interview with Packaging Europe, Rajiv Agarwal, CEO of Bulkpack Exports Ltd., highlighted the accelerating shift toward sustainable bulk packaging. He pointed out that clients increasingly demand reusability, efficient shipping formats, and adherence to international safety standards factors that reinforce the dominance in bulk logistics.

This executive perspective reflects the evolving role of flexible intermediate bulk containers (FIBCs) in a global supply chain defined by cost optimization, automation, and regulatory compliance. As innovations in bag design continue and cross-border bulk transport expands, the market is expected to maintain steady global adoption through 2035.

Analyzing Jumbo Bags Market by Top Investment Segments

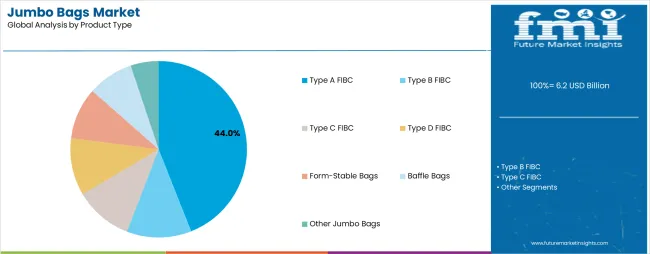
The industry in 2025 is defined by precision-driven demand across anti-static packaging, volume-optimized container logistics, and space-efficiency applications. Key investment is concentrated in Type C bags (34.0%), 750-1500 kg load variants (41.0%), and baffle-structured designs (29.0%), with highest traction seen in chemical exports, fertilizer logistics, and solid bulk handling.

Static-Control Packaging Spurs Demand for Type C Bags in 2025

Jumbo Bags Market Analysis By Bag Type

Holding 34.0% of the market in 2025, Type C bags dominate where electrostatic safety is mandatory. Usage has grown alongside explosive dust regulations under NFPA 654 and IEC 61340. Countries with high flammable powder exports-including Japan, South Korea, and EU nations-are key adopters.

Greif Inc. and LC Packaging report >70% of their conductive bag sales go to chemical exporters. Stringent factory floor regulations across the EU have also accelerated demand for grounded FIBCs across plastic resin and additive manufacturers.

  • Japan’s flammable powder exports reached 1.9 million tons in 2024-83% packed in conductive FIBCs
  • South Korea mandates grounded FIBC use in 100% of lithium carbonate exports since Q3 2023
  • 68% of new bag certifications under EU's ATEX directive in 2024 were for Type C FIBCs

Mid-Weight Load Efficiency Drives 750-1500 kg Segment in 2025

Jumbo Bags Market Analysis By Capacity Range

With 41.0% market share in 2025, this capacity segment serves as the bulk packaging default for global container shipments. Exporters in India, Turkey, and Argentina use these bags to align with ISO container payload limits.

Berry Global and Bulk-Pack have increased production of 1000 kg variants by 22% YoY to meet container-fit formats. Adoption is driven by lower cost-per-ton metrics, with 750-1500 kg bags now used in 84% of containerized solid bulk exports in India.

  • Indian exporters use 1000 kg FIBCs in 92% of bulk packaging for rice, maize, and polymer resin
  • Turkish chromium exporters report 17.4% freight cost savings per shipment using 1200 kg bags
  • 84% of Argentina’s processed soy exports in 2024 utilized bags in the 750-1500 kg range

Baffle Bags Win Market Share Through Cubic Efficiency in 2025

Jumbo Bags Market Analysis By Design Type

Baffle bag designs, with 29.0% share, are being widely adopted in containerized trade due to enhanced stack ability and shape retention. Food grains, cement, and salt are now predominantly shipped using form-stable FIBCs in Vietnam, Brazil, and South Africa. Taihua Group and FormPak report a 19% YoY rise in baffle bag orders. Transporters cite lower volumetric waste and faster loading cycles as key ROI drivers. Baffle bags now account for 66% of container-compatible FIBC exports from Brazil.

  • South African exporters reduced cubic container waste by 24.6% by switching to baffle-integrated formats
  • 71% of Vietnamese rice exports in 2024 used baffle bags for better port-level stacking
  • Brazil’s port terminals recorded a 13% increase in container throughput due to form-stable bag usage

Reactive Bulk Handling Secures Chemicals & Fertilizers Segment in 2025

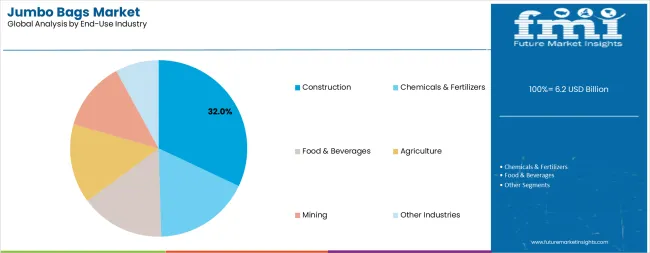
The chemicals & fertilizers secures the 33.0% off end use segment of jumbo bag consumption in 2025. Reactive material exporters in India, China, and North Africa rely on moisture- and corrosion-resistant FIBCs. Intertape Polymer Group, Emmbi Industries, and Plastene India report that 58% of their industrial-grade bags are now tailored for chemical payloads. Demand aligns with rising production volumes: India alone added 9.1 million metric tons of urea output in 2024, 89% of which is bagged in jumbo FIBCs.

  • China’s ammonium nitrate sector uses over 14 million FIBCs/year-up 11.7% from 2023
  • Indian fertilizer distributors now require UN-certified jumbo bags for 95% of all shipments
  • North African exporters saw 19.3% fewer cargo losses in 2024 due to liner-integrated FIBCs

Top Jumbo Bags Market Dynamics

Operational streamlining across bulk packaging networks has driven changes in jumbo bag design, material sourcing, and logistics integration. Polymer cost instability, customization mandates, and traceability norms are shaping purchasing behavior. Demand from agro-exports, chemicals, and construction sectors is prompting reconfiguration of capacity planning, labeling practices, and freight consolidation strategies.

Load Cycle Compression and Handling Rate Enhancement

Exporters in Southeast Asia have shortened load-to-dispatch times by 19% in H1 2025 through adoption of cross-corner loop FIBCs optimized for higher stackability and forklift access. Indonesia-based aggregators moved to 1.1-ton variants, cutting material handling per container from 3.4 to 2.6 hours. Vietnam’s port authorities reported a 12% improvement in loadout efficiency after integration of discharge-spout bags with structural baffles.

In Ethiopia, agro-processors reduced repackaging incidents by 15% after semi-automated fill-and-seal retrofits. These adjustments have reduced storage bottlenecks and aligned outbound scheduling with vessel turnaround, lowering detention fee exposure in key coastal trade corridors.

RFID Integration Accelerates Under Traceability Compliance

Embedded digital tags in jumbo bags saw a 3.6× rise in usage for EU-bound cargo in Q2 2025. Spice exporters in India deployed blockchain-verified QR labels to meet buyer authentication protocols in the Netherlands and Germany.

Kenya’s fresh produce exporters documented a 28% decline in consignment rejections by implementing serialized track-and-trace systems. Three of Turkey’s seven largest fertilizer producers have now mandated end-to-end traceable bag formats. Adoption of digitally verifiable bags is gaining traction among regulated verticals including pharmaceuticals, chemicals, and food ingredients, with packaging vendors expanding tagged product lines to secure forward contracts from compliance-focused buyers.

Cost Pressures from Resin Volatility and SKU Fragmentation

Between January and June 2025, polypropylene resin prices climbed 11% YoY, tightening margins for FIBC converters across Pakistan and Bangladesh. Customization demand-especially anti-static liners and pharma-grade bags-has raised per-unit production costs by 6-9%. Brazil’s soy exporters cited a $3.10 per-ton packaging cost hike due to modified liner specifications.

Downstream pushback on price adjustments led to order volume reductions and procurement switches to alternative pack formats. Suppliers responded by narrowing SKU offerings, integrating semi-automated liner insertion, and renegotiating logistics contracts to counter upstream volatility and downstream margin compression across food, mineral, and chemical export chains.

Top Countries Producing, Exporting, and Driving Consumption in the Jumbo Bags Market

Country Wise Analysis Of Jumbo Bags Market

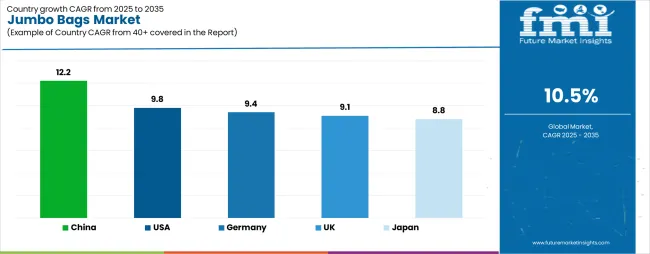
The report covers detailed analysis of 40+ countries, with the top five countries shared as a reference.

Countries CAGR (2025 to 2035)
India 5.3%
China 5.1%
United States 3.1%
Canada 2.9%
Germany 2.7%

Global demand is forecast to grow at a 4.2% CAGR between 2025 and 2035. India leads the profiled countries with a 5.3% growth rate, delivering a +26% premium over the global baseline. China follows closely at 5.1% (+21%), supported by robust exports and domestic bulk packaging requirements.

The United States posts a more modest 3.1% (-26%), while Canada (2.9%) and Germany (2.7%) record a -31% and -36% gap, respectively. The divergence highlights the faster scale-up of industrial packaging infrastructure in BRICS nations, while OECD countries reflect demand saturation and tighter packaging regulations

Analysis of Jumbo Bags Market in India

The jumbo bags market in India is forecast to register a CAGR of 5.3% between 2025 and 2035, led by rapid expansion in bulk commodity transport and agricultural exports. Increased adoption by fertilizer, cement, and food grain sectors is driving volume demand for 1-ton and 2-ton FIBCs.

Domestic manufacturers are scaling laminated, dust-proof bags for weather-sensitive payloads. The automation in bag stitching and UV stabilization standards have become procurement benchmarks across port-based logistics hubs.

  • Over 60% of bulk agro exports now utilize Type B and C FIBCs.
  • Local suppliers have reported a rise in demand for loop-reinforced and conductive bags for chemical packaging.
  • Tier-1 ports like Mundra and Kandla are emerging as core distribution points for reusable jumbo bag logistics.

Demand Forecast for Jumbo Bags Market in China

The market in China is projected to grow at a CAGR of 5.1% through 2035, backed by expanding intermodal freight and domestic infrastructure projects. Demand is being shaped by large-scale usage in minerals, industrial salt, and petrochemical transport.

Manufacturers are enhancing melt-blown polypropylene quality to meet internal stackability standards. Export-oriented sectors are shifting toward FIBCs compliant with ISO 21898 and REACH certifications, especially for EU and ASEAN shipments.

  • Over 80% of new FIBC production units are located in Shandong and Jiangsu provinces.
  • China's adoption of anti-static jumbo bags has increased by 30% over the last 5 years.
  • Government incentives on recyclable industrial packaging are pushing R&D in biodegradable liner bags.

Growth Analysis of Jumbo Bags Market in the United States

The United States is expected to see a CAGR of 3.1% between 2025 and 2035, supported by demand across agriculture, construction aggregates, and food processing sectors. The move toward automation-ready bulk packaging has created demand for RFID-embedded and pallet-stable jumbo bags.

Environmental guidelines on plastic traceability have led major users to transition toward batch-coded, multi-trip bags. The logistics platforms are integrating load-monitoring sensors for shipment traceability in high-volume lanes.

  • Over 40% of agricultural cooperatives are deploying certified food-grade FIBCs.
  • Type D FIBCs are gaining ground in hazardous goods transport under updated DOT protocols.
  • Customized discharge spouts and baffle construction now account for over 25% of domestic procurement.

Future Outlook for Jumbo Bags Market in Canada

The jumbo bags market in Canada is forecast to expand at a CAGR of 2.9% from 2025 to 2035, led by mining exports and agri-food bulk shipping. Firms are investing in cold-weather-resistant FIBCs suitable for sub-zero loading conditions in provinces like Alberta and Manitoba.

Growing reliance on rail and container shipping has increased demand for moisture-proof, tunnel-lift bags. Exporters in the wheat and potash sectors are transitioning to coated FIBCs to enhance product integrity in long-haul transport.

  • Conductive bags rated for Class II environments are being adopted in chemical logistics.
  • Over 35% of jumbo bags used in Quebec and Ontario now include tamper-proof liner systems.
  • Regulatory focus on circular packaging has resulted in wider adoption of recyclable PE-coated FIBCs.

Jumbo Bags Market Growth Outlook in Germany

The industry is expected to grow at a CAGR of 2.7% through 2035, driven by precision-packaging needs in specialty chemicals, food additives, and polymer granules. As EU mandates tighten on waste traceability and packaging compliance, manufacturers are investing in FIBCs with EN 13427 certification and barcode tracking integration. Growth is being further supported by the logistics requirements of Germany’s mid-sized industrial exporters.

  • Anti-leak stitched seam technology is increasingly mandated in food-grade bag specifications.
  • Over 50% of FIBCs used in the chemical sector now comply with UN Dangerous Goods Packaging codes.
  • Regional recycling cooperatives are driving take-back programs for used jumbo bags, increasing reuse cycles.

Leading Jumbo Bags Manufacturers, Suppliers, Distributors

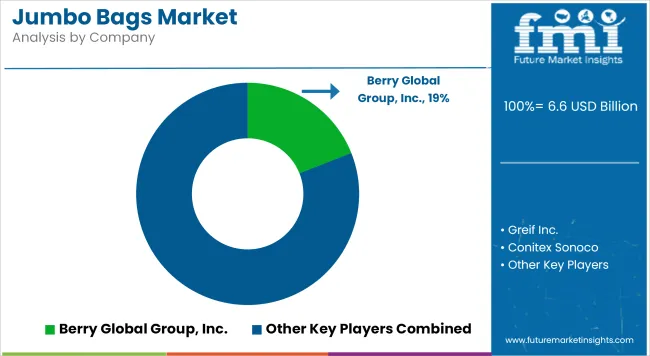
Jumbo Bags Market Analysis By Company

Leading Player - Berry Global Group, Inc. holding 19% industry share

The jumbo bags market is characterized by high entry barriers due to capital-intensive manufacturing, compliance with international bulk handling standards, and long-standing buyer-supplier contracts. Established players such as Berry Global Group, Inc., Greif Inc., and LC Packaging International BV leverage global distribution networks and product standardization to maintain competitive advantage. Greif’s expansion into sector-specific applications and Berry Global’s capacity ramp-up for food-grade bags reflect demand-driven strategies targeting volume reliability.

Emerging players like Emmbi Industries Ltd. and PT. WIHARTA KARYA AGUNG are narrowing the gap through cost-focused manufacturing and material optimization. Emmbi’s deployment of region-specific variants has accelerated its export share. R&D-led customization, like Conitex Sonoco’s breathable bags, underscores the role of product adaptability in overcoming price-driven competition.

Recent Industry News

  • In May 2025, a Chinese utility model patent (CN222906485U) was awarded for a jumbo bag with integrated upper and lower crane hooks, allowing vertical lifting and discharge without damage to the bag during unloading.
  • India’s A and M Jumbo Bags Limited reported fullyear results as of March 31, 2025: revenues surged to INR 229 million (from INR 34 million a year prior), and the company swung from a loss to a net income of INR 1.68 million.

Leading Players

  • Berry Global Group, Inc.
  • Greif Inc.
  • Conitex Sonoco
  • AmeriGlobe L.L.C.
  • PT. WIHARTA KARYA AGUNG
  • BAG Corp.
  • Halsted Corporation
  • Intertape Polymer Group
  • Emmbi Industries Ltd.
  • LC Packaging International BV

Report scope Table

Report Attributes Details
Market Size (2025) USD 6.6 billion
Projected Market Size (2035) USD 10 billion
CAGR (2025 to 2035) 4.2%
Base Year for Estimation 2024
Historical Period 2020 to 2024
Projection Period 2025 to 2035
Quantitative Units USD billion for value, million units for volume
Bag Types Analyzed (Segment 1) Type A, Type B, Type C, Type D
Capacity Segments Analyzed (Segment 2) Less than 200 kg, 200 kg to 750 kg, 750 kg to 1500 kg, Above 1500 kg
Design Variants Covered (Segment 3) U-panel bags, Four-side panel bags, Baffle bags, Circular/Tabular bags, Cross-corner bags
End-Use Industries Studied (Segment 4) Building & Construction, Chemicals & Fertilizers, Food Products & Agriculture, Pharmaceuticals
Regions Covered North America, Latin America, East Asia, South Asia & Pacific, Western Europe, Eastern Europe, MEA
Countries Tracked United States, Canada, Germany, France, Italy, China, India, Japan, South Korea, Brazil, Mexico
Key Players Berry Global Group, Inc.; Greif Inc.; Conitex Sonoco; AmeriGlobe L.L.C.; PT. WIHARTA KARYA AGUNG; BAG Corp.; Halsted Corporation; Intertape Polymer Group; Emmbi Industries Ltd.; LC Packaging International BV
Additional Attributes Dollar sales, share by bag type and end-use, rising demand from chemicals and agriculture sectors, increased preference for baffle and U-panel designs, regional manufacturing shifts toward South Asia & Pacific and Eastern Europe, export-driven growth in fertilizer and food product packaging segments

Key Segments

By Bag Type:

  • Type A
  • Type B
  • Type C
  • Type D

By Capacity:

  • Less than 200 kg
  • 200 kg to 750 kg
  • 750 kg to 1500 kg
  • Above 1500 kg

By Design:

  • U-panel bags
  • Four-side panel bags
  • Baffle bags
  • Circular/Tabular bags
  • Cross-corner bags

By End Use:

  • Building & Construction
  • Chemicals & Fertilizers
  • Food Products & Agriculture
  • Pharmaceuticals

By Region:

  • North America
  • Latin America
  • East Asia
  • South Asia & Pacific
  • Western Europe
  • Eastern Europe
  • Middle East & Africa

Table of Content

  1. Executive Summary
    • Global Market Outlook
    • Demand-side Trends
    • Supply-side Trends
    • Technology Roadmap Analysis
    • Analysis and Recommendations
  2. Market Overview
    • Market Coverage/Taxonomy
    • Market Definition/Scope/Limitations
  3. Market Background
    • Market Dynamics
      • Drivers
      • Restraints
      • Opportunity
      • Trends
    • Scenario Forecast
      • Demand in Optimistic Scenario
      • Demand in Likely Scenario
      • Demand in Conservative Scenario
    • Opportunity Map Analysis
    • Product Life Cycle Analysis
    • Supply Chain Analysis
      • Supply Side Participants and their Roles
        • Producers
        • Mid-Level Participants (Traders/ Agents/ Brokers)
        • Wholesalers and Distributors
      • Value Added and Value Created at Node in the Supply Chain
      • List of Raw Material Suppliers
      • List of Existing and Potential Buyer’s
    • Investment Feasibility Matrix
    • Value Chain Analysis
      • Profit Margin Analysis
      • Wholesalers and Distributors
      • Retailers
    • PESTLE and Porter’s Analysis
    • Regulatory Landscape
      • By Key Regions
      • By Key Countries
    • Regional Parent Market Outlook
    • Production and Consumption Statistics
    • Import and Export Statistics
  4. Global Market Analysis 2020 to 2024 and Forecast, 2025 to 2035
    • Historical Market Size Value (USD Billion) & Volume (K Units) Analysis, 2020 to 2024
    • Current and Future Market Size Value (USD Billion) & Volume (K Units) Projections, 2025 to 2035
      • Y-o-Y Growth Trend Analysis
      • Absolute $ Opportunity Analysis
  5. Global Market Pricing Analysis 2020 to 2024 and Forecast 2025 to 2035
  6. Global Market Analysis 2020 to 2024 and Forecast 2025 to 2035, By Bag Type
    • Introduction/Key Findings
    • Historical Market Size Value (USD Billion) & Volume (K Units) Analysis By Bag Type, 2020 to 2024
    • Current and Future Market Size Value (USD Billion) & Volume (K Units) Analysis and Forecast By Bag Type, 2025 to 2035
      • Type A
      • Type B
      • Type C
      • Type D
    • Y-o-Y Growth Trend Analysis By Bag Type, 2020 to 2024
    • Absolute $ Opportunity Analysis By Bag Type, 2025 to 2035
  7. Global Market Analysis 2020 to 2024 and Forecast 2025 to 2035, By Capacity
    • Introduction/Key Findings
    • Historical Market Size Value (USD Billion) & Volume (K Units) Analysis By Capacity, 2020 to 2024
    • Current and Future Market Size Value (USD Billion) & Volume (K Units) Analysis and Forecast By Capacity, 2025 to 2035
      • Less than 200 kg
      • 200 kg to 750 kg
      • 750 kg to 1500 kg
      • Above 1500 kg
    • Y-o-Y Growth Trend Analysis By Capacity, 2020 to 2024
    • Absolute $ Opportunity Analysis By Capacity, 2025 to 2035
  8. Global Market Analysis 2020 to 2024 and Forecast 2025 to 2035, By Design
    • Introduction/Key Findings
    • Historical Market Size Value (USD Billion) & Volume (K Units) Analysis By Design, 2020 to 2024
    • Current and Future Market Size Value (USD Billion) & Volume (K Units) Analysis and Forecast By Design, 2025 to 2035
      • U-panel bags
      • Four-side panel bags
      • Baffle bags
      • Circular/Tabular bags
      • Cross-corner bags
    • Y-o-Y Growth Trend Analysis By Design, 2020 to 2024
    • Absolute $ Opportunity Analysis By Design, 2025 to 2035
  9. Global Market Analysis 2020 to 2024 and Forecast 2025 to 2035, By End Use
    • Introduction/Key Findings
    • Historical Market Size Value (USD Billion) & Volume (K Units) Analysis By End Use, 2020 to 2024
    • Current and Future Market Size Value (USD Billion) & Volume (K Units) Analysis and Forecast By End Use, 2025 to 2035
      • Building & Construction
      • Chemicals & Fertilizers
      • Food Products & Agriculture
      • Pharmaceuticals
    • Y-o-Y Growth Trend Analysis By End Use, 2020 to 2024
    • Absolute $ Opportunity Analysis By End Use, 2025 to 2035
  10. Global Market Analysis 2020 to 2024 and Forecast 2025 to 2035, By Region
    • Introduction
    • Historical Market Size Value (USD Billion) & Volume (K Units) Analysis By Region, 2020 to 2024
    • Current Market Size Value (USD Billion) & Volume (K Units) Analysis and Forecast By Region, 2025 to 2035
      • North America
      • Latin America
      • Western Europe
      • Eastern Europe
      • East Asia
      • South Asia & Pacific
      • Middle East and Africa
    • Market Attractiveness Analysis By Region
  11. North America Market Analysis 2020 to 2024 and Forecast 2025 to 2035, By Country
    • Historical Market Size Value (USD Billion) & Volume (K Units) Trend Analysis By Market Taxonomy, 2020 to 2024
    • Market Size Value (USD Billion) & Volume (K Units) Forecast By Market Taxonomy, 2025 to 2035
      • By Country
        • USA
        • Canada
        • Mexico
      • By Bag Type
      • By Capacity
      • By Design
      • By End Use
    • Market Attractiveness Analysis
      • By Country
      • By Bag Type
      • By Capacity
      • By Design
      • By End Use
    • Key Takeaways
  12. Latin America Market Analysis 2020 to 2024 and Forecast 2025 to 2035, By Country
    • Historical Market Size Value (USD Billion) & Volume (K Units) Trend Analysis By Market Taxonomy, 2020 to 2024
    • Market Size Value (USD Billion) & Volume (K Units) Forecast By Market Taxonomy, 2025 to 2035
      • By Country
        • Brazil
        • Argentina
        • Rest of LATAM
      • By Bag Type
      • By Capacity
      • By Design
      • By End Use
    • Market Attractiveness Analysis
      • By Country
      • By Bag Type
      • By Capacity
      • By Design
      • By End Use
    • Key Takeaways
  13. Western Europe Market Analysis 2020 to 2024 and Forecast 2025 to 2035, By Country
    • Historical Market Size Value (USD Billion) & Volume (K Units) Trend Analysis By Market Taxonomy, 2020 to 2024
    • Market Size Value (USD Billion) & Volume (K Units) Forecast By Market Taxonomy, 2025 to 2035
      • By Country
        • Germany
        • Italy
        • France
        • UK
        • Spain
        • BENELUX
        • Nordic
        • Rest of W.Europe
      • By Bag Type
      • By Capacity
      • By Design
      • By End Use
    • Market Attractiveness Analysis
      • By Country
      • By Bag Type
      • By Capacity
      • By Design
      • By End Use
    • Key Takeaways
  14. Eastern Europe Market Analysis 2020 to 2024 and Forecast 2025 to 2035, By Country
    • Historical Market Size Value (USD Billion) & Volume (K Units) Trend Analysis By Market Taxonomy, 2020 to 2024
    • Market Size Value (USD Billion) & Volume (K Units) Forecast By Market Taxonomy, 2025 to 2035
      • By Country
        • Russia
        • Hungary
        • Poland
        • Balkan & Baltics
        • Rest of E. Europe
      • By Bag Type
      • By Capacity
      • By Design
      • By End Use
    • Market Attractiveness Analysis
      • By Country
      • By Bag Type
      • By Capacity
      • By Design
      • By End Use
    • Key Takeaways
  15. East Asia Market Analysis 2020 to 2024 and Forecast 2025 to 2035, By Country
    • Historical Market Size Value (USD Billion) & Volume (K Units) Trend Analysis By Market Taxonomy, 2020 to 2024
    • Market Size Value (USD Billion) & Volume (K Units) Forecast By Market Taxonomy, 2025 to 2035
      • By Country
        • China
        • Japan
        • South Korea
      • By Bag Type
      • By Capacity
      • By Design
      • By End Use
    • Market Attractiveness Analysis
      • By Country
      • By Bag Type
      • By Capacity
      • By Design
      • By End Use
    • Key Takeaways
  16. South Asia & Pacific Market Analysis 2020 to 2024 and Forecast 2025 to 2035, By Country
    • Historical Market Size Value (USD Billion) & Volume (K Units) Trend Analysis By Market Taxonomy, 2020 to 2024
    • Market Size Value (USD Billion) & Volume (K Units) Forecast By Market Taxonomy, 2025 to 2035
      • By Country
        • India
        • Australia & New Zealand
        • ASEAN
        • Rest of SAP
      • By Bag Type
      • By Capacity
      • By Design
      • By End Use
    • Market Attractiveness Analysis
      • By Country
      • By Bag Type
      • By Capacity
      • By Design
      • By End Use
    • Key Takeaways
  17. Middle East and Africa Market Analysis 2020 to 2024 and Forecast 2025 to 2035, By Country
    • Historical Market Size Value (USD Billion) & Volume (K Units) Trend Analysis By Market Taxonomy, 2020 to 2024
    • Market Size Value (USD Billion) & Volume (K Units) Forecast By Market Taxonomy, 2025 to 2035
      • By Country
        • GCC Countries
        • Northern Africa
        • South Africa
        • Turkiye
        • Rest of MEA
      • By Bag Type
      • By Capacity
      • By Design
      • By End Use
    • Market Attractiveness Analysis
      • By Country
      • By Bag Type
      • By Capacity
      • By Design
      • By End Use
    • Key Takeaways
  18. Key Countries Market Analysis
    • USA
      • Pricing Analysis
      • Market Share Analysis, 2024
        • By Bag Type
        • By Capacity
        • By Design
        • By End Use
    • Canada
      • Pricing Analysis
      • Market Share Analysis, 2024
        • By Bag Type
        • By Capacity
        • By Design
        • By End Use
    • Brazil
      • Pricing Analysis
      • Market Share Analysis, 2024
        • By Bag Type
        • By Capacity
        • By Design
        • By End Use
    • Mexico
      • Pricing Analysis
      • Market Share Analysis, 2024
        • By Bag Type
        • By Capacity
        • By Design
        • By End Use
    • Argentina
      • Pricing Analysis
      • Market Share Analysis, 2024
        • By Bag Type
        • By Capacity
        • By Design
        • By End Use
  19. Market Structure Analysis
    • Competition Dashboard
    • Competition Benchmarking
    • Market Share Analysis of Top Players
      • By Regional
      • By Bag Type
      • By Capacity
      • By Design
      • By End Use
  20. Competition Analysis
    • Competition Deep Dive
      • Berry Global Group, Inc.
        • Overview
        • Product Portfolio
        • Profitability by Market Segments (Product/Age /Sales Channel/Region)
        • Sales Footprint
        • Strategy Overview
          • Marketing Strategy
          • Product Strategy
          • Channel Strategy
      • Greif Inc.
        • Overview
        • Product Portfolio
        • Profitability by Market Segments (Product/Age /Sales Channel/Region)
        • Sales Footprint
        • Strategy Overview
          • Marketing Strategy
          • Product Strategy
          • Channel Strategy
      • Conitex Sonoco
        • Overview
        • Product Portfolio
        • Profitability by Market Segments (Product/Age /Sales Channel/Region)
        • Sales Footprint
        • Strategy Overview
          • Marketing Strategy
          • Product Strategy
          • Channel Strategy
      • AmeriGlobe L.L.C.
        • Overview
        • Product Portfolio
        • Profitability by Market Segments (Product/Age /Sales Channel/Region)
        • Sales Footprint
        • Strategy Overview
          • Marketing Strategy
          • Product Strategy
          • Channel Strategy
      • PT. WIHARTA KARYA AGUNG
        • Overview
        • Product Portfolio
        • Profitability by Market Segments (Product/Age /Sales Channel/Region)
        • Sales Footprint
        • Strategy Overview
          • Marketing Strategy
          • Product Strategy
          • Channel Strategy
      • BAG Corp.
        • Overview
        • Product Portfolio
        • Profitability by Market Segments (Product/Age /Sales Channel/Region)
        • Sales Footprint
        • Strategy Overview
          • Marketing Strategy
          • Product Strategy
          • Channel Strategy
      • Halsted Corporation
        • Overview
        • Product Portfolio
        • Profitability by Market Segments (Product/Age /Sales Channel/Region)
        • Sales Footprint
        • Strategy Overview
          • Marketing Strategy
          • Product Strategy
          • Channel Strategy
      • Intertape Polymer Group
        • Overview
        • Product Portfolio
        • Profitability by Market Segments (Product/Age /Sales Channel/Region)
        • Sales Footprint
        • Strategy Overview
          • Marketing Strategy
          • Product Strategy
          • Channel Strategy
      • Emmbi Industries Ltd.
        • Overview
        • Product Portfolio
        • Profitability by Market Segments (Product/Age /Sales Channel/Region)
        • Sales Footprint
        • Strategy Overview
          • Marketing Strategy
          • Product Strategy
          • Channel Strategy
      • LC Packaging International BV
        • Overview
        • Product Portfolio
        • Profitability by Market Segments (Product/Age /Sales Channel/Region)
        • Sales Footprint
        • Strategy Overview
          • Marketing Strategy
          • Product Strategy
          • Channel Strategy
  21. Assumptions & Acronyms Used
  22. Research Methodology

List of Tables

  • Table 1: Global Market Value (USD Billion) Forecast by Region, 2020-2035
  • Table 2: Global Market Volume (K Units) Forecast by Region, 2020-2035
  • Table 3: Global Market Value (USD Billion) Forecast by Bag Type, 2020-2035
  • Table 4: Global Market Volume (K Units) Forecast by Bag Type, 2020-2035
  • Table 5: Global Market Value (USD Billion) Forecast by Capacity, 2020-2035
  • Table 6: Global Market Volume (K Units) Forecast by Capacity, 2020-2035
  • Table 7: Global Market Value (USD Billion) Forecast by Design, 2020-2035
  • Table 8: Global Market Volume (K Units) Forecast by Design, 2020-2035
  • Table 9: Global Market Value (USD Billion) Forecast by End Use, 2020-2035
  • Table 10: Global Market Volume (K Units) Forecast by End Use, 2020-2035
  • Table 11: North America Market Value (USD Billion) Forecast by Country, 2020-2035
  • Table 12: North America Market Volume (K Units) Forecast by Country, 2020-2035
  • Table 13: North America Market Value (USD Billion) Forecast by Bag Type, 2020-2035
  • Table 14: North America Market Volume (K Units) Forecast by Bag Type, 2020-2035
  • Table 15: North America Market Value (USD Billion) Forecast by Capacity, 2020-2035
  • Table 16: North America Market Volume (K Units) Forecast by Capacity, 2020-2035
  • Table 17: North America Market Value (USD Billion) Forecast by Design, 2020-2035
  • Table 18: North America Market Volume (K Units) Forecast by Design, 2020-2035
  • Table 19: North America Market Value (USD Billion) Forecast by End Use, 2020-2035
  • Table 20: North America Market Volume (K Units) Forecast by End Use, 2020-2035
  • Table 21: Latin America Market Value (USD Billion) Forecast by Country, 2020-2035
  • Table 22: Latin America Market Volume (K Units) Forecast by Country, 2020-2035
  • Table 23: Latin America Market Value (USD Billion) Forecast by Bag Type, 2020-2035
  • Table 24: Latin America Market Volume (K Units) Forecast by Bag Type, 2020-2035
  • Table 25: Latin America Market Value (USD Billion) Forecast by Capacity, 2020-2035
  • Table 26: Latin America Market Volume (K Units) Forecast by Capacity, 2020-2035
  • Table 27: Latin America Market Value (USD Billion) Forecast by Design, 2020-2035
  • Table 28: Latin America Market Volume (K Units) Forecast by Design, 2020-2035
  • Table 29: Latin America Market Value (USD Billion) Forecast by End Use, 2020-2035
  • Table 30: Latin America Market Volume (K Units) Forecast by End Use, 2020-2035
  • Table 31: Western Europe Market Value (USD Billion) Forecast by Country, 2020-2035
  • Table 32: Western Europe Market Volume (K Units) Forecast by Country, 2020-2035
  • Table 33: Western Europe Market Value (USD Billion) Forecast by Bag Type, 2020-2035
  • Table 34: Western Europe Market Volume (K Units) Forecast by Bag Type, 2020-2035
  • Table 35: Western Europe Market Value (USD Billion) Forecast by Capacity, 2020-2035
  • Table 36: Western Europe Market Volume (K Units) Forecast by Capacity, 2020-2035
  • Table 37: Western Europe Market Value (USD Billion) Forecast by Design, 2020-2035
  • Table 38: Western Europe Market Volume (K Units) Forecast by Design, 2020-2035
  • Table 39: Western Europe Market Value (USD Billion) Forecast by End Use, 2020-2035
  • Table 40: Western Europe Market Volume (K Units) Forecast by End Use, 2020-2035
  • Table 41: Eastern Europe Market Value (USD Billion) Forecast by Country, 2020-2035
  • Table 42: Eastern Europe Market Volume (K Units) Forecast by Country, 2020-2035
  • Table 43: Eastern Europe Market Value (USD Billion) Forecast by Bag Type, 2020-2035
  • Table 44: Eastern Europe Market Volume (K Units) Forecast by Bag Type, 2020-2035
  • Table 45: Eastern Europe Market Value (USD Billion) Forecast by Capacity, 2020-2035
  • Table 46: Eastern Europe Market Volume (K Units) Forecast by Capacity, 2020-2035
  • Table 47: Eastern Europe Market Value (USD Billion) Forecast by Design, 2020-2035
  • Table 48: Eastern Europe Market Volume (K Units) Forecast by Design, 2020-2035
  • Table 49: Eastern Europe Market Value (USD Billion) Forecast by End Use, 2020-2035
  • Table 50: Eastern Europe Market Volume (K Units) Forecast by End Use, 2020-2035
  • Table 51: East Asia Market Value (USD Billion) Forecast by Country, 2020-2035
  • Table 52: East Asia Market Volume (K Units) Forecast by Country, 2020-2035
  • Table 53: East Asia Market Value (USD Billion) Forecast by Bag Type, 2020-2035
  • Table 54: East Asia Market Volume (K Units) Forecast by Bag Type, 2020-2035
  • Table 55: East Asia Market Value (USD Billion) Forecast by Capacity, 2020-2035
  • Table 56: East Asia Market Volume (K Units) Forecast by Capacity, 2020-2035
  • Table 57: East Asia Market Value (USD Billion) Forecast by Design, 2020-2035
  • Table 58: East Asia Market Volume (K Units) Forecast by Design, 2020-2035
  • Table 59: East Asia Market Value (USD Billion) Forecast by End Use, 2020-2035
  • Table 60: East Asia Market Volume (K Units) Forecast by End Use, 2020-2035
  • Table 61: South Asia & Pacific Market Value (USD Billion) Forecast by Country, 2020-2035
  • Table 62: South Asia & Pacific Market Volume (K Units) Forecast by Country, 2020-2035
  • Table 63: South Asia & Pacific Market Value (USD Billion) Forecast by Bag Type, 2020-2035
  • Table 64: South Asia & Pacific Market Volume (K Units) Forecast by Bag Type, 2020-2035
  • Table 65: South Asia & Pacific Market Value (USD Billion) Forecast by Capacity, 2020-2035
  • Table 66: South Asia & Pacific Market Volume (K Units) Forecast by Capacity, 2020-2035
  • Table 67: South Asia & Pacific Market Value (USD Billion) Forecast by Design, 2020-2035
  • Table 68: South Asia & Pacific Market Volume (K Units) Forecast by Design, 2020-2035
  • Table 69: South Asia & Pacific Market Value (USD Billion) Forecast by End Use, 2020-2035
  • Table 70: South Asia & Pacific Market Volume (K Units) Forecast by End Use, 2020-2035
  • Table 71: Middle East and Africa Market Value (USD Billion) Forecast by Country, 2020-2035
  • Table 72: Middle East and Africa Market Volume (K Units) Forecast by Country, 2020-2035
  • Table 73: Middle East and Africa Market Value (USD Billion) Forecast by Bag Type, 2020-2035
  • Table 74: Middle East and Africa Market Volume (K Units) Forecast by Bag Type, 2020-2035
  • Table 75: Middle East and Africa Market Value (USD Billion) Forecast by Capacity, 2020-2035
  • Table 76: Middle East and Africa Market Volume (K Units) Forecast by Capacity, 2020-2035
  • Table 77: Middle East and Africa Market Value (USD Billion) Forecast by Design, 2020-2035
  • Table 78: Middle East and Africa Market Volume (K Units) Forecast by Design, 2020-2035
  • Table 79: Middle East and Africa Market Value (USD Billion) Forecast by End Use, 2020-2035
  • Table 80: Middle East and Africa Market Volume (K Units) Forecast by End Use, 2020-2035

List of Figures

  • Figure 1: Global Market Volume (K Units) Forecast 2020-2035
  • Figure 2: Global Market Pricing Analysis
  • Figure 3: Global Market Value (USD Billion) Forecast 2020-2035
  • Figure 4: Global Market Value Share and BPS Analysis by Bag Type, 2025 and 2035
  • Figure 5: Global Market Y-o-Y Growth Comparison by Bag Type, 2025-2035
  • Figure 6: Global Market Attractiveness Analysis by Bag Type
  • Figure 7: Global Market Value Share and BPS Analysis by Capacity, 2025 and 2035
  • Figure 8: Global Market Y-o-Y Growth Comparison by Capacity, 2025-2035
  • Figure 9: Global Market Attractiveness Analysis by Capacity
  • Figure 10: Global Market Value Share and BPS Analysis by Design, 2025 and 2035
  • Figure 11: Global Market Y-o-Y Growth Comparison by Design, 2025-2035
  • Figure 12: Global Market Attractiveness Analysis by Design
  • Figure 13: Global Market Value Share and BPS Analysis by End Use, 2025 and 2035
  • Figure 14: Global Market Y-o-Y Growth Comparison by End Use, 2025-2035
  • Figure 15: Global Market Attractiveness Analysis by End Use
  • Figure 16: Global Market Value (USD Billion) Share and BPS Analysis by Region, 2025 and 2035
  • Figure 17: Global Market Y-o-Y Growth Comparison by Region, 2025-2035
  • Figure 18: Global Market Attractiveness Analysis by Region
  • Figure 19: North America Market Incremental $ Opportunity, 2025-2035
  • Figure 20: Latin America Market Incremental $ Opportunity, 2025-2035
  • Figure 21: Western Europe Market Incremental $ Opportunity, 2025-2035
  • Figure 22: Eastern Europe Market Incremental $ Opportunity, 2025-2035
  • Figure 23: East Asia Market Incremental $ Opportunity, 2025-2035
  • Figure 24: South Asia & Pacific Market Incremental $ Opportunity, 2025-2035
  • Figure 25: Middle East and Africa Market Incremental $ Opportunity, 2025-2035
  • Figure 26: North America Market Value Share and BPS Analysis by Country, 2025 and 2035
  • Figure 27: North America Market Value Share and BPS Analysis by Bag Type, 2025 and 2035
  • Figure 28: North America Market Y-o-Y Growth Comparison by Bag Type, 2025-2035
  • Figure 29: North America Market Attractiveness Analysis by Bag Type
  • Figure 30: North America Market Value Share and BPS Analysis by Capacity, 2025 and 2035
  • Figure 31: North America Market Y-o-Y Growth Comparison by Capacity, 2025-2035
  • Figure 32: North America Market Attractiveness Analysis by Capacity
  • Figure 33: North America Market Value Share and BPS Analysis by Design, 2025 and 2035
  • Figure 34: North America Market Y-o-Y Growth Comparison by Design, 2025-2035
  • Figure 35: North America Market Attractiveness Analysis by Design
  • Figure 36: North America Market Value Share and BPS Analysis by End Use, 2025 and 2035
  • Figure 37: North America Market Y-o-Y Growth Comparison by End Use, 2025-2035
  • Figure 38: North America Market Attractiveness Analysis by End Use
  • Figure 39: Latin America Market Value Share and BPS Analysis by Country, 2025 and 2035
  • Figure 40: Latin America Market Value Share and BPS Analysis by Bag Type, 2025 and 2035
  • Figure 41: Latin America Market Y-o-Y Growth Comparison by Bag Type, 2025-2035
  • Figure 42: Latin America Market Attractiveness Analysis by Bag Type
  • Figure 43: Latin America Market Value Share and BPS Analysis by Capacity, 2025 and 2035
  • Figure 44: Latin America Market Y-o-Y Growth Comparison by Capacity, 2025-2035
  • Figure 45: Latin America Market Attractiveness Analysis by Capacity
  • Figure 46: Latin America Market Value Share and BPS Analysis by Design, 2025 and 2035
  • Figure 47: Latin America Market Y-o-Y Growth Comparison by Design, 2025-2035
  • Figure 48: Latin America Market Attractiveness Analysis by Design
  • Figure 49: Latin America Market Value Share and BPS Analysis by End Use, 2025 and 2035
  • Figure 50: Latin America Market Y-o-Y Growth Comparison by End Use, 2025-2035
  • Figure 51: Latin America Market Attractiveness Analysis by End Use
  • Figure 52: Western Europe Market Value Share and BPS Analysis by Country, 2025 and 2035
  • Figure 53: Western Europe Market Value Share and BPS Analysis by Bag Type, 2025 and 2035
  • Figure 54: Western Europe Market Y-o-Y Growth Comparison by Bag Type, 2025-2035
  • Figure 55: Western Europe Market Attractiveness Analysis by Bag Type
  • Figure 56: Western Europe Market Value Share and BPS Analysis by Capacity, 2025 and 2035
  • Figure 57: Western Europe Market Y-o-Y Growth Comparison by Capacity, 2025-2035
  • Figure 58: Western Europe Market Attractiveness Analysis by Capacity
  • Figure 59: Western Europe Market Value Share and BPS Analysis by Design, 2025 and 2035
  • Figure 60: Western Europe Market Y-o-Y Growth Comparison by Design, 2025-2035
  • Figure 61: Western Europe Market Attractiveness Analysis by Design
  • Figure 62: Western Europe Market Value Share and BPS Analysis by End Use, 2025 and 2035
  • Figure 63: Western Europe Market Y-o-Y Growth Comparison by End Use, 2025-2035
  • Figure 64: Western Europe Market Attractiveness Analysis by End Use
  • Figure 65: Eastern Europe Market Value Share and BPS Analysis by Country, 2025 and 2035
  • Figure 66: Eastern Europe Market Value Share and BPS Analysis by Bag Type, 2025 and 2035
  • Figure 67: Eastern Europe Market Y-o-Y Growth Comparison by Bag Type, 2025-2035
  • Figure 68: Eastern Europe Market Attractiveness Analysis by Bag Type
  • Figure 69: Eastern Europe Market Value Share and BPS Analysis by Capacity, 2025 and 2035
  • Figure 70: Eastern Europe Market Y-o-Y Growth Comparison by Capacity, 2025-2035
  • Figure 71: Eastern Europe Market Attractiveness Analysis by Capacity
  • Figure 72: Eastern Europe Market Value Share and BPS Analysis by Design, 2025 and 2035
  • Figure 73: Eastern Europe Market Y-o-Y Growth Comparison by Design, 2025-2035
  • Figure 74: Eastern Europe Market Attractiveness Analysis by Design
  • Figure 75: Eastern Europe Market Value Share and BPS Analysis by End Use, 2025 and 2035
  • Figure 76: Eastern Europe Market Y-o-Y Growth Comparison by End Use, 2025-2035
  • Figure 77: Eastern Europe Market Attractiveness Analysis by End Use
  • Figure 78: East Asia Market Value Share and BPS Analysis by Country, 2025 and 2035
  • Figure 79: East Asia Market Value Share and BPS Analysis by Bag Type, 2025 and 2035
  • Figure 80: East Asia Market Y-o-Y Growth Comparison by Bag Type, 2025-2035
  • Figure 81: East Asia Market Attractiveness Analysis by Bag Type
  • Figure 82: East Asia Market Value Share and BPS Analysis by Capacity, 2025 and 2035
  • Figure 83: East Asia Market Y-o-Y Growth Comparison by Capacity, 2025-2035
  • Figure 84: East Asia Market Attractiveness Analysis by Capacity
  • Figure 85: East Asia Market Value Share and BPS Analysis by Design, 2025 and 2035
  • Figure 86: East Asia Market Y-o-Y Growth Comparison by Design, 2025-2035
  • Figure 87: East Asia Market Attractiveness Analysis by Design
  • Figure 88: East Asia Market Value Share and BPS Analysis by End Use, 2025 and 2035
  • Figure 89: East Asia Market Y-o-Y Growth Comparison by End Use, 2025-2035
  • Figure 90: East Asia Market Attractiveness Analysis by End Use
  • Figure 91: South Asia & Pacific Market Value Share and BPS Analysis by Country, 2025 and 2035
  • Figure 92: South Asia & Pacific Market Value Share and BPS Analysis by Bag Type, 2025 and 2035
  • Figure 93: South Asia & Pacific Market Y-o-Y Growth Comparison by Bag Type, 2025-2035
  • Figure 94: South Asia & Pacific Market Attractiveness Analysis by Bag Type
  • Figure 95: South Asia & Pacific Market Value Share and BPS Analysis by Capacity, 2025 and 2035
  • Figure 96: South Asia & Pacific Market Y-o-Y Growth Comparison by Capacity, 2025-2035
  • Figure 97: South Asia & Pacific Market Attractiveness Analysis by Capacity
  • Figure 98: South Asia & Pacific Market Value Share and BPS Analysis by Design, 2025 and 2035
  • Figure 99: South Asia & Pacific Market Y-o-Y Growth Comparison by Design, 2025-2035
  • Figure 100: South Asia & Pacific Market Attractiveness Analysis by Design
  • Figure 101: South Asia & Pacific Market Value Share and BPS Analysis by End Use, 2025 and 2035
  • Figure 102: South Asia & Pacific Market Y-o-Y Growth Comparison by End Use, 2025-2035
  • Figure 103: South Asia & Pacific Market Attractiveness Analysis by End Use
  • Figure 104: Middle East and Africa Market Value Share and BPS Analysis by Country, 2025 and 2035
  • Figure 105: Middle East and Africa Market Value Share and BPS Analysis by Bag Type, 2025 and 2035
  • Figure 106: Middle East and Africa Market Y-o-Y Growth Comparison by Bag Type, 2025-2035
  • Figure 107: Middle East and Africa Market Attractiveness Analysis by Bag Type
  • Figure 108: Middle East and Africa Market Value Share and BPS Analysis by Capacity, 2025 and 2035
  • Figure 109: Middle East and Africa Market Y-o-Y Growth Comparison by Capacity, 2025-2035
  • Figure 110: Middle East and Africa Market Attractiveness Analysis by Capacity
  • Figure 111: Middle East and Africa Market Value Share and BPS Analysis by Design, 2025 and 2035
  • Figure 112: Middle East and Africa Market Y-o-Y Growth Comparison by Design, 2025-2035
  • Figure 113: Middle East and Africa Market Attractiveness Analysis by Design
  • Figure 114: Middle East and Africa Market Value Share and BPS Analysis by End Use, 2025 and 2035
  • Figure 115: Middle East and Africa Market Y-o-Y Growth Comparison by End Use, 2025-2035
  • Figure 116: Middle East and Africa Market Attractiveness Analysis by End Use
  • Figure 117: Global Market - Tier Structure Analysis
  • Figure 118: Global Market - Company Share Analysis

Frequently Asked Questions

What is the projected CAGR for the jumbo bags market from 2025 to 2035?

The industry is expected to grow at a CAGR of 4.2% during the forecast period.

Which jumbo bag type is expected to hold the largest share in 2025?

Type C bags are projected to account for 34.0% of the market demand in 2025.

What capacity range dominates the jumbo bags market in 2025?

Bags with 750 - 1500 kg capacity are expected to represent 41.0% of total market share.

Which country leads the global jumbo bags market in terms of growth rate?

India leads with a CAGR of 5.3%, outperforming the global average by 26%.

Who is the leading manufacturer in the jumbo bags market by share?

Berry Global Group, Inc. is the top player, holding a 19% industry share.

Explore Similar Insights

Future Market Insights

Jumbo Bags Market