PP Jumbo Bag Market Overview

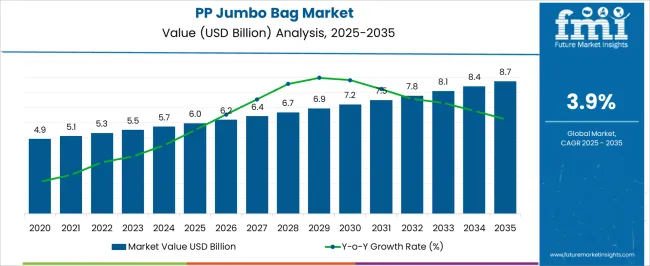
The global PP Jumbo Bag Market valuation is estimated to reach USD 5.5 billion in 2023. In 2022, the market recorded a valuation of USD 5.2 billion. The market is predicted to grow at a modest rate of 4.1% from 2023 to 2033. The PP jumbo bag market is expected to reach USD 8.2 billion by 2033.

Attributes Key Statistics
Expected Base Year Value (2023) USD 5.5 billion
Anticipated Forecast Value (2033) USD 8.2 billion
Estimated Growth (2023 to 2033) 4.1% CAGR

Key Market Highlights:

Surging Demand for Sustainable Packaging Solutions Boost PP Jumbo Bags Sales

As the world moves toward sustainable packaging solutions, the demand for PP Jumbo bags is likely to foresee a considerable surge in the upcoming years. PP jumbo bags are environmentally friendly, causing minimal harm to the surroundings compared to other plastic bags. PP jumbo bags have also gained more impetus in the industrial sector as they can be reused multiple times before recycling.

The significance of PP jumbo bags in the manufacturing sector has been increasing exponentially due to their durability, ruggedness, and affordability. These bags can also be transported easily. In the packaging sector, PP jumbo bags are also in high demand, as they offer efficient protection to the consignment against water and other external elements. With the boom of e-commerce platforms and the rising concern of eco-conscious consumers, it is anticipated that the PP jumbo bag market size will experience a considerable expansion.

Consumption Analysis of the PP Jumbo Bag Market

  • The agricultural sector forms one of the leading consumer groups of the PP jumbo bag market. Due to their robust ruggedness and durability, these bags are used to store and transport agricultural products such as grains, seeds, and fertilizers.
  • The construction and building sector also utilizes PP jumbo bags for transporting and storing essential materials, such as sand, gravel, cement, etc., as these bulk bags offer excellent resistance against water and air moisture.
  • The packaging industry extensively uses PP jumbo bags to transport, store, and distribute bulk quantities of goods from food and beverage, pharmaceutical, chemical, etc.
  • These bags can be easily recyclable, softened, and made into new products like paper, tarpaulin sheets, agricultural nets, etc.
  • On a microscopic scale, PP jumbo bags are also used by local retailers and supermarkets as they are environmentally safe to carry vast quantities of products in and around the city.
  • Eco-conscious individuals also use PP jumbo bags to store bulk goods and items. However, this user case is minuscule and only contributes a little to the overall PP jumbo bag market.

Historical Analysis of the PP Jumbo Bag Market

The market for PP jumbo bags is heavily reliant on the performance of the manufacturing and packaging industry. The last few years were a real roller coaster ride for the PP jumbo bag market. As the world faced shutdowns, enterprises, especially manufacturing, underwent tremendous losses, leading to decreased demand for PP jumbo bags.

While in some sectors, like agriculture and food, the need for PP jumbo bags was still stable, others, like construction, faced reduced demand.

As the world returns to normalcy, industries are gaining traction, and it can be confidently projected that the market for PP jumbo bags is likely to gain momentum in the coming years.

Attributes Key Statistics
Expected Base Year Value (2018) USD 4.46 billion
Anticipated Forecast Value (2022) USD 5.2 billion
Estimated Growth (2018 to 2022) 3.9% CAGR

Factors Adversely Affecting the PP Jumbo Bag Market

  • The cost and availability of polypropylene, the fundamental raw material used in producing PP jumbo bags, can significantly impact the supply of these bags in the industrial sector.
  • Various governments and environmental organizations have raised serious concerns regarding the sustainability of polypropylene. This might deter businesses from using PP jumbo bags in their operations.
  • PP jumbo bags have to compete with other sustainable alternative packaging materials or technologies, such as reusable or bulk containers, which are relatively cheaper and more efficient. In the long term, this can reduce the demand for PP jumbo bags.
  • Financial downturns or recessionary economies can lead to reduced production, thus affecting the demand for PP jumbo bags in the packaging and manufacturing industries.
  • The demand for PP jumbo bags in the pharmaceutical and chemical industry is also declining considerably as temperature-sensitive liquid products and other chemicals can spoil and deteriorate PP jumbo bags during transportation.

Category-wise Insights

The Rising Prevalence of Type C Bags in the Industrial Setting to Boost PP Jumbo Bag Market

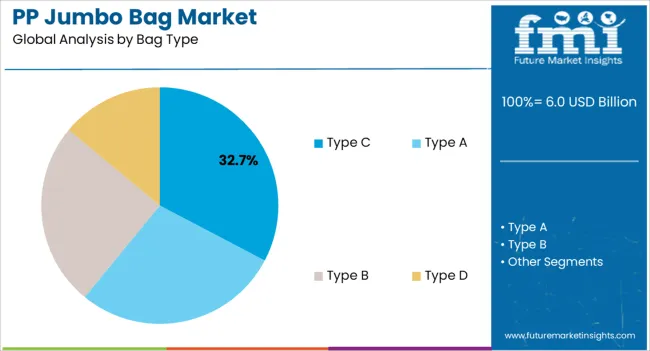
In terms of bag type, demand for type C bags is expected to account for a dominant share of the global PP jumbo bag market. These bags, also known as conductive FIBCs or groundable bulk bags, are considered safe packaging solutions for the transportation of combustible materials and products.

Type C bags hold a significant global revenue share of 41.3% of the overall PP jumbo bag market. These bags can withstand heavy loads while resisting tears and punctures.

Attributes Details
Bag Type Type C
Market share 41.3%

Type C bags are also in great demand as they offer protection against electrostatic discharges built due to the grounding of the bag during the filling and discharging processes. Their significance in the chemical industries is growing as they are used to transport and store flammable powders like magnesium. They also act as a resistive barrier between chemicals stored inside and outer elements that can be used to transport and store combustible powders like magnesium in factory units.

PP Jumbo Bag Market Foresees Considerable Expansion Amidst the Growing Agriculture Sector

PP jumbo bags play a pivotal role in the agriculture and food industry, meeting the demand for efficient and bulk packaging solutions. In agriculture, these robust bags are commonly used for storing and transporting grains, seeds, and fertilizers. The demand for these bags in agriculture is driven by their ability to safeguard products from moisture, pests, and contamination.

The agriculture and food sector accounts for a significant 35.1% of the global PP jumbo bag market.

Attributes Details
End User Agriculture and Food
Market share 35.1%

PP jumbo bags are in high demand for packaging bulk food products in the food industry. These bags are often used to store commodities like rice, sugar, flour, and animal feed. Their large capacity and durability make them ideal for transporting and storing these essential food staples. With the growing trend of online grocery shopping and increased focus on food safety, PP jumbo bags have become indispensable for ensuring food items' efficient and hygienic packaging.
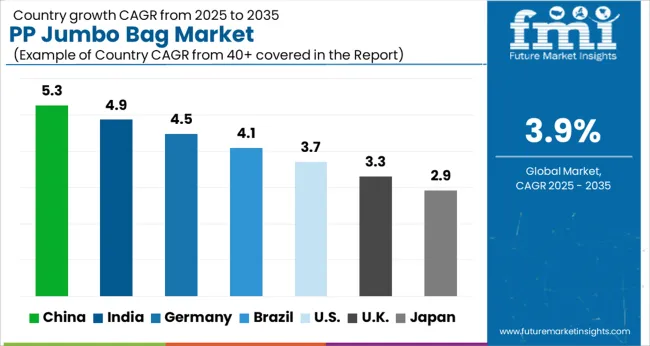
Country-wise Insights

Countries CAGR
India 6.3%
China 5.7%
Thailand 5.2%
South Korea 4.5%
The United Kingdom 3.9%

Growing Agricultural Sector Reliance on PP Jumbo Bags in India

The agriculture sector is one of the significant contributors to India’s economy. As the sector expands to meet the increasing food demands of the nation’s growing population, the demand for PP jumbo bags also touches the skies.

Farmers heavily rely on these bulk bags to store large quantities of fertilizers, seeds, pesticides, etc. Their ability to protect crops from moisture, pests, and contamination, coupled with cost-effectiveness, makes PP jumbo bags an attractive choice for farmers with low financial resources.

The market for PP jumbo bags in India is anticipated to grow at a remarkable rate of 6.3% from 2023 to 2033. This demand can also be attributed to the fact that PP jumbo bags are not only used in the agriculture sector but also in the packaging of finished products before they are processed in nearby factory units.

Expanding Market for PP Jumbo Bags in China's Packaging Industry

The market for PP jumbo bags is on the rise in China, primarily due to the country's thriving packaging industry. China's rapidly growing economy has increased demand for cost-effective and versatile packaging solutions. PP jumbo bags offer a reliable option for bulk packaging, especially in industries like agriculture, construction, chemicals, and logistics.

This growth in China's packaging industry and the need for efficient and secure bulk transportation have driven the demand for PP jumbo bags.

The China PP jumbo bag market is anticipated to exhibit a significant growth rate of 5.7% from 2023 to 2033. Many businesses in China are shifting toward more sustainable packaging options, and PP jumbo bags meet these criteria by reducing waste and offering a green alternative.

As China continues to focus on sustainable development, the market for PP jumbo bags is expected to expand even further in response to these evolving industry demands.

PP Jumbo Bags Market Thrives in Thailand's Construction Boom

With numerous infrastructure projects, urban development initiatives, and a rapidly growing construction industry, the demand for PP jumbo bags is on the rise. PP jumbo bags are known in the construction industry for their ability to transport and store construction materials like sand, gravel, and cement. Their large capacity, durability, and ease of handling make them indispensable in this sector.

The cost-efficiency and reusability of PP jumbo bags have further fueled their demand in the Thai construction industry. As construction projects continue to expand, the need for a reliable and cost-effective solution for transporting and storing bulk materials has led to a surge in their adoption.

As Thailand continues to invest in its infrastructure and urban development, the market for PP jumbo bags is set to remain on a growth trajectory.
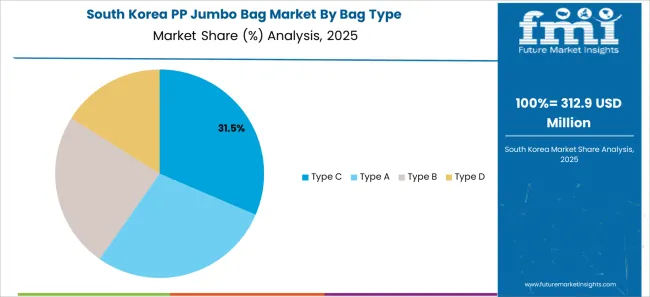
Expanding PP Jumbo Bag Market in South Korea's Pharma Sector

South Korea has emerged as a key player in the global pharmaceutical market in the past few years, with an increasing demand for high-quality packaging solutions. PP jumbo bags are used to package and transport a wide range of raw pharmaceutical materials and products.

The stringent quality requirements of the pharmaceutical industry make PP jumbo bags an excellent choice for preserving the integrity and purity of these sensitive substances during storage and transportation.

The market for PP jumbo bags in South Korea is anticipated to grow at a modest rate of 5.3% for the forecast period of 2023 to 2033. With the rise of South Korea's pharmaceutical sector, the market for PP jumbo bags is set to continue its growth trajectory in the country.
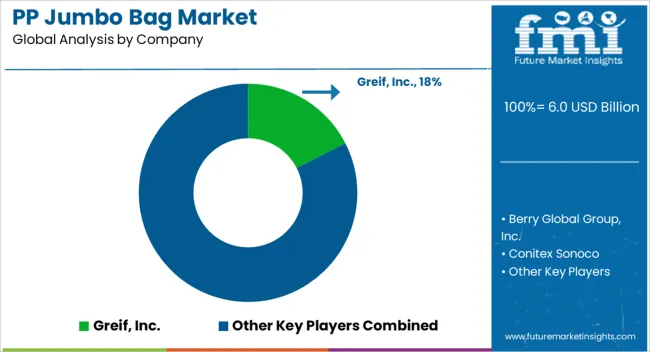
Competitive Analysis of the PP Jumbo Bag Market

The global PP jumbo bag market has reached a level of saturation where there is little room for innovation in the said field. Despite the prominence of key international players in the market, the industry has many challenges. Supply chain disruptions due to war-like situations and recessionary economic times have often affected the global PP jumbo bag market.

New entrants are constantly developing sustainable packaging solutions to cater to the market's demand locally. With growing environmental concerns regarding the reusability of these bags, the future of PP jumbo bags seems uncertain.

Recent Developments in the PP Jumbo Bag Market:

  • Umasree Texplast, an Ahmedabad-based packaging solution exporter, partnered with Packem, a Brazilian company that produces packaging machines. The joint venture aims to deliver 100% sustainable jumbo bags made of recycled PET. The project aims to increase India's sustainability and contribute to the ‘Make in India’ global campaign.
  • In 2022, Mondi acquired the flexible packaging division of Austrian Packaging Group. This acquisition allows Mondi to expand its product portfolio and market reach in the PP jumbo bag market.
  • Berry Global Group bought global plastic packaging supplier RPC Group, securing the equity interest in the company. This merger makes Berry Global Group a value-added protective and plastic packaging solutions supplier

Key Companies in the PP Jumbo Bag Market

  • Berry Global Group, Inc.:
  • Greif, Inc.:
  • Conitex Sonoco
  • AmeriGlobe LLC
  • Halsted Corporation
  • Intertape Polymer Group
  • J&HM DICKSON LTD.:
  • Emmbi, Inc.:
  • LC Packaging
  • Bulk Corp International
  • Rishi FIBC Solutions PVT
  • BAG Corp
  • Sackmakers
  • GLOBAL-PAK, Inc.
  • Material Motion, Inc.
  • Mondi Group

PP Jumbo Bag Market by Category

By Capacity:

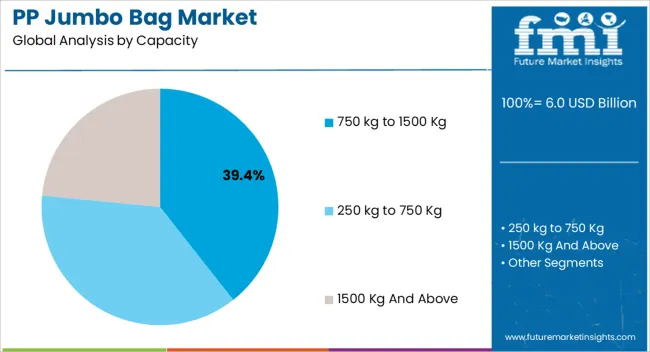
  • 250 kg to 750 kg
  • 750 kg to 1500 kg
  • 1500 kg and above

By Bag Type:

  • Type A
  • Type B
  • Type C
  • Type D

By Bag Design:

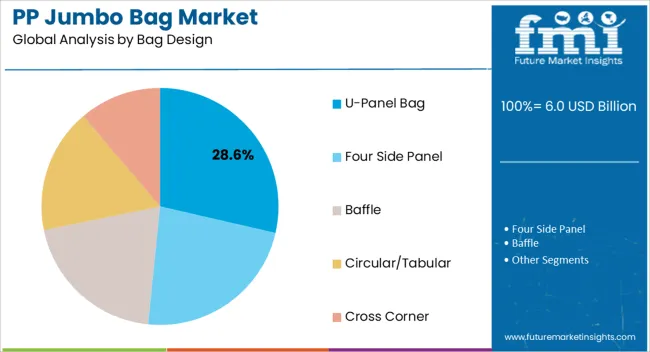
  • U-Panel Bag
  • Four Side Panel
  • Baffle
  • Circular/Tabular
  • Cross Corner

By End Use:

  • Chemical & Fertilizer
  • Agriculture & Food
  • Building & Construction
  • Pharmaceuticals
  • Mining

By Region:

  • North America
  • Latin America
  • Europe
  • Asia Pacific
  • The Middle East & Africa

Table of Content

  • 1. Executive Summary
  • 2. Market Overview
  • 3. Market Background
  • 4. Global Market Analysis 2018 to 2022 and Forecast, 2023 to 2033
  • 5. Global Market Analysis 2018 to 2022 and Forecast 2023 to 2033, By Capacity
    • 5.1. 250 kg-750 kg
    • 5.2. 750 kg-1500 kg
    • 5.3. 1500 kg and above
  • 6. Global Market Analysis 2018 to 2022 and Forecast 2023 to 2033, By Bag Type
    • 6.1. Type A
    • 6.2. Type B
    • 6.3. Type C
    • 6.4. Type D
  • 7. Global Market Analysis 2018 to 2022 and Forecast 2023 to 2033, By Bag Design
    • 7.1. U-Panel Bag
    • 7.2. Four Side Panel
    • 7.3. Baffle
    • 7.4. Circular/Tabular
    • 7.5. Cross Corner
  • 8. Global Market Analysis 2018 to 2022 and Forecast 2023 to 2033, By End Use
    • 8.1. Chemical & Fertilizer
    • 8.2. Agriculture & Food
    • 8.3. Building & Construction
    • 8.4. Pharmaceuticals
    • 8.5. Mining
  • 9. Global Market Analysis 2018 to 2022 and Forecast 2023 to 2033, By Region
    • 9.1. North America
    • 9.2. Latin America
    • 9.3. Western Europe
    • 9.4. Eastern Europe
    • 9.5. South Asia and Pacific
    • 9.6. East Asia
    • 9.7. Middle East and Africa
  • 10. North America Market Analysis 2018 to 2022 and Forecast 2023 to 2033, By Country
  • 11. Latin America Market Analysis 2018 to 2022 and Forecast 2023 to 2033, By Country
  • 12. Western Europe Market Analysis 2018 to 2022 and Forecast 2023 to 2033, By Country
  • 13. Eastern Europe Market Analysis 2018 to 2022 and Forecast 2023 to 2033, By Country
  • 14. South Asia and Pacific Market Analysis 2018 to 2022 and Forecast 2023 to 2033, By Country
  • 15. East Asia Market Analysis 2018 to 2022 and Forecast 2023 to 2033, By Country
  • 16. Middle East and Africa Market Analysis 2018 to 2022 and Forecast 2023 to 2033, By Country
  • 17. Key Countries Market Analysis
  • 18. Market Structure Analysis
  • 19. Competition Analysis
    • 19.1. Berry Global Group, Inc.
    • 19.2. Greif Inc.
    • 19.3. Conitex Sonoco
    • 19.4. AmeriGlobe L.L.C
    • 19.5. BAG Corp
    • 19.6. Halsted Corporation
    • 19.7. Intertape Polymer Group
    • 19.8. Sackmakers J&HM Dickson Ltd.
    • 19.9. Emmbi Industries Ltd.
    • 19.10. LC Packaging International BV
  • 20. Assumptions & Acronyms Used
  • 21. Research Methodology

List of Tables

Table 1: Global Market Value (US$ Million) Forecast by Region, 2018 to 2023

Table 2: Global Market Volume (Units) Forecast by Region, 2018 to 2023

Table 3: Global Market Value (US$ Million) Forecast by Capacity, 2018 to 2023

Table 4: Global Market Volume (Units) Forecast by Capacity, 2018 to 2023

Table 5: Global Market Value (US$ Million) Forecast by Bag Type, 2018 to 2023

Table 6: Global Market Volume (Units) Forecast by Bag Type, 2018 to 2023

Table 7: Global Market Value (US$ Million) Forecast by Bag Design, 2018 to 2023

Table 8: Global Market Volume (Units) Forecast by Bag Design, 2018 to 2023

Table 9: Global Market Value (US$ Million) Forecast by End Use, 2018 to 2023

Table 10: Global Market Volume (Units) Forecast by End Use, 2018 to 2023

Table 11: North America Market Value (US$ Million) Forecast by Country, 2018 to 2023

Table 12: North America Market Volume (Units) Forecast by Country, 2018 to 2023

Table 13: North America Market Value (US$ Million) Forecast by Capacity, 2018 to 2023

Table 14: North America Market Volume (Units) Forecast by Capacity, 2018 to 2023

Table 15: North America Market Value (US$ Million) Forecast by Bag Type, 2018 to 2023

Table 16: North America Market Volume (Units) Forecast by Bag Type, 2018 to 2023

Table 17: North America Market Value (US$ Million) Forecast by Bag Design, 2018 to 2023

Table 18: North America Market Volume (Units) Forecast by Bag Design, 2018 to 2023

Table 19: North America Market Value (US$ Million) Forecast by End Use, 2018 to 2023

Table 20: North America Market Volume (Units) Forecast by End Use, 2018 to 2023

Table 21: Latin America Market Value (US$ Million) Forecast by Country, 2018 to 2023

Table 22: Latin America Market Volume (Units) Forecast by Country, 2018 to 2023

Table 23: Latin America Market Value (US$ Million) Forecast by Capacity, 2018 to 2023

Table 24: Latin America Market Volume (Units) Forecast by Capacity, 2018 to 2023

Table 25: Latin America Market Value (US$ Million) Forecast by Bag Type, 2018 to 2023

Table 26: Latin America Market Volume (Units) Forecast by Bag Type, 2018 to 2023

Table 27: Latin America Market Value (US$ Million) Forecast by Bag Design, 2018 to 2023

Table 28: Latin America Market Volume (Units) Forecast by Bag Design, 2018 to 2023

Table 29: Latin America Market Value (US$ Million) Forecast by End Use, 2018 to 2023

Table 30: Latin America Market Volume (Units) Forecast by End Use, 2018 to 2023

Table 31: Western Europe Market Value (US$ Million) Forecast by Country, 2018 to 2023

Table 32: Western Europe Market Volume (Units) Forecast by Country, 2018 to 2023

Table 33: Western Europe Market Value (US$ Million) Forecast by Capacity, 2018 to 2023

Table 34: Western Europe Market Volume (Units) Forecast by Capacity, 2018 to 2023

Table 35: Western Europe Market Value (US$ Million) Forecast by Bag Type, 2018 to 2023

Table 36: Western Europe Market Volume (Units) Forecast by Bag Type, 2018 to 2023

Table 37: Western Europe Market Value (US$ Million) Forecast by Bag Design, 2018 to 2023

Table 38: Western Europe Market Volume (Units) Forecast by Bag Design, 2018 to 2023

Table 39: Western Europe Market Value (US$ Million) Forecast by End Use, 2018 to 2023

Table 40: Western Europe Market Volume (Units) Forecast by End Use, 2018 to 2023

Table 41: Eastern Europe Market Value (US$ Million) Forecast by Country, 2018 to 2023

Table 42: Eastern Europe Market Volume (Units) Forecast by Country, 2018 to 2023

Table 43: Eastern Europe Market Value (US$ Million) Forecast by Capacity, 2018 to 2023

Table 44: Eastern Europe Market Volume (Units) Forecast by Capacity, 2018 to 2023

Table 45: Eastern Europe Market Value (US$ Million) Forecast by Bag Type, 2018 to 2023

Table 46: Eastern Europe Market Volume (Units) Forecast by Bag Type, 2018 to 2023

Table 47: Eastern Europe Market Value (US$ Million) Forecast by Bag Design, 2018 to 2023

Table 48: Eastern Europe Market Volume (Units) Forecast by Bag Design, 2018 to 2023

Table 49: Eastern Europe Market Value (US$ Million) Forecast by End Use, 2018 to 2023

Table 50: Eastern Europe Market Volume (Units) Forecast by End Use, 2018 to 2023

Table 51: South Asia and Pacific Market Value (US$ Million) Forecast by Country, 2018 to 2023

Table 52: South Asia and Pacific Market Volume (Units) Forecast by Country, 2018 to 2023

Table 53: South Asia and Pacific Market Value (US$ Million) Forecast by Capacity, 2018 to 2023

Table 54: South Asia and Pacific Market Volume (Units) Forecast by Capacity, 2018 to 2023

Table 55: South Asia and Pacific Market Value (US$ Million) Forecast by Bag Type, 2018 to 2023

Table 56: South Asia and Pacific Market Volume (Units) Forecast by Bag Type, 2018 to 2023

Table 57: South Asia and Pacific Market Value (US$ Million) Forecast by Bag Design, 2018 to 2023

Table 58: South Asia and Pacific Market Volume (Units) Forecast by Bag Design, 2018 to 2023

Table 59: South Asia and Pacific Market Value (US$ Million) Forecast by End Use, 2018 to 2023

Table 60: South Asia and Pacific Market Volume (Units) Forecast by End Use, 2018 to 2023

Table 61: East Asia Market Value (US$ Million) Forecast by Country, 2018 to 2023

Table 62: East Asia Market Volume (Units) Forecast by Country, 2018 to 2023

Table 63: East Asia Market Value (US$ Million) Forecast by Capacity, 2018 to 2023

Table 64: East Asia Market Volume (Units) Forecast by Capacity, 2018 to 2023

Table 65: East Asia Market Value (US$ Million) Forecast by Bag Type, 2018 to 2023

Table 66: East Asia Market Volume (Units) Forecast by Bag Type, 2018 to 2023

Table 67: East Asia Market Value (US$ Million) Forecast by Bag Design, 2018 to 2023

Table 68: East Asia Market Volume (Units) Forecast by Bag Design, 2018 to 2023

Table 69: East Asia Market Value (US$ Million) Forecast by End Use, 2018 to 2023

Table 70: East Asia Market Volume (Units) Forecast by End Use, 2018 to 2023

Table 71: Middle East and Africa Market Value (US$ Million) Forecast by Country, 2018 to 2023

Table 72: Middle East and Africa Market Volume (Units) Forecast by Country, 2018 to 2023

Table 73: Middle East and Africa Market Value (US$ Million) Forecast by Capacity, 2018 to 2023

Table 74: Middle East and Africa Market Volume (Units) Forecast by Capacity, 2018 to 2023

Table 75: Middle East and Africa Market Value (US$ Million) Forecast by Bag Type, 2018 to 2023

Table 76: Middle East and Africa Market Volume (Units) Forecast by Bag Type, 2018 to 2023

Table 77: Middle East and Africa Market Value (US$ Million) Forecast by Bag Design, 2018 to 2023

Table 78: Middle East and Africa Market Volume (Units) Forecast by Bag Design, 2018 to 2023

Table 79: Middle East and Africa Market Value (US$ Million) Forecast by End Use, 2018 to 2023

Table 80: Middle East and Africa Market Volume (Units) Forecast by End Use, 2018 to 2023

List of Figures

Figure 1: Global Market Value (US$ Million) by Capacity, 2023 to 2033

Figure 2: Global Market Value (US$ Million) by Bag Type, 2023 to 2033

Figure 3: Global Market Value (US$ Million) by Bag Design, 2023 to 2033

Figure 4: Global Market Value (US$ Million) by End Use, 2023 to 2033

Figure 5: Global Market Value (US$ Million) by Region, 2023 to 2033

Figure 6: Global Market Value (US$ Million) Analysis by Region, 2018 to 2023

Figure 7: Global Market Volume (Units) Analysis by Region, 2018 to 2023

Figure 8: Global Market Value Share (%) and BPS Analysis by Region, 2023 to 2033

Figure 9: Global Market Y-o-Y Growth (%) Projections by Region, 2023 to 2033

Figure 10: Global Market Value (US$ Million) Analysis by Capacity, 2018 to 2023

Figure 11: Global Market Volume (Units) Analysis by Capacity, 2018 to 2023

Figure 12: Global Market Value Share (%) and BPS Analysis by Capacity, 2023 to 2033

Figure 13: Global Market Y-o-Y Growth (%) Projections by Capacity, 2023 to 2033

Figure 14: Global Market Value (US$ Million) Analysis by Bag Type, 2018 to 2023

Figure 15: Global Market Volume (Units) Analysis by Bag Type, 2018 to 2023

Figure 16: Global Market Value Share (%) and BPS Analysis by Bag Type, 2023 to 2033

Figure 17: Global Market Y-o-Y Growth (%) Projections by Bag Type, 2023 to 2033

Figure 18: Global Market Value (US$ Million) Analysis by Bag Design, 2018 to 2023

Figure 19: Global Market Volume (Units) Analysis by Bag Design, 2018 to 2023

Figure 20: Global Market Value Share (%) and BPS Analysis by Bag Design, 2023 to 2033

Figure 21: Global Market Y-o-Y Growth (%) Projections by Bag Design, 2023 to 2033

Figure 22: Global Market Value (US$ Million) Analysis by End Use, 2018 to 2023

Figure 23: Global Market Volume (Units) Analysis by End Use, 2018 to 2023

Figure 24: Global Market Value Share (%) and BPS Analysis by End Use, 2023 to 2033

Figure 25: Global Market Y-o-Y Growth (%) Projections by End Use, 2023 to 2033

Figure 26: Global Market Attractiveness by Capacity, 2023 to 2033

Figure 27: Global Market Attractiveness by Bag Type, 2023 to 2033

Figure 28: Global Market Attractiveness by Bag Design, 2023 to 2033

Figure 29: Global Market Attractiveness by End Use, 2023 to 2033

Figure 30: Global Market Attractiveness by Region, 2023 to 2033

Figure 31: North America Market Value (US$ Million) by Capacity, 2023 to 2033

Figure 32: North America Market Value (US$ Million) by Bag Type, 2023 to 2033

Figure 33: North America Market Value (US$ Million) by Bag Design, 2023 to 2033

Figure 34: North America Market Value (US$ Million) by End Use, 2023 to 2033

Figure 35: North America Market Value (US$ Million) by Country, 2023 to 2033

Figure 36: North America Market Value (US$ Million) Analysis by Country, 2018 to 2023

Figure 37: North America Market Volume (Units) Analysis by Country, 2018 to 2023

Figure 38: North America Market Value Share (%) and BPS Analysis by Country, 2023 to 2033

Figure 39: North America Market Y-o-Y Growth (%) Projections by Country, 2023 to 2033

Figure 40: North America Market Value (US$ Million) Analysis by Capacity, 2018 to 2023

Figure 41: North America Market Volume (Units) Analysis by Capacity, 2018 to 2023

Figure 42: North America Market Value Share (%) and BPS Analysis by Capacity, 2023 to 2033

Figure 43: North America Market Y-o-Y Growth (%) Projections by Capacity, 2023 to 2033

Figure 44: North America Market Value (US$ Million) Analysis by Bag Type, 2018 to 2023

Figure 45: North America Market Volume (Units) Analysis by Bag Type, 2018 to 2023

Figure 46: North America Market Value Share (%) and BPS Analysis by Bag Type, 2023 to 2033

Figure 47: North America Market Y-o-Y Growth (%) Projections by Bag Type, 2023 to 2033

Figure 48: North America Market Value (US$ Million) Analysis by Bag Design, 2018 to 2023

Figure 49: North America Market Volume (Units) Analysis by Bag Design, 2018 to 2023

Figure 50: North America Market Value Share (%) and BPS Analysis by Bag Design, 2023 to 2033

Figure 51: North America Market Y-o-Y Growth (%) Projections by Bag Design, 2023 to 2033

Figure 52: North America Market Value (US$ Million) Analysis by End Use, 2018 to 2023

Figure 53: North America Market Volume (Units) Analysis by End Use, 2018 to 2023

Figure 54: North America Market Value Share (%) and BPS Analysis by End Use, 2023 to 2033

Figure 55: North America Market Y-o-Y Growth (%) Projections by End Use, 2023 to 2033

Figure 56: North America Market Attractiveness by Capacity, 2023 to 2033

Figure 57: North America Market Attractiveness by Bag Type, 2023 to 2033

Figure 58: North America Market Attractiveness by Bag Design, 2023 to 2033

Figure 59: North America Market Attractiveness by End Use, 2023 to 2033

Figure 60: North America Market Attractiveness by Country, 2023 to 2033

Figure 61: Latin America Market Value (US$ Million) by Capacity, 2023 to 2033

Figure 62: Latin America Market Value (US$ Million) by Bag Type, 2023 to 2033

Figure 63: Latin America Market Value (US$ Million) by Bag Design, 2023 to 2033

Figure 64: Latin America Market Value (US$ Million) by End Use, 2023 to 2033

Figure 65: Latin America Market Value (US$ Million) by Country, 2023 to 2033

Figure 66: Latin America Market Value (US$ Million) Analysis by Country, 2018 to 2023

Figure 67: Latin America Market Volume (Units) Analysis by Country, 2018 to 2023

Figure 68: Latin America Market Value Share (%) and BPS Analysis by Country, 2023 to 2033

Figure 69: Latin America Market Y-o-Y Growth (%) Projections by Country, 2023 to 2033

Figure 70: Latin America Market Value (US$ Million) Analysis by Capacity, 2018 to 2023

Figure 71: Latin America Market Volume (Units) Analysis by Capacity, 2018 to 2023

Figure 72: Latin America Market Value Share (%) and BPS Analysis by Capacity, 2023 to 2033

Figure 73: Latin America Market Y-o-Y Growth (%) Projections by Capacity, 2023 to 2033

Figure 74: Latin America Market Value (US$ Million) Analysis by Bag Type, 2018 to 2023

Figure 75: Latin America Market Volume (Units) Analysis by Bag Type, 2018 to 2023

Figure 76: Latin America Market Value Share (%) and BPS Analysis by Bag Type, 2023 to 2033

Figure 77: Latin America Market Y-o-Y Growth (%) Projections by Bag Type, 2023 to 2033

Figure 78: Latin America Market Value (US$ Million) Analysis by Bag Design, 2018 to 2023

Figure 79: Latin America Market Volume (Units) Analysis by Bag Design, 2018 to 2023

Figure 80: Latin America Market Value Share (%) and BPS Analysis by Bag Design, 2023 to 2033

Figure 81: Latin America Market Y-o-Y Growth (%) Projections by Bag Design, 2023 to 2033

Figure 82: Latin America Market Value (US$ Million) Analysis by End Use, 2018 to 2023

Figure 83: Latin America Market Volume (Units) Analysis by End Use, 2018 to 2023

Figure 84: Latin America Market Value Share (%) and BPS Analysis by End Use, 2023 to 2033

Figure 85: Latin America Market Y-o-Y Growth (%) Projections by End Use, 2023 to 2033

Figure 86: Latin America Market Attractiveness by Capacity, 2023 to 2033

Figure 87: Latin America Market Attractiveness by Bag Type, 2023 to 2033

Figure 88: Latin America Market Attractiveness by Bag Design, 2023 to 2033

Figure 89: Latin America Market Attractiveness by End Use, 2023 to 2033

Figure 90: Latin America Market Attractiveness by Country, 2023 to 2033

Figure 91: Western Europe Market Value (US$ Million) by Capacity, 2023 to 2033

Figure 92: Western Europe Market Value (US$ Million) by Bag Type, 2023 to 2033

Figure 93: Western Europe Market Value (US$ Million) by Bag Design, 2023 to 2033

Figure 94: Western Europe Market Value (US$ Million) by End Use, 2023 to 2033

Figure 95: Western Europe Market Value (US$ Million) by Country, 2023 to 2033

Figure 96: Western Europe Market Value (US$ Million) Analysis by Country, 2018 to 2023

Figure 97: Western Europe Market Volume (Units) Analysis by Country, 2018 to 2023

Figure 98: Western Europe Market Value Share (%) and BPS Analysis by Country, 2023 to 2033

Figure 99: Western Europe Market Y-o-Y Growth (%) Projections by Country, 2023 to 2033

Figure 100: Western Europe Market Value (US$ Million) Analysis by Capacity, 2018 to 2023

Figure 101: Western Europe Market Volume (Units) Analysis by Capacity, 2018 to 2023

Figure 102: Western Europe Market Value Share (%) and BPS Analysis by Capacity, 2023 to 2033

Figure 103: Western Europe Market Y-o-Y Growth (%) Projections by Capacity, 2023 to 2033

Figure 104: Western Europe Market Value (US$ Million) Analysis by Bag Type, 2018 to 2023

Figure 105: Western Europe Market Volume (Units) Analysis by Bag Type, 2018 to 2023

Figure 106: Western Europe Market Value Share (%) and BPS Analysis by Bag Type, 2023 to 2033

Figure 107: Western Europe Market Y-o-Y Growth (%) Projections by Bag Type, 2023 to 2033

Figure 108: Western Europe Market Value (US$ Million) Analysis by Bag Design, 2018 to 2023

Figure 109: Western Europe Market Volume (Units) Analysis by Bag Design, 2018 to 2023

Figure 110: Western Europe Market Value Share (%) and BPS Analysis by Bag Design, 2023 to 2033

Figure 111: Western Europe Market Y-o-Y Growth (%) Projections by Bag Design, 2023 to 2033

Figure 112: Western Europe Market Value (US$ Million) Analysis by End Use, 2018 to 2023

Figure 113: Western Europe Market Volume (Units) Analysis by End Use, 2018 to 2023

Figure 114: Western Europe Market Value Share (%) and BPS Analysis by End Use, 2023 to 2033

Figure 115: Western Europe Market Y-o-Y Growth (%) Projections by End Use, 2023 to 2033

Figure 116: Western Europe Market Attractiveness by Capacity, 2023 to 2033

Figure 117: Western Europe Market Attractiveness by Bag Type, 2023 to 2033

Figure 118: Western Europe Market Attractiveness by Bag Design, 2023 to 2033

Figure 119: Western Europe Market Attractiveness by End Use, 2023 to 2033

Figure 120: Western Europe Market Attractiveness by Country, 2023 to 2033

Figure 121: Eastern Europe Market Value (US$ Million) by Capacity, 2023 to 2033

Figure 122: Eastern Europe Market Value (US$ Million) by Bag Type, 2023 to 2033

Figure 123: Eastern Europe Market Value (US$ Million) by Bag Design, 2023 to 2033

Figure 124: Eastern Europe Market Value (US$ Million) by End Use, 2023 to 2033

Figure 125: Eastern Europe Market Value (US$ Million) by Country, 2023 to 2033

Figure 126: Eastern Europe Market Value (US$ Million) Analysis by Country, 2018 to 2023

Figure 127: Eastern Europe Market Volume (Units) Analysis by Country, 2018 to 2023

Figure 128: Eastern Europe Market Value Share (%) and BPS Analysis by Country, 2023 to 2033

Figure 129: Eastern Europe Market Y-o-Y Growth (%) Projections by Country, 2023 to 2033

Figure 130: Eastern Europe Market Value (US$ Million) Analysis by Capacity, 2018 to 2023

Figure 131: Eastern Europe Market Volume (Units) Analysis by Capacity, 2018 to 2023

Figure 132: Eastern Europe Market Value Share (%) and BPS Analysis by Capacity, 2023 to 2033

Figure 133: Eastern Europe Market Y-o-Y Growth (%) Projections by Capacity, 2023 to 2033

Figure 134: Eastern Europe Market Value (US$ Million) Analysis by Bag Type, 2018 to 2023

Figure 135: Eastern Europe Market Volume (Units) Analysis by Bag Type, 2018 to 2023

Figure 136: Eastern Europe Market Value Share (%) and BPS Analysis by Bag Type, 2023 to 2033

Figure 137: Eastern Europe Market Y-o-Y Growth (%) Projections by Bag Type, 2023 to 2033

Figure 138: Eastern Europe Market Value (US$ Million) Analysis by Bag Design, 2018 to 2023

Figure 139: Eastern Europe Market Volume (Units) Analysis by Bag Design, 2018 to 2023

Figure 140: Eastern Europe Market Value Share (%) and BPS Analysis by Bag Design, 2023 to 2033

Figure 141: Eastern Europe Market Y-o-Y Growth (%) Projections by Bag Design, 2023 to 2033

Figure 142: Eastern Europe Market Value (US$ Million) Analysis by End Use, 2018 to 2023

Figure 143: Eastern Europe Market Volume (Units) Analysis by End Use, 2018 to 2023

Figure 144: Eastern Europe Market Value Share (%) and BPS Analysis by End Use, 2023 to 2033

Figure 145: Eastern Europe Market Y-o-Y Growth (%) Projections by End Use, 2023 to 2033

Figure 146: Eastern Europe Market Attractiveness by Capacity, 2023 to 2033

Figure 147: Eastern Europe Market Attractiveness by Bag Type, 2023 to 2033

Figure 148: Eastern Europe Market Attractiveness by Bag Design, 2023 to 2033

Figure 149: Eastern Europe Market Attractiveness by End Use, 2023 to 2033

Figure 150: Eastern Europe Market Attractiveness by Country, 2023 to 2033

Figure 151: South Asia and Pacific Market Value (US$ Million) by Capacity, 2023 to 2033

Figure 152: South Asia and Pacific Market Value (US$ Million) by Bag Type, 2023 to 2033

Figure 153: South Asia and Pacific Market Value (US$ Million) by Bag Design, 2023 to 2033

Figure 154: South Asia and Pacific Market Value (US$ Million) by End Use, 2023 to 2033

Figure 155: South Asia and Pacific Market Value (US$ Million) by Country, 2023 to 2033

Figure 156: South Asia and Pacific Market Value (US$ Million) Analysis by Country, 2018 to 2023

Figure 157: South Asia and Pacific Market Volume (Units) Analysis by Country, 2018 to 2023

Figure 158: South Asia and Pacific Market Value Share (%) and BPS Analysis by Country, 2023 to 2033

Figure 159: South Asia and Pacific Market Y-o-Y Growth (%) Projections by Country, 2023 to 2033

Figure 160: South Asia and Pacific Market Value (US$ Million) Analysis by Capacity, 2018 to 2023

Figure 161: South Asia and Pacific Market Volume (Units) Analysis by Capacity, 2018 to 2023

Figure 162: South Asia and Pacific Market Value Share (%) and BPS Analysis by Capacity, 2023 to 2033

Figure 163: South Asia and Pacific Market Y-o-Y Growth (%) Projections by Capacity, 2023 to 2033

Figure 164: South Asia and Pacific Market Value (US$ Million) Analysis by Bag Type, 2018 to 2023

Figure 165: South Asia and Pacific Market Volume (Units) Analysis by Bag Type, 2018 to 2023

Figure 166: South Asia and Pacific Market Value Share (%) and BPS Analysis by Bag Type, 2023 to 2033

Figure 167: South Asia and Pacific Market Y-o-Y Growth (%) Projections by Bag Type, 2023 to 2033

Figure 168: South Asia and Pacific Market Value (US$ Million) Analysis by Bag Design, 2018 to 2023

Figure 169: South Asia and Pacific Market Volume (Units) Analysis by Bag Design, 2018 to 2023

Figure 170: South Asia and Pacific Market Value Share (%) and BPS Analysis by Bag Design, 2023 to 2033

Figure 171: South Asia and Pacific Market Y-o-Y Growth (%) Projections by Bag Design, 2023 to 2033

Figure 172: South Asia and Pacific Market Value (US$ Million) Analysis by End Use, 2018 to 2023

Figure 173: South Asia and Pacific Market Volume (Units) Analysis by End Use, 2018 to 2023

Figure 174: South Asia and Pacific Market Value Share (%) and BPS Analysis by End Use, 2023 to 2033

Figure 175: South Asia and Pacific Market Y-o-Y Growth (%) Projections by End Use, 2023 to 2033

Figure 176: South Asia and Pacific Market Attractiveness by Capacity, 2023 to 2033

Figure 177: South Asia and Pacific Market Attractiveness by Bag Type, 2023 to 2033

Figure 178: South Asia and Pacific Market Attractiveness by Bag Design, 2023 to 2033

Figure 179: South Asia and Pacific Market Attractiveness by End Use, 2023 to 2033

Figure 180: South Asia and Pacific Market Attractiveness by Country, 2023 to 2033

Figure 181: East Asia Market Value (US$ Million) by Capacity, 2023 to 2033

Figure 182: East Asia Market Value (US$ Million) by Bag Type, 2023 to 2033

Figure 183: East Asia Market Value (US$ Million) by Bag Design, 2023 to 2033

Figure 184: East Asia Market Value (US$ Million) by End Use, 2023 to 2033

Figure 185: East Asia Market Value (US$ Million) by Country, 2023 to 2033

Figure 186: East Asia Market Value (US$ Million) Analysis by Country, 2018 to 2023

Figure 187: East Asia Market Volume (Units) Analysis by Country, 2018 to 2023

Figure 188: East Asia Market Value Share (%) and BPS Analysis by Country, 2023 to 2033

Figure 189: East Asia Market Y-o-Y Growth (%) Projections by Country, 2023 to 2033

Figure 190: East Asia Market Value (US$ Million) Analysis by Capacity, 2018 to 2023

Figure 191: East Asia Market Volume (Units) Analysis by Capacity, 2018 to 2023

Figure 192: East Asia Market Value Share (%) and BPS Analysis by Capacity, 2023 to 2033

Figure 193: East Asia Market Y-o-Y Growth (%) Projections by Capacity, 2023 to 2033

Figure 194: East Asia Market Value (US$ Million) Analysis by Bag Type, 2018 to 2023

Figure 195: East Asia Market Volume (Units) Analysis by Bag Type, 2018 to 2023

Figure 196: East Asia Market Value Share (%) and BPS Analysis by Bag Type, 2023 to 2033

Figure 197: East Asia Market Y-o-Y Growth (%) Projections by Bag Type, 2023 to 2033

Figure 198: East Asia Market Value (US$ Million) Analysis by Bag Design, 2018 to 2023

Figure 199: East Asia Market Volume (Units) Analysis by Bag Design, 2018 to 2023

Figure 200: East Asia Market Value Share (%) and BPS Analysis by Bag Design, 2023 to 2033

Figure 201: East Asia Market Y-o-Y Growth (%) Projections by Bag Design, 2023 to 2033

Figure 202: East Asia Market Value (US$ Million) Analysis by End Use, 2018 to 2023

Figure 203: East Asia Market Volume (Units) Analysis by End Use, 2018 to 2023

Figure 204: East Asia Market Value Share (%) and BPS Analysis by End Use, 2023 to 2033

Figure 205: East Asia Market Y-o-Y Growth (%) Projections by End Use, 2023 to 2033

Figure 206: East Asia Market Attractiveness by Capacity, 2023 to 2033

Figure 207: East Asia Market Attractiveness by Bag Type, 2023 to 2033

Figure 208: East Asia Market Attractiveness by Bag Design, 2023 to 2033

Figure 209: East Asia Market Attractiveness by End Use, 2023 to 2033

Figure 210: East Asia Market Attractiveness by Country, 2023 to 2033

Figure 211: Middle East and Africa Market Value (US$ Million) by Capacity, 2023 to 2033

Figure 212: Middle East and Africa Market Value (US$ Million) by Bag Type, 2023 to 2033

Figure 213: Middle East and Africa Market Value (US$ Million) by Bag Design, 2023 to 2033

Figure 214: Middle East and Africa Market Value (US$ Million) by End Use, 2023 to 2033

Figure 215: Middle East and Africa Market Value (US$ Million) by Country, 2023 to 2033

Figure 216: Middle East and Africa Market Value (US$ Million) Analysis by Country, 2018 to 2023

Figure 217: Middle East and Africa Market Volume (Units) Analysis by Country, 2018 to 2023

Figure 218: Middle East and Africa Market Value Share (%) and BPS Analysis by Country, 2023 to 2033

Figure 219: Middle East and Africa Market Y-o-Y Growth (%) Projections by Country, 2023 to 2033

Figure 220: Middle East and Africa Market Value (US$ Million) Analysis by Capacity, 2018 to 2023

Figure 221: Middle East and Africa Market Volume (Units) Analysis by Capacity, 2018 to 2023

Figure 222: Middle East and Africa Market Value Share (%) and BPS Analysis by Capacity, 2023 to 2033

Figure 223: Middle East and Africa Market Y-o-Y Growth (%) Projections by Capacity, 2023 to 2033

Figure 224: Middle East and Africa Market Value (US$ Million) Analysis by Bag Type, 2018 to 2023

Figure 225: Middle East and Africa Market Volume (Units) Analysis by Bag Type, 2018 to 2023

Figure 226: Middle East and Africa Market Value Share (%) and BPS Analysis by Bag Type, 2023 to 2033

Figure 227: Middle East and Africa Market Y-o-Y Growth (%) Projections by Bag Type, 2023 to 2033

Figure 228: Middle East and Africa Market Value (US$ Million) Analysis by Bag Design, 2018 to 2023

Figure 229: Middle East and Africa Market Volume (Units) Analysis by Bag Design, 2018 to 2023

Figure 230: Middle East and Africa Market Value Share (%) and BPS Analysis by Bag Design, 2023 to 2033

Figure 231: Middle East and Africa Market Y-o-Y Growth (%) Projections by Bag Design, 2023 to 2033

Figure 232: Middle East and Africa Market Value (US$ Million) Analysis by End Use, 2018 to 2023

Figure 233: Middle East and Africa Market Volume (Units) Analysis by End Use, 2018 to 2023

Figure 234: Middle East and Africa Market Value Share (%) and BPS Analysis by End Use, 2023 to 2033

Figure 235: Middle East and Africa Market Y-o-Y Growth (%) Projections by End Use, 2023 to 2033

Figure 236: Middle East and Africa Market Attractiveness by Capacity, 2023 to 2033

Figure 237: Middle East and Africa Market Attractiveness by Bag Type, 2023 to 2033

Figure 238: Middle East and Africa Market Attractiveness by Bag Design, 2023 to 2033

Figure 239: Middle East and Africa Market Attractiveness by End Use, 2023 to 2033

Figure 240: Middle East and Africa Market Attractiveness by Country, 2023 to 2033

Frequently Asked Questions

What is the Global PP Jumbo Bag Market Size?

The global PP jumbo bag market is expected to reach a valuation of USD 8.2 billion in 2023.

At What Rate Did the Global PP Jumbo Bag Market Grow Between 2018 and 2022?

The global market recorded a steady 3.9% CAGR between 2018 and 2022.

What are the Key Trends Boosting PP Jumbo Bag Sales?

Surging demand for sustainable packaging solutions and ongoing expansion of the chemicals and pharmaceutical sectors.

What is the Outlook of India PP Jumbo Bag Market?

The market in India is anticipated to grow at a rate of 6.3% from 2023 to 2033.

What is the Market Share for Type C Bags in the PP Jumbo Bag Market?

The market share for Type C bags in the market is 41.3%.

Explore Similar Insights

Future Market Insights

PP Jumbo Bag Market