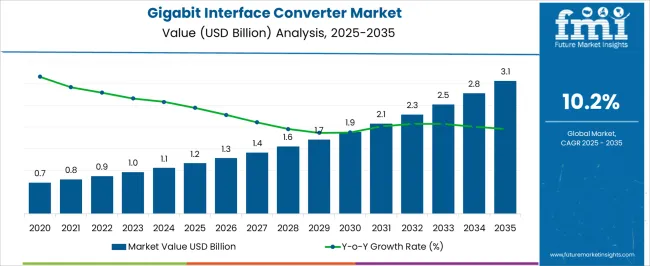
The Gigabit Interface Converter Market is estimated to be valued at USD 1.2 billion in 2025 and is projected to reach USD 3.1 billion by 2035, registering a compound annual growth rate (CAGR) of 10.2% over the forecast period.
| Metric | Value |
|---|---|
| Gigabit Interface Converter Market Estimated Value in (2025 E) | USD 1.2 billion |
| Gigabit Interface Converter Market Forecast Value in (2035 F) | USD 3.1 billion |
| Forecast CAGR (2025 to 2035) | 10.2% |
The gigabit interface converter (GBIC) market is gaining steady momentum, supported by the increasing demand for reliable high-speed data transmission across industrial and enterprise networks. Industry publications and technology reports have underlined the critical role of GBIC modules in expanding fiber optic connectivity, particularly in industries requiring secure and uninterrupted communication systems.
Rising data consumption, automation in industrial processes, and the adoption of advanced monitoring technologies have reinforced the importance of scalable network infrastructure. Oil & gas, energy, and telecom operators have increasingly integrated GBIC modules to handle data-heavy applications in harsh environments, ensuring operational efficiency and safety.
Press releases from component manufacturers have also highlighted ongoing innovation in module design, offering higher bandwidth efficiency and improved durability. Looking ahead, the market is expected to benefit from the expansion of smart infrastructure, the transition to Industry 4.0, and growing reliance on fiber optics to meet low-latency and high-capacity communication requirements. Segmental growth is anticipated to be led by oil & gas applications and single-mode GBIC modules due to their ability to deliver high-performance connectivity over long distances.
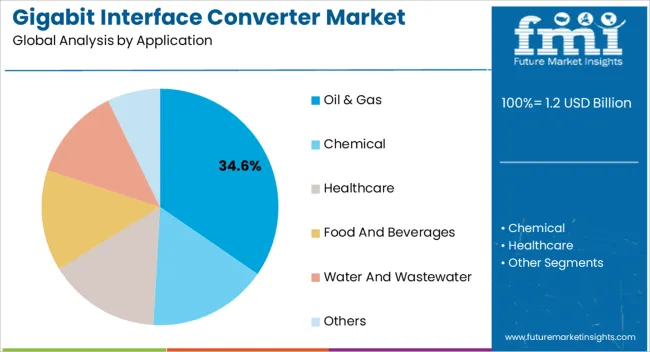
The Oil & Gas segment is projected to hold 34.60% of the gigabit interface converter market revenue in 2025, reflecting its leading position among application areas. Growth in this segment has been driven by the increasing adoption of digital technologies in exploration, drilling, and production activities, which demand robust and secure data transmission solutions.
GBIC modules have been utilized in pipeline monitoring, seismic data analysis, and offshore communication systems where long-distance and high-bandwidth transmission are critical. The segment’s strength has also been supported by the growing importance of real-time data for predictive maintenance, safety management, and operational optimization in oilfield operations.
Additionally, the harsh environmental conditions of oil & gas sites have emphasized the need for durable and reliable optical connectivity, further reinforcing the adoption of GBIC solutions. As energy companies continue investing in digital oilfield technologies and IoT integration, the Oil & Gas segment is expected to remain a major contributor to the market’s growth.
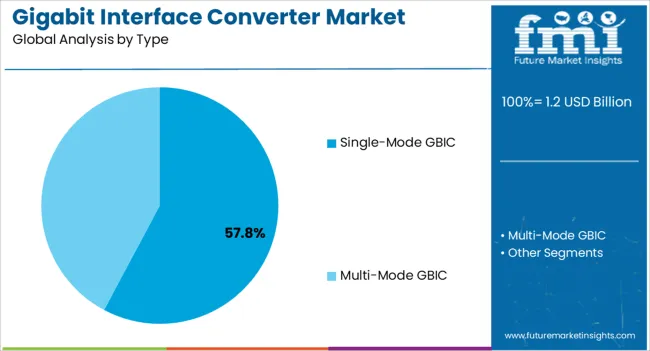
The Single-Mode GBIC segment is projected to account for 57.80% of the gigabit interface converter market revenue in 2025, securing its position as the leading type segment. This dominance has been attributed to the capability of single-mode modules to support long-distance transmission with minimal signal loss, making them essential for industries and enterprises operating across geographically dispersed sites.
Telecommunications, energy, and industrial sectors have increasingly relied on single-mode GBIC modules for applications that demand high-speed connectivity over extended distances. The segment has also benefited from improvements in fiber optic infrastructure, as well as the cost-effectiveness of deploying single-mode solutions for backbone networks.
Industry reports have emphasized the scalability and energy efficiency of single-mode GBICs, which align with the rising need for sustainable and future-proof communication systems. With expanding adoption of high-capacity data networks and growing reliance on fiber optics for mission-critical applications, the Single-Mode GBIC segment is expected to sustain its leadership in the market.
Most organizations prefer efficient backup operations, which has driven the demand for gigabit interface converters in recent years. In addition, many large and small enterprises opting for cost-effective solutions are expected to encourage the growth of the global gigabit interface converter market. Increasing spending in the IT sector in emerging economies is also expected to positively impact the global market share during the forecast period.
Gigabit interface converter minimizes downtime during replacements, enabling hot swap and plug-and-play functionality. The Gigabit interface converter is not obsolete but has been gradually replaced by a compact, smaller, and more lightweight version in recent years.
The high cost of the gigabit interface converter and the associated standardization issue are some of the major challenges vendors face. These challenges may further affect the market growth during the forecast period.
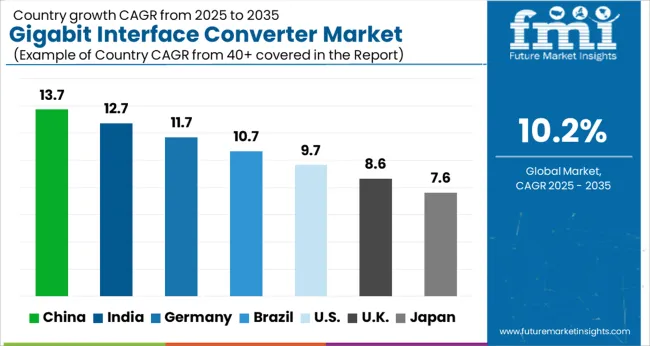
Based on geography, the gigabit interface converter market is segmented into North America, Europe, Asia-Pacific, Latin America, and MEA. North America is likely to dominate the market by acquiring maximum revenue by securing the highest share of 32.1% during the forecast period. Due to rising technology, demand for bandwidth, and growing fiber optic cable by several end-use industries in recent years. The United States is the leading country lifting the market size due to its well-established infrastructure.
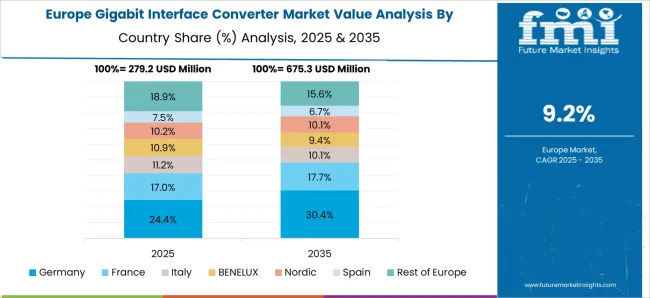
Europe is likely to stand in the second position after North America by acquiring 24.3% of the share during the forecast period. Rising demand for the internet, increasing data centers, and growing investment in telecom industries are accelerating the region's gigabit interface converter market growth. The United Kingdom & Germany are the leading countries that lift the market size due to deploying 5G networks and increasing infrastructure.
Based on type, the gigabit interface converter market is further divided into categories such as multi-mode gigabit interface converter and single-mode gigabit interface converter. The multi-mode gigabit interface converter dominates the market due to the support of several physical channels with a single ethernet. Several end-use industries widely adopt it as it provides internal and external varieties.
The demand for multi-mode gigabit interface converters has been rising due to their compact size and reliable cost in recent years. On the other hand, the single-mode gigabit interface converter also provides a better range than the multi-mode gigabit interface converter. Furthermore, it is wireless and suitable to install in tight spaces, which has fueled the demand for single-mode gigabit converters by end-users in recent years.
Key Players’ Strategies in Achieving Their Goals in the Gigabit Interface Converter Market
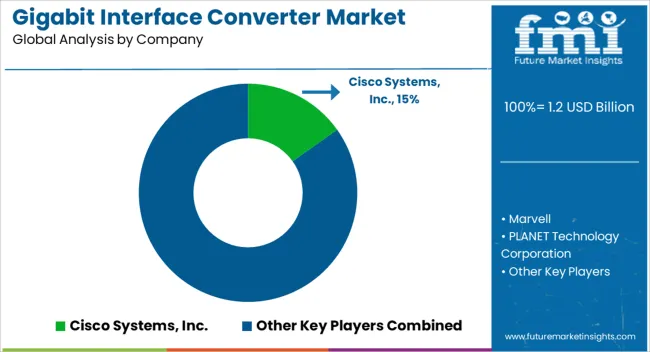
The number of key players consolidates the gigabit interface converter market presence all around the globe. These players are driving the sales of gigabit interface converters with their innovative marketing tactics. The key players are developing their services by tapping into new markets. Some common methodologies that gigabit interface converter vendors adopt are mergers, acquisitions, partnerships, and others.
Over the last decade, key manufacturers have rapidly boosted the innovation and development of gigabit interface converters. Moreover, they are carrying out various mergers and partnerships with IT companies to expand the market with new development in the coming years.
| Attribute | Details |
|---|---|
| PLANET Technology Corporation | PLANET Technology Corporation is a Taiwanese networking equipment manufacturer. PLANET GBICs are well-known for their exceptional quality and low costs. The PLANET PG-8112-GE GBIC, for example, is a high-quality GBIC that supports speeds of up to 1 Gbps and is reasonably priced. |
| D-Link | D-Link is a global networking equipment leader that also sells GBICs. D-Link GBICs are well-known for their simplicity of use and interoperability with a wide range of devices. The D-Link DGS-1008D GBIC, for example, is a simple GBIC that is compatible with a wide range of switches and routers. |
| Hewlett-Packard Development Company (HP) | Hewlett-Packard Development Company (HP) is a multinational technological company that manufactures GBICs. HP GBICs are well-known for their high performance and dependability. The HP 552064-B21 GBIC, for example, is a high-performance GBIC that supports rates of up to 1 Gbps. |
Recent Developments
| Report Attribute | Details |
|---|---|
| Growth Rate 2025 to 2035 | CAGR of 10.2% |
| Base Year for Estimation | 2025 |
| Historical Data | 2020 to 2025 |
| Forecast Period | 2025 to 2035 |
| Quantitative Units | Revenue in USD million and CAGR from 2025 to 2035 |
| Report Coverage | Revenue Forecast, Volume Forecast, Company, Ranking, Competitive Landscape, Growth Factors, Trends, Pricing Analysis |
| Segments Covered | Application, Type, Region |
| Regions Covered | North America; Latin America; Europe; East Asia; South Asia; Oceania; Middle East and Africa |
| Key Countries Profiled | United States, Canada, Brazil, Argentina, Germany, United Kingdom, France, Spain, Italy, Nordics, BENELUX, Australia & New Zealand, China, India, ASEAN, GCC, South Africa |
| Key Companies Profiled | Cisco Systems, Inc.; Marvell; PLANET Technology Corporation; CELLO; D-Link (Europe) Ltd.; Oracle; Hewlett-Packard Development Company; L.P.; Allied Telesis, Inc.; NETGEAR; Moog Inc. |
| Customization | Available Upon Request |
The global gigabit interface converter market is estimated to be valued at USD 1.2 billion in 2025.
The market size for the gigabit interface converter market is projected to reach USD 3.1 billion by 2035.
The gigabit interface converter market is expected to grow at a 10.2% CAGR between 2025 and 2035.
The key product types in gigabit interface converter market are oil & gas, chemical, healthcare, food and beverages, water and wastewater and others.
In terms of type, single-mode gbic segment to command 57.8% share in the gigabit interface converter market in 2025.


Full Research Suite comprises of:
Market outlook & trends analysis
Interviews & case studies
Strategic recommendations
Vendor profiles & capabilities analysis
5-year forecasts
8 regions and 60+ country-level data splits
Market segment data splits
12 months of continuous data updates
DELIVERED AS:
PDF EXCEL ONLINE
Gigabit Passive Optical Network (GPON) Market Size and Share Forecast Outlook 2025 to 2035
Gigabit Passive Optical Network Equipment Market Size and Share Forecast Outlook 2025 to 2035
Gigabit Wi-Fi Access Point Market Analysis – Size, Trends & Forecast 2024-2034
Wireless Gigabit Market Growth - Trends & Industry Forecast 2025 to 2035
Interface IC Market Size and Share Forecast Outlook 2025 to 2035
AS-Interface Market Growth - Size, Demand & Forecast 2025 to 2035
Heat Interface Unit Market Analysis - Size, Demand & Forecast 2025 to 2035
Wired Interface Market Trends – Size, Demand & Forecast 2025 to 2035
Thermal Interface Material Market Analysis - Size, Share, and Forecast Outlook 2025 to 2035
Thermal Interface Pads and Materials Market Growth - Trends, Analysis & Forecast by Type, product, Application and Region through 2035
Aircraft Interface Device Market Size and Share Forecast Outlook 2025 to 2035
Human Machine Interface Market
Brain-Computer Interface Implant Market Analysis Size and Share Forecast Outlook 2025 to 2035
Brain Computing Interfaces Market Size and Share Forecast Outlook 2025 to 2035
Datacenter Grid Interface Equipment Market Analysis - Size, Share, and Forecast Outlook 2025 to 2035
Collaborative Customer Interfaces Market Analysis and Forecast 2025 to 2035, By Deployment Type, Type of User, End Use, and Region
Application Programming Interface (API) Security Market Size and Share Forecast Outlook 2025 to 2035
Automotive Human-Machine Interface (HMI) Market Analysis 2020 to 2024 and Forecast 2025 to 2035, By Type, Technology, End Users, and Region
Industrial Human-Machine Interface Market
Intelligent Platform Management Interface (IPMI) Market Size and Share Forecast Outlook 2025 to 2035

Thank you!
You will receive an email from our Business Development Manager. Please be sure to check your SPAM/JUNK folder too.
Chat With
MaRIA