Reports

- Global Locations -

Headquarters

Future Market Insights, Inc.

Christiana Corporate, 200
Continental Drive, Suite 401,
Newark, Delaware - 19713,
United States

T: +1-845-579-5705

Americas

Future Market Insights, Inc.

616 Corporate Way, Suite 2-9018,
Valley Cottage, NY 10989, United States

T: +1-347-918-3531

MEA

Future Market Insights

1602-6 Jumeirah Bay X2 Tower, Plot No: JLT-PH2-X2A,
Jumeirah Lakes Towers, Dubai,
United Arab Emirates

Europe

Future Market Insights

3rd Floor, 207 Regent Street,
W1B 3HH London
United Kingdom

T: + 44 (0) 20 8123 9659
D: +44 (0) 20 3287 4268

Asia Pacific

Future Market Insights

IndiaLand Global Tech Park, Unit UG-1, Behind Grand HighStreet, Phase 1, Hinjawadi, MH, Pune – 411057, India

Concrete Admixture Market Outlook (2022-2032)

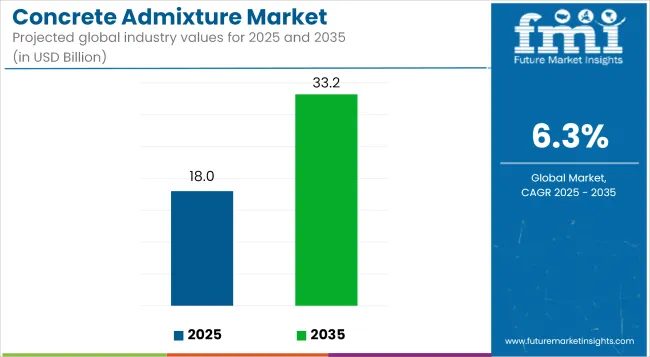
[220 Pages Report] The global demand for concrete admixture is expected to rise at a healthy CAGR of 6.1% per year to US$ 15.1 billion in 2022, supported by the following:

  • An increase in construction activities primarily used to improve concrete properties during construction.
  • With The rising demand for products from the construction industry, admixtures have several favourable properties, including reduced water absorption, durability, and rust resistance.
  • An increasing number of commercial and residential construction projects are taking place, as well as the commissioning of infrastructural projects, particularly in the Asia Pacific region, contributing to this growth.
Attributes Key Statistics
Global Concrete Admixture Market Estimated Size (2022E) US$ 15.1 Billion
Projected Market Valuation (2032F) US$ 27.4 Billion
Value-based CAGR (2022 - 2032) 6.1%
Collective Value Share: Top 3 Countries (2022E) 51%

Don't pay for what you don't need

Customize your report by selecting specific countries or regions and save 30%!

Construction Activities In China To Remain Key To Opportunities

In the coming years, the residential requirements are expected to grow as a result of a growing middle class and government initiatives such as stricter requirements for contractor quality.

Several infrastructure development programs are expected to be undertaken in India, including the development of a home for every citizen (India Vision 2020, Planning Commission of India), the development of transportation infrastructure, and the creation of new megacities both in India and China.

This is likely to open up new opportunities for the concrete admixture market in the future. As a result of increasing prices of concrete admixtures chemicals coupled with a lack of awareness about the advantages of admixtures amongst the unorganized construction sector in the Asia Pacific and other developing regions, this has led to a lack of expansion of the concrete admixture market.

Concrete Admixture Market

Asia Pacific Retains Its Fastest-Growing-Market Title

CAGR for the concrete admixtures market in the Asia Pacific region during the forecast period is expected to grow at the fastest rate. Rapid urbanization in the region is driving the growth of the concrete admixtures market. As a result of increasing government and private sector investments in infrastructure development, the construction market can be boosted.

Countries like India and China are expected to lead the construction industry's demand for concrete admixtures in the Asia Pacific region. Therefore, the construction industry has a huge potential for concrete admixtures.

Nikhil Kaitwade
Nikhil Kaitwade

Principal Consultant

Talk to Analyst

Find your sweet spots for generating winning opportunities in this market.

Commercial Construction Strives To Be An Opportunity To Cash In On In Europe

Europe is another prominent and leading regional market that accounts for a majority of the demand for concrete admixtures in the global market. In the Europe concrete admixtures market, the growth is being driven by the increased adoption of these solutions in the global concrete admixtures market in the commercial construction process.

Product Launches And Product Expansions Remain Regular Episodes In The Market

The concrete admixture market remains influenced by the effect of the waves of innovation brought in by key players. Players work on unique additives that can significantly increase concrete strength, durability, and compressive and flexural strength.

In this technology, synthetically manufactured crystalline calcium silicate hydrate (CSH) nanoparticles are suspended in a stable suspension to help CSH crystals to form between cement grains and to increase the moisture content of Portland cement.

While organic growth strategies are employed to capture the attention of end users, inorganic growth strategies are used by companies to capture a significant market share.

For instance, it has been reported that a CEMEX subsidiary, S.A.B. de C.V., entered into an agreement in January 2020 with Breedon Group (Breedon) to sell certain assets in the United Kingdom for a total price of approximately USD 235 million, which includes approximately USD 31 million in debt.

As a result of the sale of the active assets, 49 ready-mix plants, 28 aggregate quarries, four depots, one cement terminal, 14 asphalt plants, and four concrete products enterprises have been sold.

In addition, in December 2019, BASF and a subsidiary of Lone Star Partners, a global private equity firm, entered into a purchase agreement for BASF's Construction Chemicals business. On a cash-free basis, the purchase price amounts to EUR 3.17 billion.

According to a new research study published by Future Market Insights, the global concrete admixture market is anticipated to hold around 36.1% of the global construction chemicals market in the evaluation period.

Get the data you need at a Fraction of the cost

Personalize your report by choosing insights you need
and save 40%!

2017-2021 Concrete Admixture Demand Outlook Compared to 2022-2032 Forecast

Demand for concrete admixture grew at 5.2% CAGR between 2017 and 2021 and it is set to grow at a steady pace depending on the number of construction activities in various countries. Construction activities are likely to depend on a particular country’s investments in infrastructure development plans and the number of projects initiated by government bodies.

The global concrete admixture market is projected to showcase substantial growth at a CAGR of 6.1% over the assessment period. Increased need for novel infrastructures in emerging countries, rapid urbanization, and rising government initiatives to enhance the residential sector are expected to push the construction industry, thereby driving demand for concrete waterproof admixture.

How is Water Scarcity Prompting the Demand for Concrete Admixtures?

The concrete admixture market is mainly driven by increasing use of water-reducing admixtures as conservation of water is requisite. It is estimated that about 17 percent of the water is used for direct purposes at construction sites, while 25 percent of water is used for indirect purposes.

On the other hand, water-reducing admixture can lower the water content by 15-30% in the concrete mix. Thus, high demand for water-reducing admixtures such as plasticizers and superplasticizers is driving the concrete admixture market.

In addition to providing great strength, durability, and a strong link between steel and concrete, plasticizers are excellent for removing water from concrete. Workability is a crucial property of concrete mixture quality. This has increased the demand for plasticizers in various parts of the globe. Additionally, plasticizers help in reducing cracking, bleeding, and segregation, which would aid growth.

Increasing use of ready-mix concrete and precast concrete are some of the other factors that would push demand for superplasticizers. Ready-mix concrete is often used in big infrastructure or building projects as it helps to improve the concrete's flowability.

How Would Rapid Urbanization Surge Sales of Concrete Admixtures?

The United Nations suggests that the global population is estimated to reach around 9.7 billion by 2050. This is anticipated to lead to rapid urbanization, including rising number of construction activities in both residential and commercial sectors.

Governments are further increasing their investments in the construction of public infrastructures to fulfill the population's rising demand for residential, commercial, and industrial construction, as well as for the development of their countries.

Further, developing countries are gradually inclining towards the development of smart city projects, which would propel sales of quick setting concrete admixture. Rising research and development activities by key players is also expected to create new growth opportunities in the market for concrete admixtures.

Is Use of Concrete Formwork Technology Driving the Concrete Admixture Market?

To make a structure appear more aesthetically pleasing, concrete is nowadays being poured into a formwork to simulate stones, bricks, tiles, and a variety of other materials. Concrete formwork technology has had a significant influence across the globe as it determines the structure of constructions even when they are being constructed.

Formwork is often left in place until the concrete has sufficiently dried to be removed. It takes almost 24–48 hours for walls, columns, and other structures to remove the form when using conventional concrete. Contrarily, addition of concrete admixtures in concrete improves several characteristics, including workability, durability, and early and final strengths.

This ultimately reduces the time taken for the concrete to set, thereby saving both money and time. Therefore, the market for concrete admixtures is anticipated to grow in the forecast period due to increasing use of fast setting concrete admixture in significant building projects, particularly in bridges and tunnels.

Country-wise Insights

How is the China Concrete Admixture Market Progressing?

“Infrastructure Development Projects to Boost Need for Cement Waterproofing Additives”

Due to the rapid expansion of the construction industry, China is set to have the largest market for concrete admixtures. The government is consistently providing incentives to develop the infrastructure sector in China, which is mainly driven by the booming residential sector stoked by burgeoning middle-class population.

China is expected to utilize a substantial amount of concrete for the development of infrastructures, which would further trigger the demand for cement waterproofing additives. Significant investments are also being made in the country from both public and private firms, which is accelerating growth of the infrastructure sector and pushing its need for concrete admixtures.

What is the India Concrete Admixture Market Outlook?

“Liquid Admixture for Concrete to Exhibit High Demand in India”

The India concrete admixture market is anticipated to exhibit growth at a CAGR of 8.5% during the projected period. Growth is mainly attributed to increasing investments in infrastructure development projects and surging use of liquid admixture for concrete because of its ability to strengthen structure quality. Government agencies are also investing huge sums to accelerate the development of public and private infrastructure, which would aid growth.

Increasing urban population in metro cities across India is set to have a significant impact on economic growth of the country. Additionally, non-metro cities are expected to gradually follow novel development plans, which would lead to rapid urbanization, thereby representing both potential for growth and difficulties for many end-use sectors. As a result, urbanization is expected to play an important role in propelling the demand for concrete admixture in India.

Easy availability of cost-effective raw materials and increased spending on non-residential projects are a couple of other factors that would fuel the India market.

Category-wise Insights

Which is the Leading Application of Concrete Admixture?

“Residential Sector to Extensively Use Air Entraining Admixture”

Based on application, the residential segment currently holds the highest concrete admixture market share of 62.3%. High demand for residential constructions with rising disposable income of consumers and increasing number of nuclear families globally is set to drive the segment.

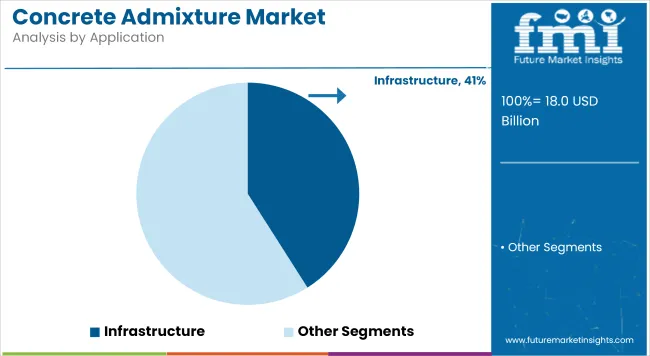
The infrastructure segment, on the other hand, is anticipated to grow at a robust CAGR during the forecast period. Increasing number of infrastructure development projects in countries such as China, the U.S., and India on the back of government initiatives is likely to bolster growth.

Apart from that, the commercial and industrial segments are anticipated to grow at a steady pace by 2032 due to the ongoing development of education institutes, private offices, and manufacturing plants across the globe.

Which Concrete Admixture Type is Set to Exhibit Lucrative Growth?

“Water-reducing Admixture to Showcase High Demand”

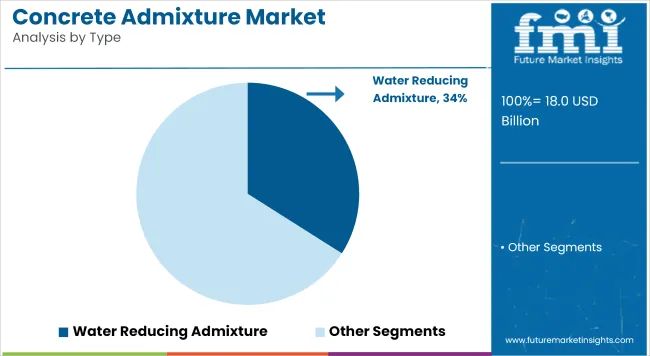
By type, the water-reducing admixture segment is expected to hold the highest share and exhibit a significant CAGR in the concrete admixture market during the forthcoming years. Increasing demand for water-reducing admixtures in the commercial and residential sectors due to their good water-reducing property is expected to spur growth.

Demand for accelerating admixture has also increased in recent years owing to their ability to reduce the initial setting time, which has extensive applications in residential constructions.

Furthermore, concrete admixtures such as waterproofing and air-entraining are exhibiting immense popularity worldwide. Waterproofing admixtures can reduce the overall maintenance cost and increase durability, as well as structure degradation.

Whereas, rising adoption of air-entraining and retarding admixture to withstand freezing and to set concrete quickly in high temperatures, respectively is fueling growth.

Competitive Landscape

Key players in the concrete admixture market are focusing on adopting alternative distribution channels such as online channels, to strengthen their presence in various parts of the globe. The majority of the key players are aiming to innovate their products to reduce carbon footprint.

A few other companies are striving to expand their existing manufacturing sites and production capacities to cater to the ever-increasing consumer demand.

Some of the key industry developments are

  • In October 2021, Sika AG in partnership with the Swiss Federal Institute of Technology Lausanne, developed a concrete additive that uses limestone calcined clay cement (LC3) technology to cut CO2 emissions. The innovation aims to help companies produce efficient and environmentally friendly cement with less clinker.
  • In May 2021, CHRYSO S.A.S introduced the EnviroMix series (admixtures solutions), a global range of cutting-edge products and services targeted to the ready-mix and precast concrete sectors to lower and regulate carbon footprint of concrete.

Scope of the Report

Attributes Details
Estimated Market Size (2022) US$15.1 Billion
Projected Market Valuation (2032) US$ 27.4 Billion
Value-based CAGR (2022 - 2032) 6.1%
Forecast Period 2022 - 2032
Historical Data Available for 2017 - 2021
Market Analysis Value (US$ Billion) and Volume (Kilo Tons)
Key Countries Covered USA, Canada, Brazil, Mexico, Germany, Italy, France, UK, Spain, Russia, Poland, China, Japan, South Korea, India, ASEAN, ANZ, GCC Countries, Turkey, and South Africa.
Key Regions Covered North America, Latin America, Europe, East Asia, South Asia & Pacific, and the Middle East & Africa.
Key Segments Covered Type, Application, and Region
Key Companies Profiled
  • BASF SE
  • SIKA AG
  • GCP Applied Technologies
  • RPM International Inc.
  • Fosroc International
  • Mapei S.P.A
  • CICO Technologies
  • CHRYSO S.A.S
  • Pidilite Industries Ltd
  • Rhein-Chemotechnik GmbH
  • Weber Saint-Gobain
  • Polisan Kimya San. A.S
  • Shandong Wanshan Chemical Co. Ltd.
  • CEMEX SAB de CV
Report Coverage Market forecast, company share analysis, competition intelligence, DROT analysis, market dynamics and challenges, and strategic growth initiatives

Concrete Admixture Market Outlook by Category

By Type:

  • Accelerating Admixture
  • Air Entraining Admixture
  • Retarding Admixture
  • Water Reducing Admixture
    • Plasticizers
    • Superplasticizers
  • Water Proofing Admixture
  • Others

By Application:

  • Residential
  • Infrastructure
  • Commercial
  • Industrial

By Region:

  • North America
  • Latin America
  • Europe
  • East Asia
  • South Asia & Pacific
  • Middle East & Africa

Frequently Asked Questions

What will be the concrete admixture market size in 2022?

The concrete admixture market is anticipated to reach a valuation of US$ 15.1 Bn in 2022.

At what CAGR is the concrete admixture market expected to grow?

The concrete admixture market is anticipated to grow at a CAGR of 6.1% over the forecast period of 2022 and 2032.

At what rate did the concrete admixture market grow between 2017 and 2021?

The concrete admixture market witnessed growth at 5.2% CAGR between 2017 and 2021.

Who are the leading players in the concrete admixture market?

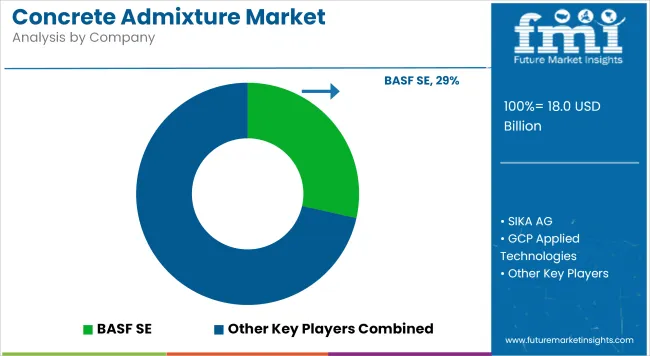
BASF SE, SIKA AG, GCP Applied Technologies, RPM International Inc., Fosroc International, Mapei S.P.A, and CICO Technologies are some of the leading players in the concrete admixture market.

Which are the top countries driving the concrete admixture market?

China, the U.S., and India are the top countries driving the concrete admixture market.

Table of Content

1. Executive Summary

    1.1. Global Market Outlook

    1.2. Demand Side Trends

    1.3. Supply Side Trends

    1.4. Analysis and Recommendations

2. Market Overview

    2.1. Market Coverage / Taxonomy

    2.2. Market Definition / Scope / Limitations

3. Key Market Trends

    3.1. Key Trends Impacting the Market

    3.2. Innovation / Development Trends

4. Key Success Factors

    4.1. Product Adoption / Usage Analysis

    4.2. Product innovation & Diversification

    4.3. Marketing and Brand management

    4.4. Supply Chain Management

5. Global Market Demand Analysis 2017-2021 and Forecast, 2022-2032

    5.1. Historical Market Volume (KT) Analysis, 2017-2021

    5.2. Current and Future Market Volume (KT) Projections, 2022-2032

    5.3. Y-o-Y Growth Trend Analysis

6. Global Market - Pricing Analysis

    6.1. Regional Pricing Analysis by Type

    6.2. Pricing Analysis by Regions

7. Global Market Demand (in Value or Size in US$ Bn) Analysis 2017-2021 and Forecast, 2022-2032

    7.1. Historical Market Value (US$ Bn) Analysis, 2017-2021

    7.2. Current and Future Market Value (US$ Bn) Projections, 2022-2032

        7.2.1. Y-o-Y Growth Trend Analysis

        7.2.2. Absolute $ Opportunity Analysis

8. Market Background

    8.1. Macro-Economic Factors

        8.1.1. Global Economic Outlook

        8.1.2. Global Chemical Industry Overview

        8.1.3. Global Concrete Industry Outlook

        8.1.4. Global Construction Chemical Outlook

        8.1.5. Global Cement Production Outlook

        8.1.6. Global Manufacturing Value Added

        8.1.7. Other Macro-Economic Factors

    8.2. Forecast Factors - Relevance & Impact

        8.2.1. GDP growth Outlook

        8.2.2. Growth in Construction Industry

        8.2.3. Growth in Infrastructure Sector

        8.2.4. Global Construction Projects Overview

        8.2.5. Impact of Pricing

        8.2.6. Increasing Government Regulations

        8.2.7. Other Forecast Factors

    8.3. Supply-Demand Analysis

    8.4. Value Chain Analysis

        8.4.1. List of Manufacturers

        8.4.2. List of Distributors

    8.5. Market Dynamics

    8.6. Impact of COVID – 19 Crisis

    8.7. Key Regulations & Certifications

9. Global Market Analysis 2017-2021 and Forecast 2022-2032, by Type

    9.1. Introduction / Key Findings

    9.2. Historical Market Size (US$ Bn) and Volume Analysis By Type, 2017 - 2021

    9.3. Current and Future Market Size (US$ Bn) and Volume Analysis and Forecast By Type, 2022 - 2032

        9.3.1. Accelerating Admixture

        9.3.2. Air Entraining Admixture

        9.3.3. Retarding Admixture

        9.3.4. Water Reducing Admixture

            9.3.4.1. Plasticizers

            9.3.4.2. Superplasticizers

        9.3.5. Water Proofing Admixture

        9.3.6. Others

    9.4. Market Attractiveness Analyses, By Type

10. Global Market Analysis 2017-2021 and Forecast 2022-2032, By Application

    10.1. Introduction / Key Findings

    10.2. Historical Market Size (US$ Bn) and Volume Analysis By Application, 2017 - 2021

    10.3. Current and Future Market Size (US$ Bn) and Volume Analysis and Forecast By Application, 2022 - 2032

        10.3.1. Residential

        10.3.2. Infrastructure

        10.3.3. Commercial

        10.3.4. Industrial

    10.4. Market Attractiveness Analysis By Application

11. Global Market Analysis 2017-2021 and Forecast 2022-2032, by Region

    11.1. Introduction

    11.2. Historical Market Size (US$ Bn) and Volume Analysis By Region, 2017 - 2021

    11.3. Current Market Size (US$ Bn) and Volume Analysis and Forecast By Region, 2022 - 2032

        11.3.1. North America

        11.3.2. Latin America

        11.3.3. Europe

        11.3.4. East Asia

        11.3.5. South Asia & Pacific

        11.3.6. Middle East & Africa

    11.4. Market Attractiveness Analysis By Region

12. North America Market Analysis 2017-2021 and Forecast 2022-2032

    12.1. Introduction

    12.2. Pricing Analysis

    12.3. Historical Market Size (US$ Bn) and Volume Trend Analysis By Market Taxonomy, 2017 - 2021

    12.4. Market Size (US$ Bn) and Volume Forecast By Market Taxonomy, 2022 - 2032

        12.4.1. By Type

        12.4.2. By Application

        12.4.3. By Country

            12.4.3.1. U.S.

            12.4.3.2. Canada

    12.5. Market Attractiveness Analysis

        12.5.1. By Type

        12.5.2. By Application

        12.5.3. By Country

    12.6. Market Trends

    12.7. Drivers and Restraints Impact Analysis

13. Latin America Market Analysis 2017-2021 and Forecast 2022-2032

    13.1. Introduction

    13.2. Pricing Analysis

    13.3. Historical Market Size (US$ Bn) and Volume Trend Analysis By Market Taxonomy, 2017 - 2021

    13.4. Market Size (US$ Bn) and Volume Forecast By Market Taxonomy, 2022 - 2032

        13.4.1. By Type

        13.4.2. By Application

        13.4.3. By Country

            13.4.3.1. Brazil

            13.4.3.2. Mexico

            13.4.3.3. Rest of Latin America

    13.5. Market Attractiveness Analysis

        13.5.1. By Type

        13.5.2. By Application

        13.5.3. By Country

    13.6. Market Trends

    13.7. Drivers and Restraints Impact Analysis

14. Europe Market Analysis 2017-2021 and Forecast 2022-2032

    14.1. Introduction

    14.2. Pricing Analysis

    14.3. Historical Market Size (US$ Bn) and Volume Trend Analysis By Market Taxonomy, 2017 - 2021

    14.4. Market Size (US$ Bn) and Volume Forecast By Market Taxonomy, 2022 - 2032

        14.4.1. By Type

        14.4.2. By Application

        14.4.3. By Country

            14.4.3.1. Germany

            14.4.3.2. Italy

            14.4.3.3. France

            14.4.3.4. U.K.

            14.4.3.5. Spain

            14.4.3.6. BENELUX

            14.4.3.7. Russia

            14.4.3.8. Rest of Europe

    14.5. Market Attractiveness Analysis

        14.5.1. By Type

        14.5.2. By Application

        14.5.3. By Country

    14.6. Market Trends

    14.7. Drivers and Restraints Impact Analysis

15. East Asia Market Analysis 2017-2021 and Forecast 2022-2032

    15.1. Introduction

    15.2. Pricing Analysis

    15.3. Historical Market Size (US$ Bn) and Volume Trend Analysis By Market Taxonomy, 2017 - 2021

    15.4. Market Size (US$ Bn) and Volume Forecast By Market Taxonomy, 2022 - 2032

        15.4.1. By Type

        15.4.2. By Application

        15.4.3. By Country

            15.4.3.1. China

            15.4.3.2. Japan

            15.4.3.3. South Korea

    15.5. Market Attractiveness Analysis

        15.5.1. By Type

        15.5.2. By Application

        15.5.3. By Country

    15.6. Market Trends

    15.7. Drivers and Restraints Impact Analysis

16. South Asia & Pacific Market Analysis 2017-2021 and Forecast 2022-2032

    16.1. Introduction

    16.2. Pricing Analysis

    16.3. Historical Market Size (US$ Bn) and Volume Trend Analysis By Market Taxonomy, 2017 - 2021

    16.4. Market Size (US$ Bn) and Volume Forecast By Market Taxonomy, 2022 - 2032

        16.4.1. By Type

        16.4.2. By Application

        16.4.3. By Country

            16.4.3.1. India

            16.4.3.2. ASEAN

            16.4.3.3. ANZ

            16.4.3.4. Rest of South Asia & Pacific

    16.5. Market Attractiveness Analysis

        16.5.1. By Type

        16.5.2. By Application

        16.5.3. By Country

    16.6. Market Trends

    16.7. Drivers and Restraints Impact Analysis

17. Middle East and Africa Market Analysis 2017-2021 and Forecast 2022-2032

    17.1. Introduction

    17.2. Pricing Analysis

    17.3. Historical Market Size (US$ Bn) and Volume Trend Analysis By Market Taxonomy, 2017 - 2021

    17.4. Market Size (US$ Bn) and Volume Forecast By Market Taxonomy, 2022 - 2032

        17.4.1. By Type

        17.4.2. By Application

        17.4.3. By Country

            17.4.3.1. GCC Countries

            17.4.3.2. Turkey

            17.4.3.3. Northern Africa

            17.4.3.4. South Africa

            17.4.3.5. Rest of Middle East and Africa

    17.5. Market Attractiveness Analysis

        17.5.1. By Type

        17.5.2. By Application

        17.5.3. By Country

    17.6. Market Trends

    17.7. Drivers and Restraints Impact Analysis

18. Country Wise Market Analysis

    18.1. U.S. Market Analysis

        18.1.1. By Type

        18.1.2. By Application

    18.2. Canada Market Analysis

        18.2.1. By Type

        18.2.2. By Application

    18.3. Mexico Market Analysis

        18.3.1. By Type

        18.3.2. By Application

    18.4. Brazil Market Analysis

        18.4.1. By Type

        18.4.2. By Application

    18.5. Germany Market Analysis

        18.5.1. By Type

        18.5.2. By Application

    18.6. Italy Market Analysis

        18.6.1. By Type

        18.6.2. By Application

    18.7. France Market Analysis

        18.7.1. By Type

        18.7.2. By Application

    18.8. U.K. Market Analysis

        18.8.1. By Type

        18.8.2. By Application

    18.9. Spain Market Analysis

        18.9.1. By Type

        18.9.2. By Application

    18.10. Russia Market Analysis

        18.10.1. By Type

        18.10.2. By Application

    18.11. BENELUX Market Analysis

        18.11.1. By Type

        18.11.2. By Application

    18.12. China Market Analysis

        18.12.1. By Type

        18.12.2. By Application

    18.13. Japan Market Analysis

        18.13.1. By Type

        18.13.2. By Application

    18.14. S. Korea Market Analysis

        18.14.1. By Type

        18.14.2. By Application

    18.15. India Market Analysis

        18.15.1. By Type

        18.15.2. By Application

    18.16. ASEAN Market Analysis

        18.16.1. By Type

        18.16.2. By Application

    18.17. GCC Countries Market Analysis

        18.17.1. By Type

        18.17.2. By Application

    18.18. Turkey Market Analysis

        18.18.1. By Type

        18.18.2. By Application

    18.19. South Africa Market Analysis

        18.19.1. By Type

        18.19.2. By Application

19. Market Structure Analysis

    19.1. Market Analysis by Tier of Companies [Concrete Admixture]

    19.2. Market Concentration

    19.3. Market Share Analysis of Top Players

    19.4. Apparent Production Capacity of Top Players

    19.5. Market Presence Analysis

        19.5.1. By Regional Presence

        19.5.2. By Product Footprint

20. Competition Analysis

    20.1. Competition Dashboard

    20.2. Primary Survey Analysis

    20.3. Competition Deep Dive

        20.3.1. BASF SE

            20.3.1.1. Overview

            20.3.1.2. Product Portfolio

            20.3.1.3. Key Financials

            20.3.1.4. Sales Footprint

            20.3.1.5. Strategy Overview

        20.3.2. SIKA AG

            20.3.2.1. Overview

            20.3.2.2. Product Portfolio

            20.3.2.3. Key Financials

            20.3.2.4. Sales Footprint

            20.3.2.5. Strategy Overview

        20.3.3. GCP Applied Technologies

            20.3.3.1. Overview

            20.3.3.2. Product Portfolio

            20.3.3.3. Key Financials

            20.3.3.4. Sales Footprint

            20.3.3.5. Strategy Overview

        20.3.4. RPM Internation Inc

            20.3.4.1. Overview

            20.3.4.2. Product Portfolio

            20.3.4.3. Key Financials

            20.3.4.4. Sales Footprint

            20.3.4.5. Strategy Overview

        20.3.5. Fosroc International

            20.3.5.1. Overview

            20.3.5.2. Product Portfolio

            20.3.5.3. Key Financials

            20.3.5.4. Sales Footprint

            20.3.5.5. Strategy Overview

        20.3.6. Mapei S.P.A

            20.3.6.1. Overview

            20.3.6.2. Product Portfolio

            20.3.6.3. Key Financials

            20.3.6.4. Sales Footprint

            20.3.6.5. Strategy Overview

        20.3.7. CICO Technologies

            20.3.7.1. Overview

            20.3.7.2. Product Portfolio

            20.3.7.3. Key Financials

            20.3.7.4. Sales Footprint

            20.3.7.5. Strategy Overview

        20.3.8. CHRYSO S.A.S

            20.3.8.1. Overview

            20.3.8.2. Product Portfolio

            20.3.8.3. Key Financials

            20.3.8.4. Sales Footprint

            20.3.8.5. Strategy Overview

        20.3.9. Pidilite Industries Ltd

            20.3.9.1. Overview

            20.3.9.2. Product Portfolio

            20.3.9.3. Key Financials

            20.3.9.4. Sales Footprint

            20.3.9.5. Strategy Overview

        20.3.10. Rhein-Chemotechnik GmbH

            20.3.10.1. Overview

            20.3.10.2. Product Portfolio

            20.3.10.3. Key Financials

            20.3.10.4. Sales Footprint

            20.3.10.5. Strategy Overview

        20.3.11. Weber Saint-Gobain

            20.3.11.1. Overview

            20.3.11.2. Product Portfolio

            20.3.11.3. Key Financials

            20.3.11.4. Sales Footprint

            20.3.11.5. Strategy Overview

        20.3.12. Polisan Kamya San. A.S

            20.3.12.1. Overview

            20.3.12.2. Product Portfolio

            20.3.12.3. Key Financials

            20.3.12.4. Sales Footprint

            20.3.12.5. Strategy Overview

        20.3.13. Shangdong Wanshan Chemical Co. Ltd.

            20.3.13.1. Overview

            20.3.13.2. Product Portfolio

            20.3.13.3. Key Financials

            20.3.13.4. Sales Footprint

            20.3.13.5. Strategy Overview

        20.3.14. CEMEX SAB de CV

            20.3.14.1. Overview

            20.3.14.2. Product Portfolio

            20.3.14.3. Key Financials

            20.3.14.4. Sales Footprint

            20.3.14.5. Strategy Overview

Note: List of companies is preliminary in nature and not an exhaustive list. It may be further augmented and refined during the course of research study.

21. Assumptions and Acronyms Used

22. Primary Survey Analysis

23. Research Methodology

Don't pay for what you don't need

Customize your report by selecting specific countries or regions and save 30%!

List of Tables

Table 01: Global Market Value (US$ Bn) & Volume (KT) by Type, 2017 – 2032

Table 02: Global Market Value (US$ Bn) and Volume (KT) Forecast by Application, 2017–2032

Table 03: Global Market Value (US$ Bn) and Volume (KT) Forecast by Region, 2017–2032

Table 04: North America Market Size (US$ Bn) and Volume (KT) Forecast by Country, 2017–2032

Table 05: North America Market Value (US$ Bn) and Volume (KT) Forecast by Type, 2017–2032

Table 06: North America Market Size (US$ Bn) and Volume (KT) Forecast by Application, 2017–2032

Table 07: Latin America Market Size (US$ Bn) and Volume (KT) Forecast by Country, 2017–2032

Table 08: Latin America Market Value (US$ Bn) and Volume (KT) Forecast by Type, 2017–2032

Table 09: Latin America Market Size (US$ Bn) and Volume (KT) Forecast by Application, 2017–2032

Table 10: Europe Market Size (US$ Bn) and Volume (KT) Forecast by Country, 2017–2032

Table 11: Europe Market Value (US$ Bn) and Volume (KT) Forecast by Type, 2017–2032

Table 12: Europe Market Size (US$ Bn) and Volume (KT) Forecast by Application, 2017–2032

Table 13: South Asia & Pacific Market Size (US$ Bn) and Volume (KT) Forecast by Country, 2017–2032

Table 14: South Asia & Pacific Market Value (US$ Bn) and Volume (KT) Forecast by Type, 2017–2032

Table 15: South Asia & Pacific Market Size (US$ Bn) and Volume (KT) Forecast by Application, 2017–2032

Table 16: East Asia Market Size (US$ Bn) and Volume (KT) Forecast by Country, 2017–2032

Table 17: East Asia Market Value (US$ Bn) and Volume (KT) Forecast by Type, 2017–2032

Table 18: East Asia Market Size (US$ Bn) and Volume (KT) Forecast by Application, 2017–2032

Table 19: Middle East & Africa Market Size (US$ Bn) and Volume (KT) Forecast by Country, 2017–2032

Table 20: Middle East & Africa Market Value (US$ Bn) and Volume (KT) Forecast by Type, 2017–2032

Table 21: Middle East & Africa Market Size (US$ Bn) and Volume (KT) Forecast by Application, 2017–2032
Nikhil Kaitwade
Nikhil Kaitwade

Principal Consultant

Talk to Analyst

Find your sweet spots for generating winning opportunities in this market.

List of Charts

Figure 01: Global Historical Market Volume (KT) Analysis, 2017-2021

Figure 02: Global Current and Future Market Volume (KT) Analysis, 2022-2032

Figure 03: Global Market Value (US$ Bn), 2017 – 2021

Figure 04: Global Market Value (US$ Bn) Forecast, 2022 – 2032

Figure 05: Global Market Absolute $ Opportunity, 2017 to 2022 and 2032

Figure 06: Global Market Share and BPS Analysis by Type– 2022 & 2032

Figure 07: Global Market Y-o-Y Growth Projections by Type, 2022 - 2032

Figure 08: Global Market Absolute $ Opportunity by Accelerating Admixture Segment

Figure 09: Global Market Absolute $ Opportunity by Air Entraining Admixture Segment

Figure 10: Global Market Absolute $ Opportunity by Retarding Admixture Segment

Figure 11: Global Market Absolute $ Opportunity by Water Reducing Admixture Segment

Figure 12: Global Market Absolute $ Opportunity by Water Proofing Admixture Segment

Figure 13: Global Market Absolute $ Opportunity by Others Segment

Figure 14: Global Market Share and BPS Analysis by Application – 2022 & 2032

Figure 15: Global Market Y-o-Y Growth Projections by Application, 2022 - 2032

Figure 16: Global Market Absolute $ Opportunity by Residential Segment

Figure 17: Global Market Absolute $ Opportunity by Infrastructure Segment

Figure 18: Global Market Absolute $ Opportunity by Commercial Segment

Figure 19: Global Market Absolute $ Opportunity by Industrial Segment

Figure 20: Global Market Attractiveness Analysis by Application, 2022-2032

Figure 21: Global Market Share and BPS Analysis by Region– 2022 & 2032

Figure 22: Global Market Y-o-Y Growth Projections by Region, 2022 - 2032

Figure 23: Global Market Absolute $ Opportunity by North America

Figure 24: Global Market Absolute $ Opportunity by Latin America

Figure 25: Global Market Absolute $ Opportunity by Europe

Figure 26: Global Market Absolute $ Opportunity by East Asia

Figure 27: Global Market Absolute $ Opportunity by South Asia Pacific

Figure 28: Global Market Absolute $ Opportunity by MEA

Figure 29: Global Market Attractiveness Analysis by Region, 2022-2032

Figure 30: North America Market Share and BPS Analysis by Country– 2022 & 2032

Figure 31: North America Market Y-o-Y Growth Projections by Country, 2022 - 2032

Figure 32: North America Market Attractiveness Analysis by Country, 2022-2032

Figure 33: North America Market Share and BPS Analysis by Type– 2022 & 2032

Figure 34: North America Market Y-o-Y Growth Projections by Type, 2022 - 2032

Figure 35: North America Market Attractiveness Analysis by Type, 2022-2032

Figure 36: North America Market Share and BPS Analysis by Application – 2022 & 2032

Figure 37: North America Market Y-o-Y Growth Projections by Application, 2022 - 2032

Figure 38: North America Market Attractiveness Analysis by Application, 2022-2032

Figure 39: Latin America Market Share and BPS Analysis by Country– 2022 & 2032

Figure 40: Latin America Market Y-o-Y Growth Projections by Country, 2022 - 2032

Figure 41: Latin America Market Attractiveness Analysis by Country, 2022-2032

Figure 42: Latin America Market Share and BPS Analysis by Type– 2022 & 2032

Figure 43: Latin America Market Y-o-Y Growth Projections by Type, 2022 - 2032

Figure 44: Latin America Market Attractiveness Analysis by Type, 2022-2032

Figure 45: Latin America Market Share and BPS Analysis by Application– 2022 & 2032

Figure 46: Latin America Market Y-o-Y Growth Projections by Application, 2022 - 2032

Figure 47: Latin America Market Attractiveness Analysis by Application, 2022-2032

Figure 48: Europe Market Share and BPS Analysis by Country– 2022 & 2032

Figure 49: Europe Market Y-o-Y Growth Projections by Country, 2022 - 2032

Figure 50: Europe Market Attractiveness Analysis by Country, 2022-2032

Figure 51: Europe Market Share and BPS Analysis by Type– 2022 & 2032

Figure 52: Europe Market Y-o-Y Growth Projections by Type, 2022 - 2032

Figure 53: Europe Market Attractiveness Analysis by Type, 2022-2032

Figure 54: Europe Market Share and BPS Analysis by Application – 2022 & 2032

Figure 55: Europe Market Y-o-Y Growth Projections by Application, 2022 - 2032

Figure 56: Europe Market Attractiveness Analysis by Application, 2022-2032

Figure 57: South Asia & Pacific Market Share and BPS Analysis by Country– 2022 & 2032

Figure 58: South Asia & Pacific Market Y-o-Y Growth Projections by Country, 2022 - 2032

Figure 59: South Asia & Pacific Market Attractiveness Analysis by Country, 2022-2032

Figure 60: South Asia & Pacific Market Share and BPS Analysis by Type– 2022 & 2032

Figure 61: South Asia & Pacific Market Y-o-Y Growth Projections by Type, 2022 - 2032

Figure 62: South Asia & Pacific Market Attractiveness Analysis by Type, 2022-2032

Figure 63: South Asia & Pacific Market Share and BPS Analysis by Application – 2022 & 2032

Figure 64: South Asia & Pacific Market Y-o-Y Growth Projections by Application, 2022 - 2032

Figure 65: South Asia & Pacific Market Attractiveness Analysis by Application, 2022-2032

Figure 66: East Asia Market Share and BPS Analysis by Country– 2022 & 2032

Figure 67: East Asia Market Y-o-Y Growth Projections by Country, 2022 - 2032

Figure 68: East Asia Market Attractiveness Analysis by Country, 2022-2032

Figure 69: East Asia Market Share and BPS Analysis by Type– 2022 & 2032

Figure 70: East Asia Market Y-o-Y Growth Projections by Type, 2022 - 2032

Figure 71: East Asia Market Attractiveness Analysis by Type, 2022-2032

Figure 72: East Asia Market Share and BPS Analysis by Application – 2022 & 2032

Figure 72: East Asia Market Y-o-Y Growth Projections by Application, 2022 - 2032

Figure 73: East Asia Market Attractiveness Analysis by Application, 2022-2032

Figure 74: Middle East & Africa Market Share and BPS Analysis by Country– 2022 & 2032

Figure 75: Middle East & Africa Market Y-o-Y Growth Projections by Country, 2022 - 2032

Figure 76: Middle East & Africa a Market Attractiveness Analysis by Country, 2022-2032

Figure 77: Middle East & Africa Market Share and BPS Analysis by Type– 2022 & 2032

Figure 78: Middle East & Africa Market Y-o-Y Growth Projections by Type, 2022 - 2032

Figure 79: Middle East & Africa Market Attractiveness Analysis by Type, 2022-2032

Figure 80: Middle East & Africa Market Share and BPS Analysis by Application – 2022 & 2032

Figure 81: Middle East & Africa Market Y-o-Y Growth Projections by Application, 2022 - 2032

Figure 82: Middle East & Africa Market Attractiveness Analysis by Application, 2022-2032

Recommendations

Chemicals & Materials

Concrete Floor Coatings Market

Published : January 2023

Chemicals & Materials

Polymer Concrete Market

Published : October 2022

Explore Chemicals & Materials Insights

View Reports

Concrete Admixture Market