The precast concrete market is projected to grow from USD 150.2 billion in 2025 to USD 261.5 billion by 2035, registering a CAGR of 5.7%. Growth is primarily driven by increasing adoption of modular housing, infrastructure development, and the need for rapid construction solutions across residential, commercial, and industrial applications. Walls will dominate, holding 34.8% market share, while the residential segment leads the end-use application with 37.0% share. Demand for insulated wall systems is also growing due to their superior thermal performance, especially in energy-efficient building designs.
Asia Pacific leads growth, with India (5.3% CAGR) and China (4.8% CAGR) driving expansion due to urbanization, affordable housing projects, and infrastructure development. In North America, the United States (6.3% CAGR) is a key driver, supported by federal infrastructure funding and housing shortages. Meanwhile, Europe shows steady growth, with Germany (3.9% CAGR) and the United Kingdom (2.9% CAGR) focusing on sustainability and modular construction adoption.
Wall systems are the dominant product type, especially insulated walls, which represent 14.5% of the market, driven by energy efficiency requirements and government mandates for low-carbon construction. Other product segments like slabs and structural beams follow closely in demand, while residential and infrastructure projects lead consumption.
As the construction industry seeks to reduce its environmental footprint, precast concrete offers a more sustainable alternative to traditional in-situ concrete methods. The ability to produce precast concrete components in controlled factory settings reduces material waste, improves quality control, and lowers the energy consumption of on-site construction processes. Furthermore, the use of recycled materials in the production of precast concrete products, such as aggregates and supplementary cementitious materials, further enhances the sustainability of the material. This alignment with green building initiatives and sustainable construction practices is contributing to the growth of the precast concrete market.
The growing popularity of modular construction is another key factor driving market growth. Precast concrete is a key component of modular construction, where entire building units or systems are manufactured off-site and then assembled on-site. This approach offers significant time and cost savings, making it increasingly popular in both residential and commercial construction. The modular construction trend, combined with the increasing focus on affordable housing and rapid urban development, is expected to contribute to the growth of the precast concrete market in the coming years.
Opportunities in the market remain abundant, particularly as demand for sustainable, efficient, and high-quality construction materials continues to rise. Innovations in precast concrete design, including the development of lightweight and high-performance materials, will further expand its applications. Additionally, advancements in 3D printing and automation technologies for precast concrete production are expected to further streamline manufacturing processes, reduce costs, and improve the precision of components.
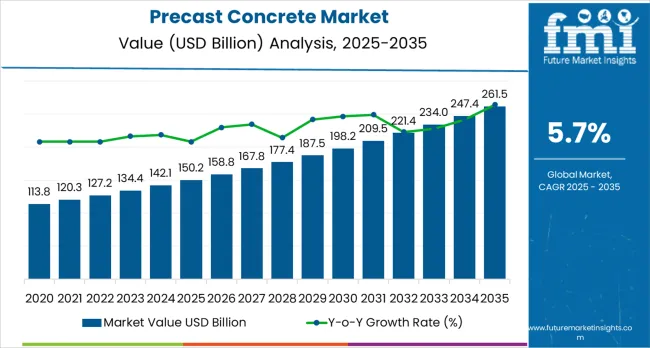
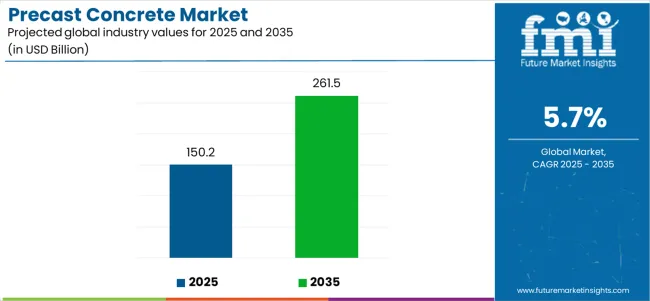
The precast concrete market demonstrates distinct growth phases with varying market characteristics and competitive dynamics. Between 2025 and 2030, the market progresses through its technology adoption phase, expanding from USD 150.2 billion to USD 198.4 billion with steady annual increments averaging 5.7% growth. This period showcases the transition from conventional cast-in-place methods to advanced precast systems with enhanced insulation capabilities and integrated quality control systems becoming mainstream features.
The 2025-2030 phase adds USD 48.2 billion to market value, representing 49% of total decade expansion. Market maturation factors include standardization of modular construction protocols, declining costs for automated production facilities, and increasing construction industry awareness of precast benefits reaching 40-50% faster project completion in residential and commercial applications. Competitive landscape evolution during this period features established building materials companies like LafargeHolcim and CRH expanding their precast portfolios while specialty manufacturers focus on insulated panel development and enhanced structural capabilities.
From 2030 to 2035, market dynamics shift toward advanced sustainability integration and global infrastructure expansion, with growth continuing from USD 198.4 billion to USD 261.5 billion, representing an addition of USD 63.1 billion, or 51% of the total expansion. This phase transition centers on low-carbon precast formulations, integration with automated construction networks, and deployment across diverse smart city scenarios, becoming standard rather than specialized applications. The competitive environment matures, with a focus shifting from basic precast capabilities to comprehensive construction optimization systems and integration with digital twin platforms.
| Metric | Value |
|---|---|
| Market Value (2025) | USD 150.2 billion |
| Market Forecast (2035) | USD 261.5 billion |
| Growth Rate | 5.7% CAGR |
| Leading Technology | Walls Product Type |
| Primary Application | Residential Segment |
The market demonstrates strong fundamentals, with wall systems capturing a dominant share due to their structural versatility and rapid installation optimization capabilities. Residential applications drive primary demand, supported by the increasing adoption of modular housing and the growing need for affordable construction technology. Geographic expansion remains concentrated in Asia Pacific markets, driven by accelerating urbanization and infrastructure, while developed economies exhibit steady adoption rates, largely due to sustainability mandates and rising labor cost pressures that favor off-site manufacturing solutions.
Market expansion rests on three fundamental shifts driving adoption across construction and infrastructure sectors. First, modular housing demand creates compelling operational advantages through precast walls and slabs that provide immediate installation without weather delays, enabling developers to meet project timelines while maintaining construction quality and reducing on-site labor requirements. Second, infrastructure modernization accelerates as governments worldwide seek durable concrete systems that complement transportation networks, enabling precise dimensional control and structural consistency that align with engineering standards and long-term maintenance optimization.
Third, sustainability mandate adoption drives demand from developers requiring low-carbon building solutions that minimize construction waste while maintaining structural performance during residential assembly and commercial building operations. However, growth faces headwinds from transportation cost challenges that vary across project locations regarding delivery logistics and handling equipment availability, which may limit adoption in remote areas or sites with access constraints. Initial capital investment requirements also persist regarding production facility setup and automated manufacturing systems that may reduce competitiveness for small-scale manufacturers, affecting market entry and regional capacity development.
The precast concrete market represents a transformative construction materials opportunity driven by expanding modular housing adoption, infrastructure investment programs, and sustainable building requirements. As developers seek rapid construction methods, governments require durable infrastructure solutions, and building codes mandate energy efficiency, precast concrete is evolving from traditional building material to strategic construction system ensuring project speed, quality control, and environmental performance.
The market's growth trajectory from USD 150.2 billion in 2025 to USD 261.5 billion by 2035 at a 5.7% CAGR reflects fundamental shifts in construction methodologies and infrastructure development priorities. Geographic expansion opportunities are pronounced in Asia Pacific markets, while the dominance of wall products (34.8% market share) and residential applications (37.0% share) provides clear strategic focus areas.
Strengthening the dominant walls segment (34.8% market share) through enhanced insulation integration, architectural facade capabilities, and load-bearing structural optimization. This pathway focuses on thermal performance improvement, design flexibility enhancement, extending energy efficiency to passive house standards, and developing specialized finishes for diverse architectural applications. Market leadership consolidation through manufacturing automation and design software integration enables premium positioning while defending competitive advantages. Expected revenue pool: USD 1.8-2.5 billion
Rapid urban development across Asia Pacific (47.0% regional share) creates substantial opportunities through high-rise residential construction, mass transit infrastructure, and industrial facility development requiring precast building systems. Growing megacity expansion, affordable housing mandates, and government infrastructure programs drive sustained demand for efficient construction methods. Regional manufacturing capacity optimization reduces logistics costs while enabling customized solutions. Expected revenue pool: USD 1.5-2.2 billion
Expansion within the dominant residential segment (37.0% market share) through high-rise housing systems, affordable mass housing solutions, and luxury architectural home applications. This pathway encompasses rapid construction timelines, design customization capabilities, and comprehensive building envelope integration for multi-family developments. Premium positioning reflects quality consistency and comprehensive project support enabling modern residential construction. Expected revenue pool: USD 1.3-1.9 billion
Strategic expansion into infrastructure applications (30.0% end-use share) requires enhanced durability specifications, bridge component systems, and tunnel segment manufacturing addressing transportation modernization and public works requirements. This pathway addresses highway construction, rail transit systems, and utility infrastructure with engineered precast solutions. Premium pricing reflects structural performance requirements and comprehensive engineering support. Expected revenue pool: USD 1.1-1.6 billion
Development of environmentally responsible precast concrete through recycled aggregate integration, low-emission binders, and carbon footprint optimization addressing green building standards and regulatory compliance. This pathway encompasses circular economy principles, embodied carbon reduction, and comprehensive environmental product declarations. Technology differentiation through sustainability leadership enables access to environmentally-focused procurement programs and LEED-certified project opportunities. Expected revenue pool: USD 900 million-1.3 billion
Expansion in United States (6.3% CAGR) through Infrastructure Investment &Jobs Act funding, bridge replacement programs, and modular housing adoption. Growing transportation infrastructure renewal, federal funding availability, and housing affordability initiatives drive sustained demand. Domestic manufacturing capacity and logistics optimization support competitive positioning in North American construction markets. Expected revenue pool: USD 800 million-1.2 billion
Development within commercial (20.0% share) and industrial (13.0% share) applications through warehouse construction, retail facilities, and manufacturing plants requiring rapid deployment and design flexibility. This pathway encompasses logistics hub development, data center construction, and cold storage facilities with specialized precast solutions. Premium positioning reflects project speed advantages and comprehensive technical support for demanding applications. Expected revenue pool: USD 700 million-1.0 billion
Primary Classification: The market segments by product type into Walls, Slabs, Structural Beams, Foundations, Floors &Roofs, and Others categories, representing the evolution from basic structural components to integrated building systems for comprehensive construction optimization.
Secondary Classification: End-use segmentation divides the market into Residential, Infrastructure, Commercial, and Industrial sectors, reflecting distinct requirements for building performance, construction speed, and project scale characteristics.
Regional Classification: Geographic distribution covers Asia Pacific, North America, Europe, Latin America, and Middle East &Africa, with developing markets leading growth while mature economies show steady expansion driven by sustainability mandates and construction modernization programs.
The segmentation structure reveals technology progression from standard structural elements toward insulated and architecturally finished systems with integrated building envelope capabilities, while application diversity spans from mass-market affordable housing to precision infrastructure components requiring strict dimensional tolerances.
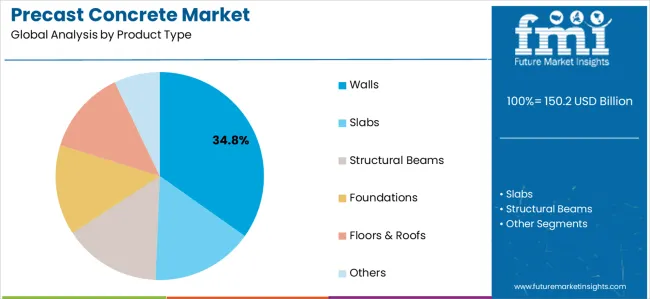
Market Position: Wall systems command the leading position in the Precast Concrete market with approximately 34.8% market share through structural versatility, including load-bearing capabilities, thermal insulation integration, and architectural finish options that enable builders to achieve optimal building envelope performance across diverse residential and commercial construction environments.
Value Drivers: The segment benefits from developer preference for rapid installation systems that provide immediate weather protection, reduced on-site labor, and construction efficiency optimization without requiring extensive formwork. Advanced wall configurations enable insulated cavity designs, integrated MEP routing, and architectural surface treatments, where installation speed and quality consistency represent critical project requirements for multi-story construction.
Competitive Advantages: Wall systems differentiate through factory-controlled production quality, integrated insulation capabilities, and compatibility with diverse structural systems that enhance construction efficiency while maintaining optimal thermal and acoustic performance suitable for residential, commercial, and institutional applications.
Key market characteristics:
Within wall systems, insulated walls capture approximately 14.5% of total market through energy-efficient building envelope solutions and climate control optimization. Load-bearing structural walls account for 11.3% through primary structural support in mid-rise and high-rise construction. Architectural/facade walls maintain 9.0% through aesthetic exterior finishes and customized design capabilities for premium building projects.
Slabs maintain a significant 26.0% market share through floor and roof applications requiring large-span capabilities and efficient load distribution. Structural beams capture 18.2% through primary structural framing in commercial and industrial construction. Foundations account for 11.5% through below-grade applications and site preparation optimization, while floors &roofs maintain 7.8% through integrated building system components. Others capture 1.7% through specialty precast products and architectural elements.
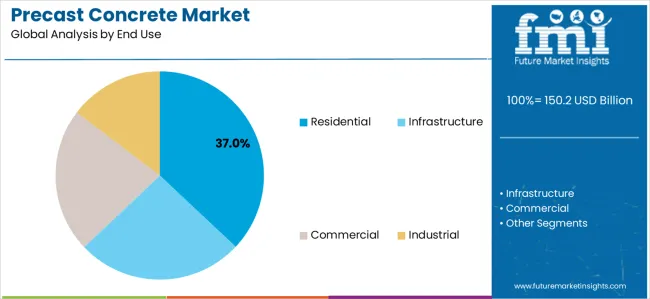
Market Context: Residential applications dominate the Precast Concrete market with approximately 37.0% market share due to widespread adoption in modular housing and increasing focus on rapid construction timelines, affordable housing delivery, and quality consistency management applications that minimize weather-related delays while maintaining building code compliance and architectural design flexibility.
Appeal Factors: Housing developers prioritize construction speed, cost predictability, and integration with existing building systems that enable coordinated project delivery across multiple housing units. The segment benefits from substantial government affordable housing investment and urbanization programs that emphasize rapid residential construction for population growth and housing shortage mitigation.
Growth Drivers: High-rise and mid-rise housing expansion programs incorporate precast walls and slabs as standard building systems for multi-family developments, while affordable mass housing initiatives increase demand for cost-effective construction capabilities that comply with building standards and minimize construction waste.
Market Challenges: Transportation logistics and site access constraints may limit precast adoption in certain urban infill locations or restricted construction sites.
End-use dynamics include:
Infrastructure applications capture approximately 30.0% market share through transportation projects, bridge construction, and utility infrastructure requiring durable precast components. Commercial applications account for 20.0% through office buildings, retail facilities, and institutional construction demanding rapid project delivery. Industrial applications maintain 13.0% through warehouse construction, manufacturing facilities, and logistics infrastructure requiring large-span structural systems and flexible interior layouts.
Growth Accelerators: Modular housing adoption expansion drives primary demand as precast concrete provides rapid installation capabilities enabling developers to meet project deadlines without weather-related delays, supporting residential construction missions and urbanization programs that require accelerated building timelines for affordable housing delivery and multi-family development projects. Infrastructure investment programs accelerate market growth as governments seek durable construction solutions that minimize long-term maintenance while maintaining structural performance during transportation infrastructure development and public facility construction scenarios requiring dimensional precision and quality consistency. Labor shortage mitigation strategies increase worldwide, creating sustained demand for off-site manufacturing systems that complement traditional construction methods and provide skilled labor efficiency in complex building assembly and component integration operations requiring reduced on-site workforce deployment.
Growth Inhibitors: Transportation cost challenges vary across project locations regarding delivery distances and handling equipment requirements, which may limit economic viability and market penetration in remote regions with limited crane access or sites requiring specialized logistics coordination affecting project economics. Initial capital investment requirements persist regarding automated production facility setup and quality control equipment that may reduce manufacturing flexibility for small producers lacking resources for technology adoption, affecting regional capacity development and competitive positioning. Design flexibility limitations exist regarding architectural customization and irregular building geometries that may reduce effectiveness compared to cast-in-place methods in projects requiring complex shapes or unique aesthetic treatments, affecting market adoption in certain architectural applications.
Market Evolution Patterns: Adoption accelerates in high-density residential construction and major infrastructure sectors where construction speed justifies system costs, with geographic concentration in urbanizing Asia Pacific regions transitioning toward mainstream adoption in developed markets driven by labor cost pressures and sustainability mandates supporting off-site manufacturing. Technology development focuses on enhanced insulation integration, improved surface finish quality, and connection system innovation that optimize thermal performance and construction efficiency while reducing installation complexity. Digital integration intensifies as building information modeling enables precise precast design coordination and factory automation supports mass customization capabilities, while sustainable concrete formulations incorporating recycled aggregates and supplementary cementitious materials reduce embodied carbon supporting green building certification programs. The market could face disruption if alternative construction systems like cross-laminated timber or modular steel significantly displace precast in certain building types, though concrete's fire resistance, durability characteristics, and established building code acceptance continue to support market leadership in multi-story residential construction.
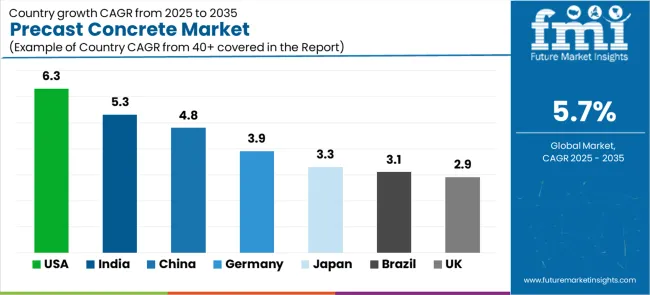
| Country | CAGR (2025 to 2035) |
|---|---|
| United States | 6.3% |
| India | 5.3% |
| China | 4.8% |
| Germany | 3.9% |
| Japan | 3.3% |
| Brazil | 3.1% |
| United Kingdom | 2.9% |
The Precast Concrete market demonstrates varied regional dynamics with Growth Leaders including the United States (6.3% CAGR) and India (5.3% CAGR) driving expansion through infrastructure investment programs and affordable housing initiatives. Steady Performers encompass China (4.8% CAGR), Germany (3.9% CAGR), and Japan (3.3% CAGR), benefiting from established construction industries and urban renewal programs. Mature Markets feature Brazil (3.1% CAGR) and the United Kingdom (2.9% CAGR), where infrastructure modernization and residential construction support consistent growth patterns.
Regional synthesis reveals North American markets demonstrating strong growth driven by federal infrastructure funding and housing shortage mitigation, while Asian countries maintain robust expansion supported by urbanization programs and industrial facility development. European markets show steady growth patterns driven by sustainability mandates and construction modernization initiatives.
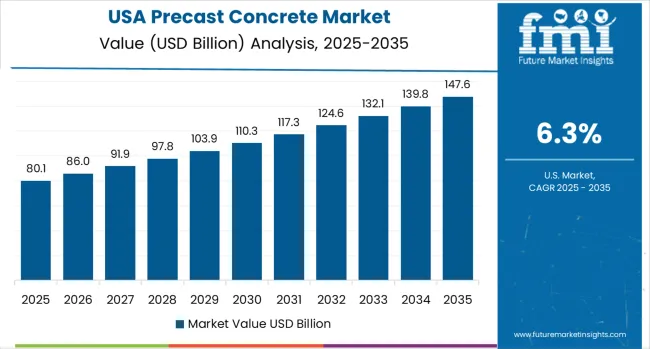
The United States demonstrates highest growth momentum with a 6.3% CAGR, driven by Infrastructure Investment &Jobs Act funding for bridge replacement, transportation hub modernization, and modular housing adoption addressing affordable housing shortages across major metropolitan regions. Federal infrastructure programs create sustained demand for precast bridge components, tunnel segments, and transportation structures, while residential developers increasingly adopt precast wall systems for multi-family housing addressing construction labor shortages and project timeline pressures. State-level housing initiatives support modular construction methods utilizing precast building envelope systems.
Infrastructure renewal drives primary demand as aging bridge inventory requires replacement using durable precast components enabling rapid construction with minimal traffic disruption, while transportation modernization programs incorporate precast systems for transit stations, sound barriers, and retaining walls. Residential market expansion creates additional consumption through multi-family housing developments and affordable housing programs utilizing precast wall and floor systems.
Strategic Market Indicators:
India maintains strong growth at 5.3% CAGR through Smart Cities Mission infrastructure development, affordable housing schemes under Pradhan Mantri Awas Yojana, and industrial corridor construction across major economic zones. Government programs create sustained demand for precast residential buildings, transportation infrastructure, and industrial facilities supporting urbanization and economic development objectives. Mass housing initiatives emphasize rapid construction methods utilizing precast wall and floor systems achieving cost-effective delivery for millions of housing units across urban and peri-urban locations.
Smart city development drives primary consumption through integrated urban infrastructure including elevated metro systems, bus rapid transit facilities, and utility corridors utilizing precast components for rapid project execution. Affordable housing programs create substantial volume demand for standardized precast building systems enabling mass production and efficient site assembly.
Market Intelligence Brief:
China demonstrates robust growth at 4.8% CAGR through Belt and Road Initiative megaprojects, green building mandates supporting sustainable construction, and continued high-rise urban housing development across tier-1 and tier-2 cities. Government infrastructure programs drive sustained demand for precast bridge components, tunnel linings, and transportation structures, while residential construction increasingly adopts precast systems for rapid multi-story assembly and improved construction quality control. Green building standards favor precast methods reducing construction waste and improving energy efficiency through integrated insulation systems.
Belt and Road projects create international demand for Chinese precast exports supporting infrastructure development across participating countries, while domestic urbanization continues driving residential tower construction utilizing precast facade and structural systems. Market benefits from established manufacturing capacity, comprehensive supply chains, and government support for construction industrialization and prefabrication technology adoption improving construction productivity and quality standards.
Strategic Market Considerations:
Germany demonstrates steady expansion at 3.9% CAGR through EU green construction standards implementation, seismic retrofitting programs, and BIM-led design adoption optimizing precast system integration. Stringent sustainability codes favor precast methods reducing embodied carbon through optimized concrete mixtures and eliminating formwork waste, while building information modeling enables precise precast component coordination supporting complex architectural designs. Infrastructure renewal programs utilize precast for bridge rehabilitation, tunnel construction, and transportation facility modernization across major urban corridors.
Sustainability requirements drive primary demand as building codes increasingly mandate energy efficiency and carbon footprint reduction favoring insulated precast wall systems and optimized structural components, while digital design adoption enables architectural complexity using precast building envelope systems. Market benefits from established construction technology leadership, comprehensive manufacturing capabilities, and industry acceptance of off-site construction methods supporting quality control and construction efficiency objectives.
Market Intelligence Brief:
Brazil maintains substantial growth at 3.1% CAGR through metropolitan residential development programs, federal infrastructure partnership initiatives, and commercial construction expansion utilizing precast building systems across São Paulo, Rio de Janeiro, and emerging urban centers. Government-backed housing programs and transportation modernization projects drive precast concrete adoption, while urbanization pressures support off-site construction methods addressing construction efficiency and quality consistency requirements. Infrastructure investment priorities create sustained demand for precast structural components enabling accelerated project delivery timelines.
Technology deployment channels include construction companies implementing precast systems for residential tower developments and commercial complexes, infrastructure contractors utilizing precast bridge girders and tunnel segments for transportation projects, and industrial facility developers adopting tilt-up and precast solutions for logistics warehouses.
Strategic Market Indicators:
The UK market demonstrates growth at 2.9% CAGR through post-Brexit housing incentives, modular construction adoption in residential developments, and healthcare facility expansion utilizing precast building systems. British developers increasingly adopt off-site construction methods addressing skilled labor shortages and project timeline pressures, while government housing programs support modular residential delivery utilizing precast wall and floor systems. Healthcare infrastructure investment creates additional demand for precast construction enabling rapid facility delivery.
Strategic Market Indicators:
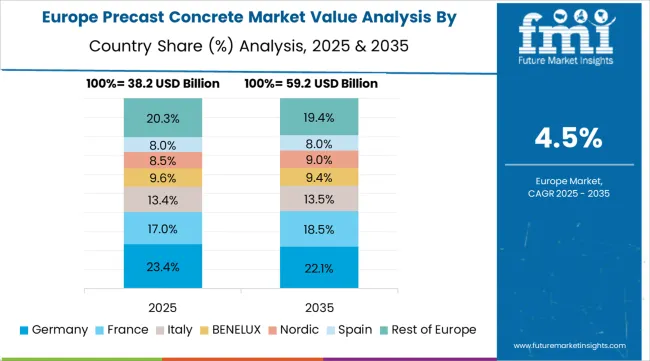
The European Precast Concrete market is projected to account for USD 39.1 billion in 2025, representing approximately 26.0% of global demand. Germany is expected to maintain its leadership position with a 24.5% market share, valued at USD 9.6 billion, supported by engineered wood substitution trends, infrastructure renewal programs, and strict sustainability codes driving energy-efficient precast wall systems across major urban centers including Berlin, Munich, and Frankfurt metropolitan regions.
The United Kingdom follows with a 17.1% share valued at USD 6.7 billion, driven by strong adoption in residential modular housing and urban regeneration projects addressing housing shortages in London, Manchester, and Birmingham regions. France holds a 15.3% share at USD 6.0 billion through growing use of low-carbon precast in public infrastructure and green housing programs supporting sustainable construction initiatives. Italy commands a 13.3% share valued at USD 5.2 billion through reliance on precast in seismic-resilient construction and transport infrastructure projects addressing earthquake preparedness and aging transportation networks. Spain accounts for 9.7% share at USD 3.8 billion aided by modular school and hospital construction programs boosting precast adoption in public facility development. The Netherlands maintains a 7.9% share valued at USD 3.1 billion through logistics hub developments and industrial park construction supporting trade infrastructure. Nordics (Sweden, Denmark, Finland, Norway) hold 7.4% share at USD 2.9 billion driven by high sustainability standards requiring insulated precast panel systems for energy-efficient building envelopes. Rest of Europe represents 4.8% at USD 1.8 billion reflecting Central and Eastern European precast adoption in highway construction and residential development programs.
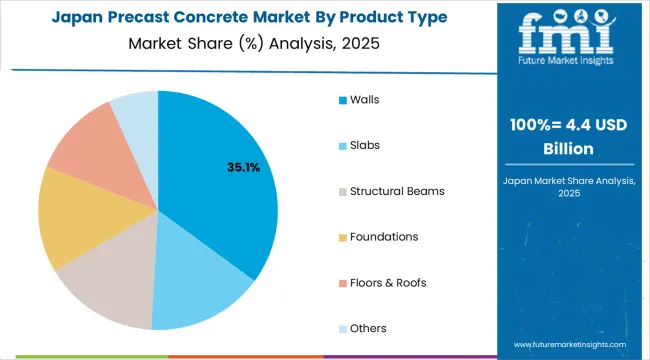
In Japan, the Precast Concrete market prioritizes insulated wall and structural panel systems, which capture dominant shares of prefabricated housing and disaster-resilient construction installations due to advanced features including seismic resistance optimization and seamless integration with existing building code requirements. Japanese construction companies emphasize structural integrity, thermal performance, and long-term durability, creating demand for engineered precast systems that provide stringent quality control and adaptive design capabilities based on seismic zone requirements and climate conditions. Traditional cast-in-place methods maintain positions in large-scale infrastructure where site-specific forming enables complex geometries, though precast increasingly gains acceptance in residential and commercial applications supporting construction efficiency and labor productivity objectives.
Market Characteristics:
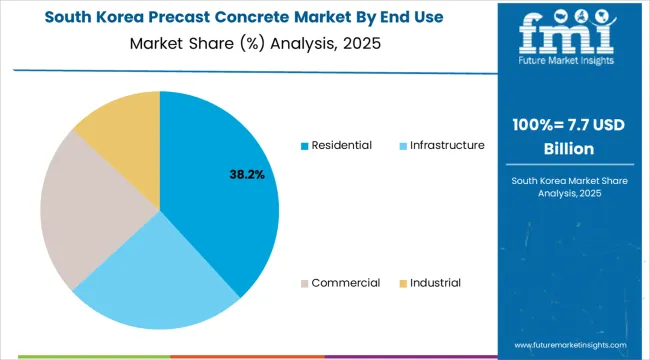
In South Korea, the market structure favors established construction materials companies and international producers including LafargeHolcim, CRH Plc, and regional manufacturers, which maintain positions through comprehensive product portfolios and construction industry networks supporting residential tower construction and infrastructure development projects. These providers offer integrated solutions combining precast concrete systems with technical support and engineering services appealing to Korean developers seeking reliable building material supply for high-rise construction and transportation infrastructure. Local producers capture market share by providing responsive service capabilities and competitive pricing for standard building applications, while international suppliers focus on specialized precast systems and comprehensive technical support tailored to Korean construction characteristics and building code requirements for seismic design and high-density urban development projects.
Channel Insights:
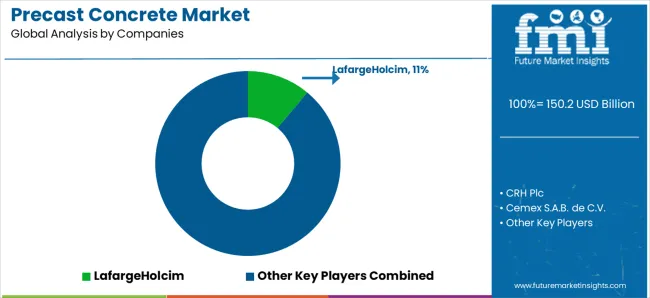
The precast concrete market is composed of 10–15 major players, with the top five companies holding around 60–65% of the global market share, driven by their large-scale production capabilities, extensive distribution networks, and strong relationships with construction and infrastructure sectors. Competition in the market primarily focuses on product durability, manufacturing efficiency, customization options, and compliance with environmental regulations, rather than price alone. LafargeHolcim leads the market with an 11% share, benefiting from its comprehensive portfolio of precast concrete solutions and its strong presence in residential, commercial, and infrastructure projects globally.
Market leaders such as LafargeHolcim, CRH Plc, Cemex S.A.B. de C.V., and Boral Limited maintain their dominant positions through established production facilities, innovative manufacturing techniques, and the ability to supply large-scale precast concrete products for high-demand construction projects. These companies also leverage their regional expertise, strong sustainability practices, and compliance with building standards to stay competitive in various construction segments.
Challengers like Forterra, Gulf Precast Concrete Co. LLC, Tindall Corporation, and Skanska AB focus on specialized precast concrete solutions for niche markets such as residential construction, infrastructure, and custom-built designs. Regional players such as Spancrete and Gülermak A.Ş. provide tailored precast products, with a focus on enhancing material performance and offering localized services to meet the growing demand for high-quality precast solutions in specific regions.
| Item | Value |
|---|---|
| Quantitative Units | USD 150.2 billion |
| Product Type | Walls, Slabs, Structural Beams, Foundations, Floors &Roofs, Others |
| Wall Sub-segments | Insulated Walls, Load-Bearing Structural Walls, Architectural/Facade Walls |
| End Use | Residential, Infrastructure, Commercial, Industrial |
| Residential Sub-segments | High-Rise/Mid-Rise Housing, Affordable/Mass Housing, Luxury/Architectural Homes |
| Regions Covered | Asia Pacific, North America, Europe, Latin America, Middle East &Africa |
| Countries Covered | United States, India, China, Germany, Japan, Brazil, United Kingdom, and 25+ additional countries |
| Key Companies Profiled | LafargeHolcim, CRH Plc, Cemex S.A.B. de C.V., Boral Limited, Forterra, Gulf Precast Concrete Co. LLC, Tindall Corporation, Skanska AB, Spancrete, and Gülermak A.Ş. |
| Additional Attributes | Dollar sales by product type and end-use categories, regional adoption trends across Asia Pacific, North America, and Europe, competitive landscape with building materials manufacturers and construction companies, customer preferences for construction speed and quality consistency, integration with building information modeling and modular construction platforms, innovations in sustainable concrete formulations and insulation integration, and development of automated manufacturing solutions with enhanced efficiency and customization capabilities. |
The global precast concrete market is estimated to be valued at USD 150.2 billion in 2025.
The market size for the precast concrete market is projected to reach USD 261.5 billion by 2035.
The precast concrete market is expected to grow at a 5.7% CAGR between 2025 and 2035.
The key product types in precast concrete market are walls , slabs, structural beams, foundations, floors & roofs and others.
In terms of end use, residential segment to command 37.0% share in the precast concrete market in 2025.


Our Research Products

The "Full Research Suite" delivers actionable market intel, deep dives on markets or technologies, so clients act faster, cut risk, and unlock growth.

The Leaderboard benchmarks and ranks top vendors, classifying them as Established Leaders, Leading Challengers, or Disruptors & Challengers.

Locates where complements amplify value and substitutes erode it, forecasting net impact by horizon

We deliver granular, decision-grade intel: market sizing, 5-year forecasts, pricing, adoption, usage, revenue, and operational KPIs—plus competitor tracking, regulation, and value chains—across 60 countries broadly.

Spot the shifts before they hit your P&L. We track inflection points, adoption curves, pricing moves, and ecosystem plays to show where demand is heading, why it is changing, and what to do next across high-growth markets and disruptive tech

Real-time reads of user behavior. We track shifting priorities, perceptions of today’s and next-gen services, and provider experience, then pace how fast tech moves from trial to adoption, blending buyer, consumer, and channel inputs with social signals (#WhySwitch, #UX).

Partner with our analyst team to build a custom report designed around your business priorities. From analysing market trends to assessing competitors or crafting bespoke datasets, we tailor insights to your needs.
Supplier Intelligence
Discovery & Profiling
Capacity & Footprint
Performance & Risk
Compliance & Governance
Commercial Readiness
Who Supplies Whom
Scorecards & Shortlists
Playbooks & Docs
Category Intelligence
Definition & Scope
Demand & Use Cases
Cost Drivers
Market Structure
Supply Chain Map
Trade & Policy
Operating Norms
Deliverables
Buyer Intelligence
Account Basics
Spend & Scope
Procurement Model
Vendor Requirements
Terms & Policies
Entry Strategy
Pain Points & Triggers
Outputs
Pricing Analysis
Benchmarks
Trends
Should-Cost
Indexation
Landed Cost
Commercial Terms
Deliverables
Brand Analysis
Positioning & Value Prop
Share & Presence
Customer Evidence
Go-to-Market
Digital & Reputation
Compliance & Trust
KPIs & Gaps
Outputs
Full Research Suite comprises of:
Market outlook & trends analysis
Interviews & case studies
Strategic recommendations
Vendor profiles & capabilities analysis
5-year forecasts
8 regions and 60+ country-level data splits
Market segment data splits
12 months of continuous data updates
DELIVERED AS:
PDF EXCEL ONLINE
Concrete Epoxy Repair Market Size and Share Forecast Outlook 2025 to 2035
Concrete Fiber Market Size and Share Forecast Outlook 2025 to 2035
Concrete Densification and Polishing Material Market Size and Share Forecast Outlook 2025 to 2035
Concrete Surface Retarders Market Size and Share Forecast Outlook 2025 to 2035
Concrete Densifier Market Size and Share Forecast Outlook 2025 to 2035
Concrete Containing Polymer Market Size and Share Forecast Outlook 2025 to 2035
Concrete Bonding Agents Market Size and Share Forecast Outlook 2025 to 2035
Concrete Block Making Machines Market Size and Share Forecast Outlook 2025 to 2035
Concrete Air Entraining Agents Market Size and Share Forecast Outlook 2025 to 2035
Concrete Placing Booms Market Size and Share Forecast Outlook 2025 to 2035
Concrete Accelerators And Retarders Market Size and Share Forecast Outlook 2025 to 2035
Concrete Chain Saw Market Size and Share Forecast Outlook 2025 to 2035
Concrete Surface Treatment Chemicals Market Size and Share Forecast Outlook 2025 to 2035
Concrete Paving Equipment Market Size and Share Forecast Outlook 2025 to 2035
Concrete Admixture Market Growth - Trends & Forecast 2025 to 2035
Concrete Floor Coatings Market Growth - Trends & Forecast 2025 to 2035
Concrete Saw Market Growth - Trends & Forecast 2025 to 2035
Concrete Delivery Hose Market Growth – Trends & Forecast 2024-2034
Concrete Testers Market Growth – Trends & Forecast 2025-2035
Market Share Insights for Hollow Concrete Blocks Providers

Thank you!
You will receive an email from our Business Development Manager. Please be sure to check your SPAM/JUNK folder too.
Chat With
MaRIA