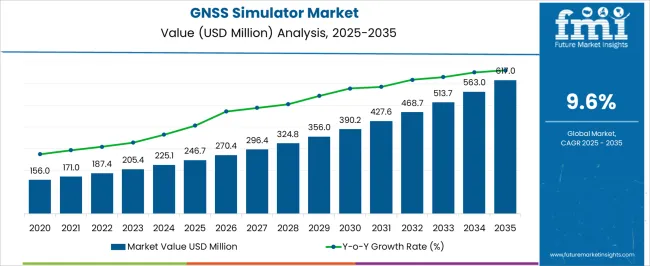
The GNSS simulator market is estimated to be valued at USD 225.1 million in 2024. The GNSS simulator is predicted to rise at a promising CAGR of 9.6% from 2024 to 2034. The global market is anticipated to reach USD 565 million by 2034.
Attributes | Key Insights |
---|---|
Estimated Market Size in 2024 | USD 225.1 million |
Projected Market Value in 2034 | USD 565 million |
Value-based CAGR from 2024 to 2034 | 9.6% |
Over the period from 2019 to 2023, the historical analysis indicates a robust CAGR of 12%. This signifies a period of significant growth and expansion within the market. Factors contributing to this growth may include technological advancements, increased consumer demand, and favorable economic conditions.
Companies operating within this timeframe likely experienced strong revenue growth and may have made strategic investments to capitalize on emerging opportunities.
Looking ahead to the forecasted period from 2024 to 2034, market projections suggest a slightly lower CAGR of 9.6%. While still indicating growth, this rate is slightly moderated compared to the previous five years. Several factors may contribute to this adjustment, including market saturation, regulatory changes, or shifts in consumer preferences.
Despite the slightly lower growth rate, the market is still expected to expand over this period, presenting opportunities for companies to innovate and adapt to changing dynamics.
Historical CAGR from 2019 to 2023 | 12% |
---|---|
Forecast CAGR from 2024 to 2034 | 9.6% |
The provided table illustrates the top five countries in terms of revenue, with South Korea leading the list.
One major reason South Korea leads the GNSS simulator market is its advanced electronics and automotive industries, which heavily rely on precise navigation systems for products like smartphones and autonomous vehicles.
Countries | The Forecast CAGRs from 2024 to 2034 |
---|---|
United States | 9.8% |
South Korea | 11.2% |
Japan | 10.8% |
China | 9.9% |
United Kingdom | 10.4% |
The forecasted CAGR for GNSS simulator usage in the United States is 9.8%. This high growth rate can be attributed to several factors. The United States is a global leader in technology and innovation, particularly in the aerospace, defense, and automotive industries.
As such, there is a significant demand for GNSS simulators in the country to support the development and testing of navigation systems for aircraft, unmanned aerial vehicles (UAVs), and autonomous vehicles.
The United States has a vast network of infrastructure, including highways, railways, and maritime routes, where precise positioning and navigation are essential for safety and efficiency. GNSS simulators play a crucial role in ensuring the reliability and accuracy of these navigation systems, driving their widespread adoption across various sectors in the country.
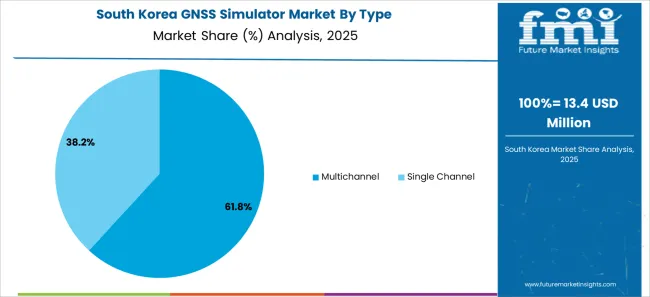
With a forecasted CAGR of 11.2%, South Korea demonstrates a strong demand for GNSS simulators. South Korea is known for its advanced technology ecosystem, particularly in the electronics and automotive industries.
In addition to consumer electronics and automotive applications, South Korea invests in emerging technologies such as smart cities and autonomous vehicles. GNSS simulators are essential for testing and validation purposes.
The government has been proactive in promoting the adoption of GNSS technology, further driving the GNSS simulators market growth in the country.
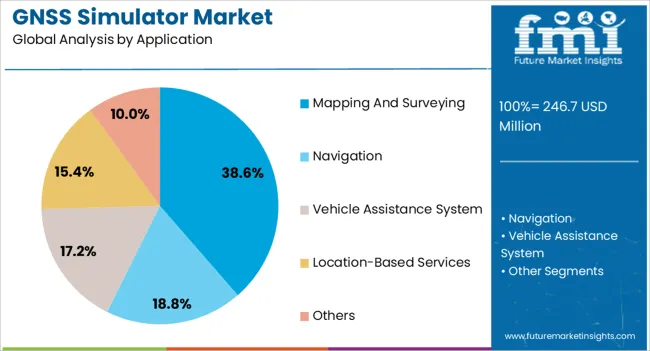
The forecasted CAGR for GNSS simulator usage is 10.8%, indicating a strong demand for these simulation tools. Japan is a global leader in various industries, including automotive, aerospace, and robotics, where GNSS technology plays a crucial role in navigation and positioning systems.
The aging population and mountainous terrain in Japan make precise positioning and navigation critical for transportation and disaster management applications, further driving the adoption of GNSS simulators in the country.
With a forecasted CAGR of 9.9%, China represents a significant market for GNSS simulators. As China is considered the largest automotive market and a growing technology innovation hub, it strongly demands GNSS simulation tools to support the development of autonomous vehicles, smart transportation systems, and precision agriculture applications.
The Belt and Road Initiative and space exploration efforts further contribute to the demand for GNSS simulators, crucial in satellite navigation and communication systems.
The United Kingdom has a forecasted CAGR of 10.4% for GNSS simulator usage, indicating a robust demand for these simulation tools in the country. The United Kingdom is a global leader in aerospace, defense, and maritime industries, where GNSS technology is essential for navigation, surveillance, and communication systems.
With the growing adoption of autonomous vehicles, drones, and unmanned aerial systems (UAS) in various sectors, including agriculture, infrastructure inspection, and emergency response, there is an increasing need for GNSS simulators to ensure the accuracy and reliability of these systems.
The commitment of the government to investing in space technology and satellite infrastructure further drives the demand for GNSS simulators in the country.
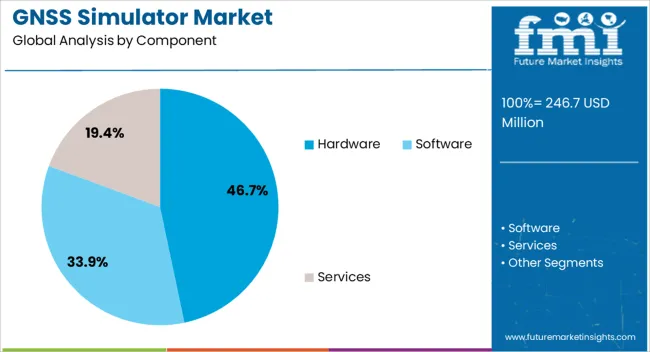
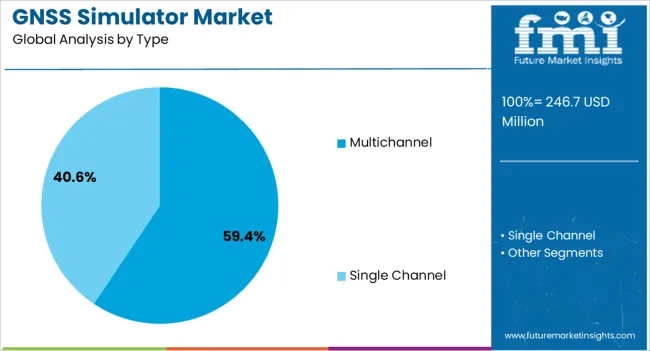
The below section shows the leading segment. Based on component, hardware type registers at 9.4% CAGR by 2034. Based on type, the single channel segment is anticipated to expand at 9.2% CAGR by 2034.
The demand for hardware components in GNSS simulators is driven by the increasing adoption of GNSS technology across various industries, including automotive, aerospace, and maritime.
The increasing adoption of GNSS technology in applications such as automotive navigation, precision agriculture, and surveying has created a demand for single-channel simulators that can accurately replicate GNSS signals for testing GNSS receivers and systems.
Category | CAGR from 2024 to 2034 |
---|---|
Hardware | 9.4% |
Single Channel | 9.2% |
The hardware type segment is forecasted to register a CAGR of 9.4% by 2034. This growth can be attributed to the increasing demand for physical components in GNSS simulators, such as signal generators, antennas, and receivers.
As the adoption of GNSS technology expands across various industries, there is a growing need for reliable and high-performance hardware components to support the development, testing, and validation of navigation systems.
The single channel segment is anticipated to expand at a CAGR of 9.2% by 2034. This growth is driven by the preference for single-channel GNSS simulators, which offer simplicity, cost-effectiveness, and ease of use compared to multi-channel simulators.
Single-channel simulators are commonly used to test and validate GNSS receivers and systems in applications such as automotive navigation, precision agriculture, and surveying. Advancements in single-channel simulation technology, such as improved accuracy and signal fidelity, further contribute to the growth of the segment.
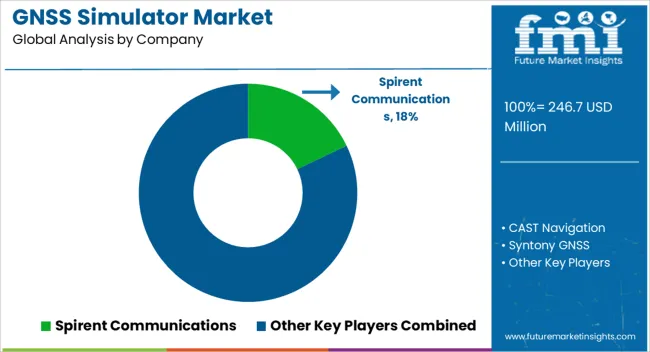
The competitive landscape of the GNSS simulator market is characterized by the presence of several key players, including leading companies that offer a wide range of GNSS simulation solutions tailored to various industries and applications, including automotive, aerospace, and telecommunications. Smaller players and niche providers offer specialized GNSS simulation products and services.
Competition in the market is driven by factors such as technological innovation, product performance, pricing, and customer service as companies strive to capture market share and meet the evolving needs of customers. Some of the key developments are:
Attributes | Details |
---|---|
Estimated Market Size in 2024 | USD 225.1 million |
Projected Market Valuation in 2034 | USD 565 million |
Value-based CAGR 2024 to 2034 | 9.6% |
Forecast Period | 2024 to 2034 |
Historical Data Available for | 2019 to 2023 |
Market Analysis | Value in USD million |
Key Regions Covered | North America; Latin America; Western Europe; Eastern Europe; South Asia and Pacific; East Asia; Middle East and Africa |
Key Market Segments Covered | Component, Type, GNSS Receiver, Application, End-Use Industry, Region |
Key Countries Profiled | The United States, Canada, Brazil, Mexico, Germany, The United Kingdom, France, Spain, Italy, Russia, Poland, Czech Republic, Romania, India, Bangladesh, Australia, New Zealand, China, Japan, South Korea, GCC countries, South Africa, Israel |
Key Companies Profiled | CAST Navigation; Syntony GNSS; Rohde & Schwarz; Keysight Technologies; VIAVI Solutions; Orolia; u-blox; Hexagon; Accord Software and System; Spirent Communications |
Table 1: Global Market Value (US$ Million) Forecast by Region, 2019 to 2034
Table 2: Global Market Volume (Units) Forecast by Region, 2019 to 2034
Table 3: Global Market Value (US$ Million) Forecast by Component, 2019 to 2034
Table 4: Global Market Volume (Units) Forecast by Component, 2019 to 2034
Table 5: Global Market Value (US$ Million) Forecast by Type, 2019 to 2034
Table 6: Global Market Volume (Units) Forecast by Type, 2019 to 2034
Table 7: Global Market Value (US$ Million) Forecast by GNSS Receiver, 2019 to 2034
Table 8: Global Market Volume (Units) Forecast by GNSS Receiver, 2019 to 2034
Table 9: Global Market Value (US$ Million) Forecast by Application, 2019 to 2034
Table 10: Global Market Volume (Units) Forecast by Application, 2019 to 2034
Table 11: Global Market Value (US$ Million) Forecast by End-Use Industry, 2019 to 2034
Table 12: Global Market Volume (Units) Forecast by End-Use Industry, 2019 to 2034
Table 13: North America Market Value (US$ Million) Forecast by Country, 2019 to 2034
Table 14: North America Market Volume (Units) Forecast by Country, 2019 to 2034
Table 15: North America Market Value (US$ Million) Forecast by Component, 2019 to 2034
Table 16: North America Market Volume (Units) Forecast by Component, 2019 to 2034
Table 17: North America Market Value (US$ Million) Forecast by Type, 2019 to 2034
Table 18: North America Market Volume (Units) Forecast by Type, 2019 to 2034
Table 19: North America Market Value (US$ Million) Forecast by GNSS Receiver, 2019 to 2034
Table 20: North America Market Volume (Units) Forecast by GNSS Receiver, 2019 to 2034
Table 21: North America Market Value (US$ Million) Forecast by Application, 2019 to 2034
Table 22: North America Market Volume (Units) Forecast by Application, 2019 to 2034
Table 23: North America Market Value (US$ Million) Forecast by End-Use Industry, 2019 to 2034
Table 24: North America Market Volume (Units) Forecast by End-Use Industry, 2019 to 2034
Table 25: Latin America Market Value (US$ Million) Forecast by Country, 2019 to 2034
Table 26: Latin America Market Volume (Units) Forecast by Country, 2019 to 2034
Table 27: Latin America Market Value (US$ Million) Forecast by Component, 2019 to 2034
Table 28: Latin America Market Volume (Units) Forecast by Component, 2019 to 2034
Table 29: Latin America Market Value (US$ Million) Forecast by Type, 2019 to 2034
Table 30: Latin America Market Volume (Units) Forecast by Type, 2019 to 2034
Table 31: Latin America Market Value (US$ Million) Forecast by GNSS Receiver, 2019 to 2034
Table 32: Latin America Market Volume (Units) Forecast by GNSS Receiver, 2019 to 2034
Table 33: Latin America Market Value (US$ Million) Forecast by Application, 2019 to 2034
Table 34: Latin America Market Volume (Units) Forecast by Application, 2019 to 2034
Table 35: Latin America Market Value (US$ Million) Forecast by End-Use Industry, 2019 to 2034
Table 36: Latin America Market Volume (Units) Forecast by End-Use Industry, 2019 to 2034
Table 37: Western Europe Market Value (US$ Million) Forecast by Country, 2019 to 2034
Table 38: Western Europe Market Volume (Units) Forecast by Country, 2019 to 2034
Table 39: Western Europe Market Value (US$ Million) Forecast by Component, 2019 to 2034
Table 40: Western Europe Market Volume (Units) Forecast by Component, 2019 to 2034
Table 41: Western Europe Market Value (US$ Million) Forecast by Type, 2019 to 2034
Table 42: Western Europe Market Volume (Units) Forecast by Type, 2019 to 2034
Table 43: Western Europe Market Value (US$ Million) Forecast by GNSS Receiver, 2019 to 2034
Table 44: Western Europe Market Volume (Units) Forecast by GNSS Receiver, 2019 to 2034
Table 45: Western Europe Market Value (US$ Million) Forecast by Application, 2019 to 2034
Table 46: Western Europe Market Volume (Units) Forecast by Application, 2019 to 2034
Table 47: Western Europe Market Value (US$ Million) Forecast by End-Use Industry, 2019 to 2034
Table 48: Western Europe Market Volume (Units) Forecast by End-Use Industry, 2019 to 2034
Table 49: Eastern Europe Market Value (US$ Million) Forecast by Country, 2019 to 2034
Table 50: Eastern Europe Market Volume (Units) Forecast by Country, 2019 to 2034
Table 51: Eastern Europe Market Value (US$ Million) Forecast by Component, 2019 to 2034
Table 52: Eastern Europe Market Volume (Units) Forecast by Component, 2019 to 2034
Table 53: Eastern Europe Market Value (US$ Million) Forecast by Type, 2019 to 2034
Table 54: Eastern Europe Market Volume (Units) Forecast by Type, 2019 to 2034
Table 55: Eastern Europe Market Value (US$ Million) Forecast by GNSS Receiver, 2019 to 2034
Table 56: Eastern Europe Market Volume (Units) Forecast by GNSS Receiver, 2019 to 2034
Table 57: Eastern Europe Market Value (US$ Million) Forecast by Application, 2019 to 2034
Table 58: Eastern Europe Market Volume (Units) Forecast by Application, 2019 to 2034
Table 59: Eastern Europe Market Value (US$ Million) Forecast by End-Use Industry, 2019 to 2034
Table 60: Eastern Europe Market Volume (Units) Forecast by End-Use Industry, 2019 to 2034
Table 61: South Asia and Pacific Market Value (US$ Million) Forecast by Country, 2019 to 2034
Table 62: South Asia and Pacific Market Volume (Units) Forecast by Country, 2019 to 2034
Table 63: South Asia and Pacific Market Value (US$ Million) Forecast by Component, 2019 to 2034
Table 64: South Asia and Pacific Market Volume (Units) Forecast by Component, 2019 to 2034
Table 65: South Asia and Pacific Market Value (US$ Million) Forecast by Type, 2019 to 2034
Table 66: South Asia and Pacific Market Volume (Units) Forecast by Type, 2019 to 2034
Table 67: South Asia and Pacific Market Value (US$ Million) Forecast by GNSS Receiver, 2019 to 2034
Table 68: South Asia and Pacific Market Volume (Units) Forecast by GNSS Receiver, 2019 to 2034
Table 69: South Asia and Pacific Market Value (US$ Million) Forecast by Application, 2019 to 2034
Table 70: South Asia and Pacific Market Volume (Units) Forecast by Application, 2019 to 2034
Table 71: South Asia and Pacific Market Value (US$ Million) Forecast by End-Use Industry, 2019 to 2034
Table 72: South Asia and Pacific Market Volume (Units) Forecast by End-Use Industry, 2019 to 2034
Table 73: East Asia Market Value (US$ Million) Forecast by Country, 2019 to 2034
Table 74: East Asia Market Volume (Units) Forecast by Country, 2019 to 2034
Table 75: East Asia Market Value (US$ Million) Forecast by Component, 2019 to 2034
Table 76: East Asia Market Volume (Units) Forecast by Component, 2019 to 2034
Table 77: East Asia Market Value (US$ Million) Forecast by Type, 2019 to 2034
Table 78: East Asia Market Volume (Units) Forecast by Type, 2019 to 2034
Table 79: East Asia Market Value (US$ Million) Forecast by GNSS Receiver, 2019 to 2034
Table 80: East Asia Market Volume (Units) Forecast by GNSS Receiver, 2019 to 2034
Table 81: East Asia Market Value (US$ Million) Forecast by Application, 2019 to 2034
Table 82: East Asia Market Volume (Units) Forecast by Application, 2019 to 2034
Table 83: East Asia Market Value (US$ Million) Forecast by End-Use Industry, 2019 to 2034
Table 84: East Asia Market Volume (Units) Forecast by End-Use Industry, 2019 to 2034
Table 85: Middle East and Africa Market Value (US$ Million) Forecast by Country, 2019 to 2034
Table 86: Middle East and Africa Market Volume (Units) Forecast by Country, 2019 to 2034
Table 87: Middle East and Africa Market Value (US$ Million) Forecast by Component, 2019 to 2034
Table 88: Middle East and Africa Market Volume (Units) Forecast by Component, 2019 to 2034
Table 89: Middle East and Africa Market Value (US$ Million) Forecast by Type, 2019 to 2034
Table 90: Middle East and Africa Market Volume (Units) Forecast by Type, 2019 to 2034
Table 91: Middle East and Africa Market Value (US$ Million) Forecast by GNSS Receiver, 2019 to 2034
Table 92: Middle East and Africa Market Volume (Units) Forecast by GNSS Receiver, 2019 to 2034
Table 93: Middle East and Africa Market Value (US$ Million) Forecast by Application, 2019 to 2034
Table 94: Middle East and Africa Market Volume (Units) Forecast by Application, 2019 to 2034
Table 95: Middle East and Africa Market Value (US$ Million) Forecast by End-Use Industry, 2019 to 2034
Table 96: Middle East and Africa Market Volume (Units) Forecast by End-Use Industry, 2019 to 2034
Figure 1: Global Market Value (US$ Million) by Component, 2024 to 2034
Figure 2: Global Market Value (US$ Million) by Type, 2024 to 2034
Figure 3: Global Market Value (US$ Million) by GNSS Receiver, 2024 to 2034
Figure 4: Global Market Value (US$ Million) by Application, 2024 to 2034
Figure 5: Global Market Value (US$ Million) by End-Use Industry, 2024 to 2034
Figure 6: Global Market Value (US$ Million) by Region, 2024 to 2034
Figure 7: Global Market Value (US$ Million) Analysis by Region, 2019 to 2034
Figure 8: Global Market Volume (Units) Analysis by Region, 2019 to 2034
Figure 9: Global Market Value Share (%) and BPS Analysis by Region, 2024 to 2034
Figure 10: Global Market Y-o-Y Growth (%) Projections by Region, 2024 to 2034
Figure 11: Global Market Value (US$ Million) Analysis by Component, 2019 to 2034
Figure 12: Global Market Volume (Units) Analysis by Component, 2019 to 2034
Figure 13: Global Market Value Share (%) and BPS Analysis by Component, 2024 to 2034
Figure 14: Global Market Y-o-Y Growth (%) Projections by Component, 2024 to 2034
Figure 15: Global Market Value (US$ Million) Analysis by Type, 2019 to 2034
Figure 16: Global Market Volume (Units) Analysis by Type, 2019 to 2034
Figure 17: Global Market Value Share (%) and BPS Analysis by Type, 2024 to 2034
Figure 18: Global Market Y-o-Y Growth (%) Projections by Type, 2024 to 2034
Figure 19: Global Market Value (US$ Million) Analysis by GNSS Receiver, 2019 to 2034
Figure 20: Global Market Volume (Units) Analysis by GNSS Receiver, 2019 to 2034
Figure 21: Global Market Value Share (%) and BPS Analysis by GNSS Receiver, 2024 to 2034
Figure 22: Global Market Y-o-Y Growth (%) Projections by GNSS Receiver, 2024 to 2034
Figure 23: Global Market Value (US$ Million) Analysis by Application, 2019 to 2034
Figure 24: Global Market Volume (Units) Analysis by Application, 2019 to 2034
Figure 25: Global Market Value Share (%) and BPS Analysis by Application, 2024 to 2034
Figure 26: Global Market Y-o-Y Growth (%) Projections by Application, 2024 to 2034
Figure 27: Global Market Value (US$ Million) Analysis by End-Use Industry, 2019 to 2034
Figure 28: Global Market Volume (Units) Analysis by End-Use Industry, 2019 to 2034
Figure 29: Global Market Value Share (%) and BPS Analysis by End-Use Industry, 2024 to 2034
Figure 30: Global Market Y-o-Y Growth (%) Projections by End-Use Industry, 2024 to 2034
Figure 31: Global Market Attractiveness by Component, 2024 to 2034
Figure 32: Global Market Attractiveness by Type, 2024 to 2034
Figure 33: Global Market Attractiveness by GNSS Receiver, 2024 to 2034
Figure 34: Global Market Attractiveness by Application, 2024 to 2034
Figure 35: Global Market Attractiveness by End-Use Industry, 2024 to 2034
Figure 36: Global Market Attractiveness by Region, 2024 to 2034
Figure 37: North America Market Value (US$ Million) by Component, 2024 to 2034
Figure 38: North America Market Value (US$ Million) by Type, 2024 to 2034
Figure 39: North America Market Value (US$ Million) by GNSS Receiver, 2024 to 2034
Figure 40: North America Market Value (US$ Million) by Application, 2024 to 2034
Figure 41: North America Market Value (US$ Million) by End-Use Industry, 2024 to 2034
Figure 42: North America Market Value (US$ Million) by Country, 2024 to 2034
Figure 43: North America Market Value (US$ Million) Analysis by Country, 2019 to 2034
Figure 44: North America Market Volume (Units) Analysis by Country, 2019 to 2034
Figure 45: North America Market Value Share (%) and BPS Analysis by Country, 2024 to 2034
Figure 46: North America Market Y-o-Y Growth (%) Projections by Country, 2024 to 2034
Figure 47: North America Market Value (US$ Million) Analysis by Component, 2019 to 2034
Figure 48: North America Market Volume (Units) Analysis by Component, 2019 to 2034
Figure 49: North America Market Value Share (%) and BPS Analysis by Component, 2024 to 2034
Figure 50: North America Market Y-o-Y Growth (%) Projections by Component, 2024 to 2034
Figure 51: North America Market Value (US$ Million) Analysis by Type, 2019 to 2034
Figure 52: North America Market Volume (Units) Analysis by Type, 2019 to 2034
Figure 53: North America Market Value Share (%) and BPS Analysis by Type, 2024 to 2034
Figure 54: North America Market Y-o-Y Growth (%) Projections by Type, 2024 to 2034
Figure 55: North America Market Value (US$ Million) Analysis by GNSS Receiver, 2019 to 2034
Figure 56: North America Market Volume (Units) Analysis by GNSS Receiver, 2019 to 2034
Figure 57: North America Market Value Share (%) and BPS Analysis by GNSS Receiver, 2024 to 2034
Figure 58: North America Market Y-o-Y Growth (%) Projections by GNSS Receiver, 2024 to 2034
Figure 59: North America Market Value (US$ Million) Analysis by Application, 2019 to 2034
Figure 60: North America Market Volume (Units) Analysis by Application, 2019 to 2034
Figure 61: North America Market Value Share (%) and BPS Analysis by Application, 2024 to 2034
Figure 62: North America Market Y-o-Y Growth (%) Projections by Application, 2024 to 2034
Figure 63: North America Market Value (US$ Million) Analysis by End-Use Industry, 2019 to 2034
Figure 64: North America Market Volume (Units) Analysis by End-Use Industry, 2019 to 2034
Figure 65: North America Market Value Share (%) and BPS Analysis by End-Use Industry, 2024 to 2034
Figure 66: North America Market Y-o-Y Growth (%) Projections by End-Use Industry, 2024 to 2034
Figure 67: North America Market Attractiveness by Component, 2024 to 2034
Figure 68: North America Market Attractiveness by Type, 2024 to 2034
Figure 69: North America Market Attractiveness by GNSS Receiver, 2024 to 2034
Figure 70: North America Market Attractiveness by Application, 2024 to 2034
Figure 71: North America Market Attractiveness by End-Use Industry, 2024 to 2034
Figure 72: North America Market Attractiveness by Country, 2024 to 2034
Figure 73: Latin America Market Value (US$ Million) by Component, 2024 to 2034
Figure 74: Latin America Market Value (US$ Million) by Type, 2024 to 2034
Figure 75: Latin America Market Value (US$ Million) by GNSS Receiver, 2024 to 2034
Figure 76: Latin America Market Value (US$ Million) by Application, 2024 to 2034
Figure 77: Latin America Market Value (US$ Million) by End-Use Industry, 2024 to 2034
Figure 78: Latin America Market Value (US$ Million) by Country, 2024 to 2034
Figure 79: Latin America Market Value (US$ Million) Analysis by Country, 2019 to 2034
Figure 80: Latin America Market Volume (Units) Analysis by Country, 2019 to 2034
Figure 81: Latin America Market Value Share (%) and BPS Analysis by Country, 2024 to 2034
Figure 82: Latin America Market Y-o-Y Growth (%) Projections by Country, 2024 to 2034
Figure 83: Latin America Market Value (US$ Million) Analysis by Component, 2019 to 2034
Figure 84: Latin America Market Volume (Units) Analysis by Component, 2019 to 2034
Figure 85: Latin America Market Value Share (%) and BPS Analysis by Component, 2024 to 2034
Figure 86: Latin America Market Y-o-Y Growth (%) Projections by Component, 2024 to 2034
Figure 87: Latin America Market Value (US$ Million) Analysis by Type, 2019 to 2034
Figure 88: Latin America Market Volume (Units) Analysis by Type, 2019 to 2034
Figure 89: Latin America Market Value Share (%) and BPS Analysis by Type, 2024 to 2034
Figure 90: Latin America Market Y-o-Y Growth (%) Projections by Type, 2024 to 2034
Figure 91: Latin America Market Value (US$ Million) Analysis by GNSS Receiver, 2019 to 2034
Figure 92: Latin America Market Volume (Units) Analysis by GNSS Receiver, 2019 to 2034
Figure 93: Latin America Market Value Share (%) and BPS Analysis by GNSS Receiver, 2024 to 2034
Figure 94: Latin America Market Y-o-Y Growth (%) Projections by GNSS Receiver, 2024 to 2034
Figure 95: Latin America Market Value (US$ Million) Analysis by Application, 2019 to 2034
Figure 96: Latin America Market Volume (Units) Analysis by Application, 2019 to 2034
Figure 97: Latin America Market Value Share (%) and BPS Analysis by Application, 2024 to 2034
Figure 98: Latin America Market Y-o-Y Growth (%) Projections by Application, 2024 to 2034
Figure 99: Latin America Market Value (US$ Million) Analysis by End-Use Industry, 2019 to 2034
Figure 100: Latin America Market Volume (Units) Analysis by End-Use Industry, 2019 to 2034
Figure 101: Latin America Market Value Share (%) and BPS Analysis by End-Use Industry, 2024 to 2034
Figure 102: Latin America Market Y-o-Y Growth (%) Projections by End-Use Industry, 2024 to 2034
Figure 103: Latin America Market Attractiveness by Component, 2024 to 2034
Figure 104: Latin America Market Attractiveness by Type, 2024 to 2034
Figure 105: Latin America Market Attractiveness by GNSS Receiver, 2024 to 2034
Figure 106: Latin America Market Attractiveness by Application, 2024 to 2034
Figure 107: Latin America Market Attractiveness by End-Use Industry, 2024 to 2034
Figure 108: Latin America Market Attractiveness by Country, 2024 to 2034
Figure 109: Western Europe Market Value (US$ Million) by Component, 2024 to 2034
Figure 110: Western Europe Market Value (US$ Million) by Type, 2024 to 2034
Figure 111: Western Europe Market Value (US$ Million) by GNSS Receiver, 2024 to 2034
Figure 112: Western Europe Market Value (US$ Million) by Application, 2024 to 2034
Figure 113: Western Europe Market Value (US$ Million) by End-Use Industry, 2024 to 2034
Figure 114: Western Europe Market Value (US$ Million) by Country, 2024 to 2034
Figure 115: Western Europe Market Value (US$ Million) Analysis by Country, 2019 to 2034
Figure 116: Western Europe Market Volume (Units) Analysis by Country, 2019 to 2034
Figure 117: Western Europe Market Value Share (%) and BPS Analysis by Country, 2024 to 2034
Figure 118: Western Europe Market Y-o-Y Growth (%) Projections by Country, 2024 to 2034
Figure 119: Western Europe Market Value (US$ Million) Analysis by Component, 2019 to 2034
Figure 120: Western Europe Market Volume (Units) Analysis by Component, 2019 to 2034
Figure 121: Western Europe Market Value Share (%) and BPS Analysis by Component, 2024 to 2034
Figure 122: Western Europe Market Y-o-Y Growth (%) Projections by Component, 2024 to 2034
Figure 123: Western Europe Market Value (US$ Million) Analysis by Type, 2019 to 2034
Figure 124: Western Europe Market Volume (Units) Analysis by Type, 2019 to 2034
Figure 125: Western Europe Market Value Share (%) and BPS Analysis by Type, 2024 to 2034
Figure 126: Western Europe Market Y-o-Y Growth (%) Projections by Type, 2024 to 2034
Figure 127: Western Europe Market Value (US$ Million) Analysis by GNSS Receiver, 2019 to 2034
Figure 128: Western Europe Market Volume (Units) Analysis by GNSS Receiver, 2019 to 2034
Figure 129: Western Europe Market Value Share (%) and BPS Analysis by GNSS Receiver, 2024 to 2034
Figure 130: Western Europe Market Y-o-Y Growth (%) Projections by GNSS Receiver, 2024 to 2034
Figure 131: Western Europe Market Value (US$ Million) Analysis by Application, 2019 to 2034
Figure 132: Western Europe Market Volume (Units) Analysis by Application, 2019 to 2034
Figure 133: Western Europe Market Value Share (%) and BPS Analysis by Application, 2024 to 2034
Figure 134: Western Europe Market Y-o-Y Growth (%) Projections by Application, 2024 to 2034
Figure 135: Western Europe Market Value (US$ Million) Analysis by End-Use Industry, 2019 to 2034
Figure 136: Western Europe Market Volume (Units) Analysis by End-Use Industry, 2019 to 2034
Figure 137: Western Europe Market Value Share (%) and BPS Analysis by End-Use Industry, 2024 to 2034
Figure 138: Western Europe Market Y-o-Y Growth (%) Projections by End-Use Industry, 2024 to 2034
Figure 139: Western Europe Market Attractiveness by Component, 2024 to 2034
Figure 140: Western Europe Market Attractiveness by Type, 2024 to 2034
Figure 141: Western Europe Market Attractiveness by GNSS Receiver, 2024 to 2034
Figure 142: Western Europe Market Attractiveness by Application, 2024 to 2034
Figure 143: Western Europe Market Attractiveness by End-Use Industry, 2024 to 2034
Figure 144: Western Europe Market Attractiveness by Country, 2024 to 2034
Figure 145: Eastern Europe Market Value (US$ Million) by Component, 2024 to 2034
Figure 146: Eastern Europe Market Value (US$ Million) by Type, 2024 to 2034
Figure 147: Eastern Europe Market Value (US$ Million) by GNSS Receiver, 2024 to 2034
Figure 148: Eastern Europe Market Value (US$ Million) by Application, 2024 to 2034
Figure 149: Eastern Europe Market Value (US$ Million) by End-Use Industry, 2024 to 2034
Figure 150: Eastern Europe Market Value (US$ Million) by Country, 2024 to 2034
Figure 151: Eastern Europe Market Value (US$ Million) Analysis by Country, 2019 to 2034
Figure 152: Eastern Europe Market Volume (Units) Analysis by Country, 2019 to 2034
Figure 153: Eastern Europe Market Value Share (%) and BPS Analysis by Country, 2024 to 2034
Figure 154: Eastern Europe Market Y-o-Y Growth (%) Projections by Country, 2024 to 2034
Figure 155: Eastern Europe Market Value (US$ Million) Analysis by Component, 2019 to 2034
Figure 156: Eastern Europe Market Volume (Units) Analysis by Component, 2019 to 2034
Figure 157: Eastern Europe Market Value Share (%) and BPS Analysis by Component, 2024 to 2034
Figure 158: Eastern Europe Market Y-o-Y Growth (%) Projections by Component, 2024 to 2034
Figure 159: Eastern Europe Market Value (US$ Million) Analysis by Type, 2019 to 2034
Figure 160: Eastern Europe Market Volume (Units) Analysis by Type, 2019 to 2034
Figure 161: Eastern Europe Market Value Share (%) and BPS Analysis by Type, 2024 to 2034
Figure 162: Eastern Europe Market Y-o-Y Growth (%) Projections by Type, 2024 to 2034
Figure 163: Eastern Europe Market Value (US$ Million) Analysis by GNSS Receiver, 2019 to 2034
Figure 164: Eastern Europe Market Volume (Units) Analysis by GNSS Receiver, 2019 to 2034
Figure 165: Eastern Europe Market Value Share (%) and BPS Analysis by GNSS Receiver, 2024 to 2034
Figure 166: Eastern Europe Market Y-o-Y Growth (%) Projections by GNSS Receiver, 2024 to 2034
Figure 167: Eastern Europe Market Value (US$ Million) Analysis by Application, 2019 to 2034
Figure 168: Eastern Europe Market Volume (Units) Analysis by Application, 2019 to 2034
Figure 169: Eastern Europe Market Value Share (%) and BPS Analysis by Application, 2024 to 2034
Figure 170: Eastern Europe Market Y-o-Y Growth (%) Projections by Application, 2024 to 2034
Figure 171: Eastern Europe Market Value (US$ Million) Analysis by End-Use Industry, 2019 to 2034
Figure 172: Eastern Europe Market Volume (Units) Analysis by End-Use Industry, 2019 to 2034
Figure 173: Eastern Europe Market Value Share (%) and BPS Analysis by End-Use Industry, 2024 to 2034
Figure 174: Eastern Europe Market Y-o-Y Growth (%) Projections by End-Use Industry, 2024 to 2034
Figure 175: Eastern Europe Market Attractiveness by Component, 2024 to 2034
Figure 176: Eastern Europe Market Attractiveness by Type, 2024 to 2034
Figure 177: Eastern Europe Market Attractiveness by GNSS Receiver, 2024 to 2034
Figure 178: Eastern Europe Market Attractiveness by Application, 2024 to 2034
Figure 179: Eastern Europe Market Attractiveness by End-Use Industry, 2024 to 2034
Figure 180: Eastern Europe Market Attractiveness by Country, 2024 to 2034
Figure 181: South Asia and Pacific Market Value (US$ Million) by Component, 2024 to 2034
Figure 182: South Asia and Pacific Market Value (US$ Million) by Type, 2024 to 2034
Figure 183: South Asia and Pacific Market Value (US$ Million) by GNSS Receiver, 2024 to 2034
Figure 184: South Asia and Pacific Market Value (US$ Million) by Application, 2024 to 2034
Figure 185: South Asia and Pacific Market Value (US$ Million) by End-Use Industry, 2024 to 2034
Figure 186: South Asia and Pacific Market Value (US$ Million) by Country, 2024 to 2034
Figure 187: South Asia and Pacific Market Value (US$ Million) Analysis by Country, 2019 to 2034
Figure 188: South Asia and Pacific Market Volume (Units) Analysis by Country, 2019 to 2034
Figure 189: South Asia and Pacific Market Value Share (%) and BPS Analysis by Country, 2024 to 2034
Figure 190: South Asia and Pacific Market Y-o-Y Growth (%) Projections by Country, 2024 to 2034
Figure 191: South Asia and Pacific Market Value (US$ Million) Analysis by Component, 2019 to 2034
Figure 192: South Asia and Pacific Market Volume (Units) Analysis by Component, 2019 to 2034
Figure 193: South Asia and Pacific Market Value Share (%) and BPS Analysis by Component, 2024 to 2034
Figure 194: South Asia and Pacific Market Y-o-Y Growth (%) Projections by Component, 2024 to 2034
Figure 195: South Asia and Pacific Market Value (US$ Million) Analysis by Type, 2019 to 2034
Figure 196: South Asia and Pacific Market Volume (Units) Analysis by Type, 2019 to 2034
Figure 197: South Asia and Pacific Market Value Share (%) and BPS Analysis by Type, 2024 to 2034
Figure 198: South Asia and Pacific Market Y-o-Y Growth (%) Projections by Type, 2024 to 2034
Figure 199: South Asia and Pacific Market Value (US$ Million) Analysis by GNSS Receiver, 2019 to 2034
Figure 200: South Asia and Pacific Market Volume (Units) Analysis by GNSS Receiver, 2019 to 2034
Figure 201: South Asia and Pacific Market Value Share (%) and BPS Analysis by GNSS Receiver, 2024 to 2034
Figure 202: South Asia and Pacific Market Y-o-Y Growth (%) Projections by GNSS Receiver, 2024 to 2034
Figure 203: South Asia and Pacific Market Value (US$ Million) Analysis by Application, 2019 to 2034
Figure 204: South Asia and Pacific Market Volume (Units) Analysis by Application, 2019 to 2034
Figure 205: South Asia and Pacific Market Value Share (%) and BPS Analysis by Application, 2024 to 2034
Figure 206: South Asia and Pacific Market Y-o-Y Growth (%) Projections by Application, 2024 to 2034
Figure 207: South Asia and Pacific Market Value (US$ Million) Analysis by End-Use Industry, 2019 to 2034
Figure 208: South Asia and Pacific Market Volume (Units) Analysis by End-Use Industry, 2019 to 2034
Figure 209: South Asia and Pacific Market Value Share (%) and BPS Analysis by End-Use Industry, 2024 to 2034
Figure 210: South Asia and Pacific Market Y-o-Y Growth (%) Projections by End-Use Industry, 2024 to 2034
Figure 211: South Asia and Pacific Market Attractiveness by Component, 2024 to 2034
Figure 212: South Asia and Pacific Market Attractiveness by Type, 2024 to 2034
Figure 213: South Asia and Pacific Market Attractiveness by GNSS Receiver, 2024 to 2034
Figure 214: South Asia and Pacific Market Attractiveness by Application, 2024 to 2034
Figure 215: South Asia and Pacific Market Attractiveness by End-Use Industry, 2024 to 2034
Figure 216: South Asia and Pacific Market Attractiveness by Country, 2024 to 2034
Figure 217: East Asia Market Value (US$ Million) by Component, 2024 to 2034
Figure 218: East Asia Market Value (US$ Million) by Type, 2024 to 2034
Figure 219: East Asia Market Value (US$ Million) by GNSS Receiver, 2024 to 2034
Figure 220: East Asia Market Value (US$ Million) by Application, 2024 to 2034
Figure 221: East Asia Market Value (US$ Million) by End-Use Industry, 2024 to 2034
Figure 222: East Asia Market Value (US$ Million) by Country, 2024 to 2034
Figure 223: East Asia Market Value (US$ Million) Analysis by Country, 2019 to 2034
Figure 224: East Asia Market Volume (Units) Analysis by Country, 2019 to 2034
Figure 225: East Asia Market Value Share (%) and BPS Analysis by Country, 2024 to 2034
Figure 226: East Asia Market Y-o-Y Growth (%) Projections by Country, 2024 to 2034
Figure 227: East Asia Market Value (US$ Million) Analysis by Component, 2019 to 2034
Figure 228: East Asia Market Volume (Units) Analysis by Component, 2019 to 2034
Figure 229: East Asia Market Value Share (%) and BPS Analysis by Component, 2024 to 2034
Figure 230: East Asia Market Y-o-Y Growth (%) Projections by Component, 2024 to 2034
Figure 231: East Asia Market Value (US$ Million) Analysis by Type, 2019 to 2034
Figure 232: East Asia Market Volume (Units) Analysis by Type, 2019 to 2034
Figure 233: East Asia Market Value Share (%) and BPS Analysis by Type, 2024 to 2034
Figure 234: East Asia Market Y-o-Y Growth (%) Projections by Type, 2024 to 2034
Figure 235: East Asia Market Value (US$ Million) Analysis by GNSS Receiver, 2019 to 2034
Figure 236: East Asia Market Volume (Units) Analysis by GNSS Receiver, 2019 to 2034
Figure 237: East Asia Market Value Share (%) and BPS Analysis by GNSS Receiver, 2024 to 2034
Figure 238: East Asia Market Y-o-Y Growth (%) Projections by GNSS Receiver, 2024 to 2034
Figure 239: East Asia Market Value (US$ Million) Analysis by Application, 2019 to 2034
Figure 240: East Asia Market Volume (Units) Analysis by Application, 2019 to 2034
Figure 241: East Asia Market Value Share (%) and BPS Analysis by Application, 2024 to 2034
Figure 242: East Asia Market Y-o-Y Growth (%) Projections by Application, 2024 to 2034
Figure 243: East Asia Market Value (US$ Million) Analysis by End-Use Industry, 2019 to 2034
Figure 244: East Asia Market Volume (Units) Analysis by End-Use Industry, 2019 to 2034
Figure 245: East Asia Market Value Share (%) and BPS Analysis by End-Use Industry, 2024 to 2034
Figure 246: East Asia Market Y-o-Y Growth (%) Projections by End-Use Industry, 2024 to 2034
Figure 247: East Asia Market Attractiveness by Component, 2024 to 2034
Figure 248: East Asia Market Attractiveness by Type, 2024 to 2034
Figure 249: East Asia Market Attractiveness by GNSS Receiver, 2024 to 2034
Figure 250: East Asia Market Attractiveness by Application, 2024 to 2034
Figure 251: East Asia Market Attractiveness by End-Use Industry, 2024 to 2034
Figure 252: East Asia Market Attractiveness by Country, 2024 to 2034
Figure 253: Middle East and Africa Market Value (US$ Million) by Component, 2024 to 2034
Figure 254: Middle East and Africa Market Value (US$ Million) by Type, 2024 to 2034
Figure 255: Middle East and Africa Market Value (US$ Million) by GNSS Receiver, 2024 to 2034
Figure 256: Middle East and Africa Market Value (US$ Million) by Application, 2024 to 2034
Figure 257: Middle East and Africa Market Value (US$ Million) by End-Use Industry, 2024 to 2034
Figure 258: Middle East and Africa Market Value (US$ Million) by Country, 2024 to 2034
Figure 259: Middle East and Africa Market Value (US$ Million) Analysis by Country, 2019 to 2034
Figure 260: Middle East and Africa Market Volume (Units) Analysis by Country, 2019 to 2034
Figure 261: Middle East and Africa Market Value Share (%) and BPS Analysis by Country, 2024 to 2034
Figure 262: Middle East and Africa Market Y-o-Y Growth (%) Projections by Country, 2024 to 2034
Figure 263: Middle East and Africa Market Value (US$ Million) Analysis by Component, 2019 to 2034
Figure 264: Middle East and Africa Market Volume (Units) Analysis by Component, 2019 to 2034
Figure 265: Middle East and Africa Market Value Share (%) and BPS Analysis by Component, 2024 to 2034
Figure 266: Middle East and Africa Market Y-o-Y Growth (%) Projections by Component, 2024 to 2034
Figure 267: Middle East and Africa Market Value (US$ Million) Analysis by Type, 2019 to 2034
Figure 268: Middle East and Africa Market Volume (Units) Analysis by Type, 2019 to 2034
Figure 269: Middle East and Africa Market Value Share (%) and BPS Analysis by Type, 2024 to 2034
Figure 270: Middle East and Africa Market Y-o-Y Growth (%) Projections by Type, 2024 to 2034
Figure 271: Middle East and Africa Market Value (US$ Million) Analysis by GNSS Receiver, 2019 to 2034
Figure 272: Middle East and Africa Market Volume (Units) Analysis by GNSS Receiver, 2019 to 2034
Figure 273: Middle East and Africa Market Value Share (%) and BPS Analysis by GNSS Receiver, 2024 to 2034
Figure 274: Middle East and Africa Market Y-o-Y Growth (%) Projections by GNSS Receiver, 2024 to 2034
Figure 275: Middle East and Africa Market Value (US$ Million) Analysis by Application, 2019 to 2034
Figure 276: Middle East and Africa Market Volume (Units) Analysis by Application, 2019 to 2034
Figure 277: Middle East and Africa Market Value Share (%) and BPS Analysis by Application, 2024 to 2034
Figure 278: Middle East and Africa Market Y-o-Y Growth (%) Projections by Application, 2024 to 2034
Figure 279: Middle East and Africa Market Value (US$ Million) Analysis by End-Use Industry, 2019 to 2034
Figure 280: Middle East and Africa Market Volume (Units) Analysis by End-Use Industry, 2019 to 2034
Figure 281: Middle East and Africa Market Value Share (%) and BPS Analysis by End-Use Industry, 2024 to 2034
Figure 282: Middle East and Africa Market Y-o-Y Growth (%) Projections by End-Use Industry, 2024 to 2034
Figure 283: Middle East and Africa Market Attractiveness by Component, 2024 to 2034
Figure 284: Middle East and Africa Market Attractiveness by Type, 2024 to 2034
Figure 285: Middle East and Africa Market Attractiveness by GNSS Receiver, 2024 to 2034
Figure 286: Middle East and Africa Market Attractiveness by Application, 2024 to 2034
Figure 287: Middle East and Africa Market Attractiveness by End-Use Industry, 2024 to 2034
Figure 288: Middle East and Africa Market Attractiveness by Country, 2024 to 2034
As of 2024, the market for GNSS simulators is expected to be valued at USD 225.1 million.
By 2034, the market value of the GNSS simulator is expected to reach USD 565 million.
From 2024 to 2034, the GNSS simulator market is expected to flourish at a CAGR of 9.6%.
The single channel segment is expected to expand at 9.2% CAGR by 2034.
South Korea is likely the top-performing market, with a CAGR of 11.2%.
Thank you!
You will receive an email from our Business Development Manager. Please be sure to check your SPAM/JUNK folder too.