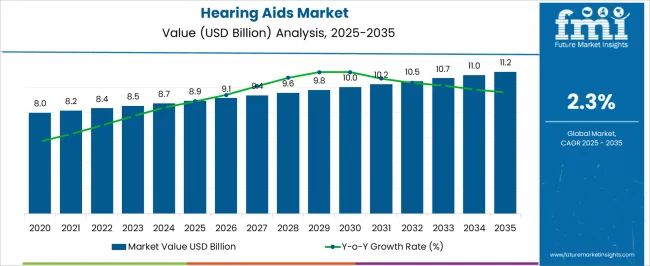
The global hearing aids market is expected to grow between 2024 and 2034 at a CAGR of 2.3%. The market is expected to increase due to the growing geriatric population, the rising incidence of hearing loss, the increasing usage of hearing aids, and the growing awareness of technologically sophisticated devices for auditory impairment. The demand for hearing aids is expected to grow from USD 8.74 billion in 2024 to USD 10.98 billion by 2034.
Consumption Analysis of the Hearing Aids Sector
Attributes | Details |
---|---|
Hearing Aids Market Value for 2024 | USD 8.74 billion |
Hearing Aids Market Value for 2034 | USD 10.98 billion |
Hearing Aids Market Forecast CAGR for 2024 to 2034 | 2.3% |
Over the last half-decade, the hearing aids sector has witnessed a favorable trend, with a CAGR of 0.1%. The hearing aids market is expected to continue expanding, albeit at a slow pace, with a projected CAGR of 2.3% through the year 2034.
Historical CAGR | 0.1% |
---|
Healthcare providers in developing countries require more financial resources to invest in modern technologies, such as advanced hearing aids. This requires extensive research and development and extensive staff training for safe and efficient maintenance. The development in the hearing aids market leads to increased manufacturing costs and higher prices for the end customers.
Crucial factors that are anticipated to influence the demand for hearing aids through 2034.
Industry participants are going to desire to be wise and flexible over the anticipated period since these difficult attributes position the industry for success in subsequent decades.
Global Hearing Aids Market Trends Bluetooth Connectivity
Bluetooth technology has greatly enhanced the global hearing aid industry by improving user engagement and experience. It enables wireless connection to various audio sources, removing the need for cords and adapters.
Bluetooth-enabled hearing aids provide direct audio streaming, which improves the listening experience. It is also feasible to communicate hands-free, particularly for individuals who struggle with dexterity.
Many hearing aids come with companion mobile apps that allow remote control of settings, allowing users to personalize their listening experience. These aids also integrate with smartphones and tablets, allowing users to receive notifications, access digital assistant services, and control smart home devices directly.
As Bluetooth technology becomes more standardized across devices and platforms, it offers improved compatibility with a wide range of audio sources and accessories, ensuring a seamless user experience. As Bluetooth technology continues to evolve, further innovations are expected to enhance the capabilities and usability of hearing aids, ultimately improving the quality of life for individuals with hearing loss.
Emerging Trend of OTC Hearing Aids Exaggerates Global Demand
The rise of over-the-counter (OTC) hearing aids and direct-to-consumer (DTC) models is revolutionizing the hearing healthcare industry by offering affordable, convenient options for mild to moderate hearing loss.
A larger spectrum of customers are able to employ these gadgets because they need a prescription or a professional fitting. Because of its simple design and ability to self-fit, consumers may alter their gadgets without making additional appointments.
High-quality sound amplification is ensured via wireless connectivity, cutting-edge digital signal processing technology, and configurable features available on some models. Regulatory agencies such as the FDA have implemented new regulations to facilitate the market's introduction.
The trend of using over-the-counter (OTC) hearing aids and direct-to-consumer (DTC) hearing aids is expected to persist, providing greater accessibility and empowerment to individuals with hearing impairment.
Advancements in Self-fitting Hearing Aids Skyrockets in Hearing Aids Market
Self-fitting hearing aids have revolutionized the hearing technology market by eliminating the need for multiple appointments with audiologists or healthcare professionals, making hearing aids more accessible to a wider population.
The hearing impairment devices allow users to customize and adjust according to their preferences, enhancing their satisfaction and engagement. The aids are also more cost effective than traditional hearing aids, making them more accessible to those for whom higher costs may have deterred the demand for hearing aids.
Self-fitting hearing aids also use advanced digital signal processing technology and wireless connectivity features, providing high-quality sound amplification and connectivity options. As technology evolves and regulatory barriers are addressed, self-fitting hearing aids are poised to become increasingly prevalent, driving market growth and improving the quality of life for individuals with hearing impairment.
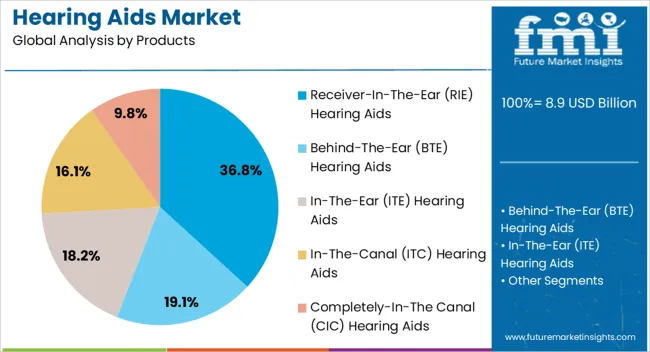
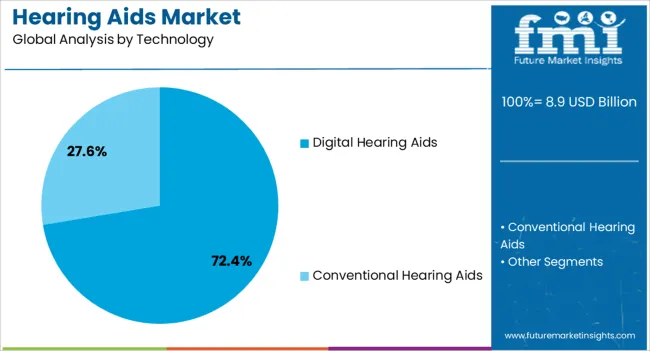
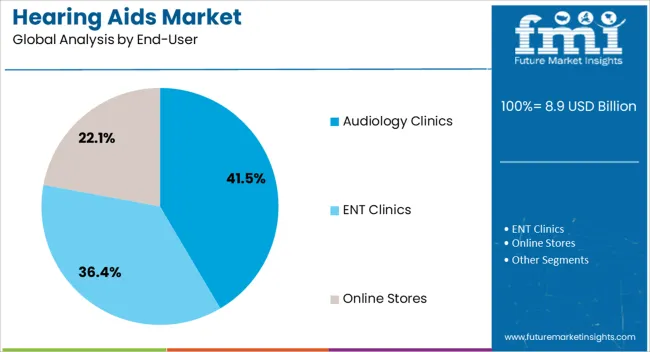
This section offers in-depth analyses of particular hearing impairment aids market sectors. The two main topics of the research are the segment with the Receiver-In-The-Ear (RIE) hearing aids and the audiology clinics as an end-user segment.
Through a comprehensive examination, this section provides a fuller knowledge of these segments and their relevance in the larger hearing assistance devices market context.
Attributes | Details |
---|---|
Top Product | Receiver-in-the-Ear (RIE) Hearing Aids |
Market share in 2024 | 83% |
The need to preserve optimal conditions for the infrastructure supporting hearing healthcare drives the need for RIE hearing aids. The following factors, which together account for a significant 83% of the market in 2024, illustrate the rise in demand for receiver-in-the-ear (RIE) hearing aids:
Attributes | Details |
---|---|
Top End User | Audiology Clinics |
Market share in 2024 | 47% |
The growing demand for hearing aids is developed in the audiology clinics, acquiring almost 47% of the market share in 2024. The demand for hearing aids in audiology clinics is displayed from the following drivers:
China, Japan, Germany, India, and the United Kingdom are some of the most predominant nations on the global stage, and this section anticipates looking at their auditory devices market. Examine the several aspects influencing these nations' need for, acceptance of, and interactions with hearing aids via a thorough investigation.
Countries | CAGR from 2024 to 2034 |
---|---|
China | 4.5% |
Japan | 1.9% |
United Kingdom | 2.3% |
Germany | 2.8% |
India | 7.1% |
The hearing aids market in China is expected to develop at a CAGR of 4.5%. A significant number of assistive listening devices and a growing geriatric population in China drive the industry. The following factors are propelling the industry's expansion:
The United Kingdom's ENT healthcare sector is embracing novel and modern hearing aids due to rising demand. The industry is developing with a CAGR of 2.3% from 2024 to 2034. Here are a few of the major trends:
The hearing aid industry in Germany is adopting modern technology for the treatment of hearing. The sector is predicted to grow at a CAGR of 2.8% between 2024 and 2034. Some of the primary trends in the industry are:
Japan's digital hearing aid demand is anticipated to swell in the forthcoming decade, owing to the highly developed ENT treatment sector. The market is expected to register a CAGR of 1.9% by 2034. Among the primary drivers are:
The Indian ENT treatment sector develops a significant demand for advanced hearing aids. The demand for hearing aids is expected to increase at a CAGR of approximately 7.1% from 2024 to 2034. Some of the primary trends are:
The global hearing aids industry is being significantly shaped by market players who invest heavily in research and development, introduce new features, and expand their product portfolios to cater to diverse consumer needs.
The companies offer a wide range of hearing aid models, including behind-the-ear (BTE), in-the-ear (ITE), receiver-in-the-ear (RIE), and completely-in-the-canal (CIC), with varying styles, features, and price points.
Companies aim to make hearing aids more accessible and affordable by implementing pricing strategies, offering financing options, and partnering with insurance providers. The key players also explore innovative distribution channels and direct-to-consumer models to reach underserved markets.
Market players collaborate with healthcare providers, audiologists, and research institutions to enhance product development, promote awareness, and improve access to hearing healthcare services. Many of the prominent organizations ensure compliance with regulatory standards to maintain product quality, safety, and efficacy.
The manufacturers of hearing aids prioritize customer experience by offering personalized consultations, fitting services, and ongoing user support. The market players invest in customer education programs, user-friendly interfaces, and remote care solutions to enhance satisfaction and loyalty among hearing aid users.
Market players play a pivotal role in shaping the outlook of the global hearing aids industry by driving innovation, expanding access, fostering partnerships, ensuring compliance, and delivering exceptional customer experiences.
Recent Developments in the Hearing Aids Industry
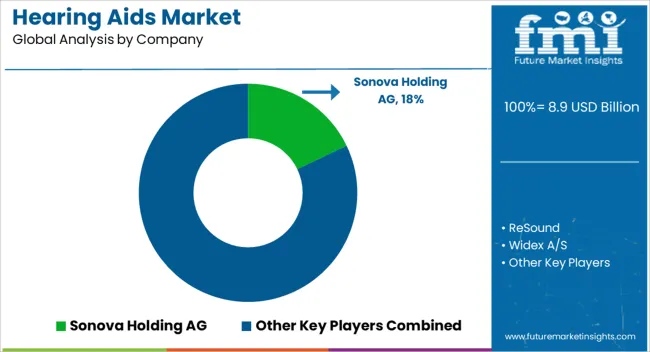
Table 1: Global Market Value (US$ Million) Forecast by Region, 2019 to 2034
Table 2: Global Market Volume (Units) Forecast by Region, 2019 to 2034
Table 3: Global Market Value (US$ Million) Forecast by Product Type, 2019 to 2034
Table 4: Global Market Volume (Units) Forecast by Product Type, 2019 to 2034
Table 5: Global Market Value (US$ Million) Forecast by Implants, 2019 to 2034
Table 6: Global Market Volume (Units) Forecast by Implants, 2019 to 2034
Table 7: Global Market Value (US$ Million) Forecast by Type of Hearing Loss, 2019 to 2034
Table 8: Global Market Volume (Units) Forecast by Type of Hearing Loss, 2019 to 2034
Table 9: Global Market Value (US$ Million) Forecast by Patient Type, 2019 to 2034
Table 10: Global Market Volume (Units) Forecast by Patient Type, 2019 to 2034
Table 11: North America Market Value (US$ Million) Forecast by Country, 2019 to 2034
Table 12: North America Market Volume (Units) Forecast by Country, 2019 to 2034
Table 13: North America Market Value (US$ Million) Forecast by Product Type, 2019 to 2034
Table 14: North America Market Volume (Units) Forecast by Product Type, 2019 to 2034
Table 15: North America Market Value (US$ Million) Forecast by Implants, 2019 to 2034
Table 16: North America Market Volume (Units) Forecast by Implants, 2019 to 2034
Table 17: North America Market Value (US$ Million) Forecast by Type of Hearing Loss, 2019 to 2034
Table 18: North America Market Volume (Units) Forecast by Type of Hearing Loss, 2019 to 2034
Table 19: North America Market Value (US$ Million) Forecast by Patient Type, 2019 to 2034
Table 20: North America Market Volume (Units) Forecast by Patient Type, 2019 to 2034
Table 21: Latin America Market Value (US$ Million) Forecast by Country, 2019 to 2034
Table 22: Latin America Market Volume (Units) Forecast by Country, 2019 to 2034
Table 23: Latin America Market Value (US$ Million) Forecast by Product Type, 2019 to 2034
Table 24: Latin America Market Volume (Units) Forecast by Product Type, 2019 to 2034
Table 25: Latin America Market Value (US$ Million) Forecast by Implants, 2019 to 2034
Table 26: Latin America Market Volume (Units) Forecast by Implants, 2019 to 2034
Table 27: Latin America Market Value (US$ Million) Forecast by Type of Hearing Loss, 2019 to 2034
Table 28: Latin America Market Volume (Units) Forecast by Type of Hearing Loss, 2019 to 2034
Table 29: Latin America Market Value (US$ Million) Forecast by Patient Type, 2019 to 2034
Table 30: Latin America Market Volume (Units) Forecast by Patient Type, 2019 to 2034
Table 31: Western Europe Market Value (US$ Million) Forecast by Country, 2019 to 2034
Table 32: Western Europe Market Volume (Units) Forecast by Country, 2019 to 2034
Table 33: Western Europe Market Value (US$ Million) Forecast by Product Type, 2019 to 2034
Table 34: Western Europe Market Volume (Units) Forecast by Product Type, 2019 to 2034
Table 35: Western Europe Market Value (US$ Million) Forecast by Implants, 2019 to 2034
Table 36: Western Europe Market Volume (Units) Forecast by Implants, 2019 to 2034
Table 37: Western Europe Market Value (US$ Million) Forecast by Type of Hearing Loss, 2019 to 2034
Table 38: Western Europe Market Volume (Units) Forecast by Type of Hearing Loss, 2019 to 2034
Table 39: Western Europe Market Value (US$ Million) Forecast by Patient Type, 2019 to 2034
Table 40: Western Europe Market Volume (Units) Forecast by Patient Type, 2019 to 2034
Table 41: Eastern Europe Market Value (US$ Million) Forecast by Country, 2019 to 2034
Table 42: Eastern Europe Market Volume (Units) Forecast by Country, 2019 to 2034
Table 43: Eastern Europe Market Value (US$ Million) Forecast by Product Type, 2019 to 2034
Table 44: Eastern Europe Market Volume (Units) Forecast by Product Type, 2019 to 2034
Table 45: Eastern Europe Market Value (US$ Million) Forecast by Implants, 2019 to 2034
Table 46: Eastern Europe Market Volume (Units) Forecast by Implants, 2019 to 2034
Table 47: Eastern Europe Market Value (US$ Million) Forecast by Type of Hearing Loss, 2019 to 2034
Table 48: Eastern Europe Market Volume (Units) Forecast by Type of Hearing Loss, 2019 to 2034
Table 49: Eastern Europe Market Value (US$ Million) Forecast by Patient Type, 2019 to 2034
Table 50: Eastern Europe Market Volume (Units) Forecast by Patient Type, 2019 to 2034
Table 51: South Asia and Pacific Market Value (US$ Million) Forecast by Country, 2019 to 2034
Table 52: South Asia and Pacific Market Volume (Units) Forecast by Country, 2019 to 2034
Table 53: South Asia and Pacific Market Value (US$ Million) Forecast by Product Type, 2019 to 2034
Table 54: South Asia and Pacific Market Volume (Units) Forecast by Product Type, 2019 to 2034
Table 55: South Asia and Pacific Market Value (US$ Million) Forecast by Implants, 2019 to 2034
Table 56: South Asia and Pacific Market Volume (Units) Forecast by Implants, 2019 to 2034
Table 57: South Asia and Pacific Market Value (US$ Million) Forecast by Type of Hearing Loss, 2019 to 2034
Table 58: South Asia and Pacific Market Volume (Units) Forecast by Type of Hearing Loss, 2019 to 2034
Table 59: South Asia and Pacific Market Value (US$ Million) Forecast by Patient Type, 2019 to 2034
Table 60: South Asia and Pacific Market Volume (Units) Forecast by Patient Type, 2019 to 2034
Table 61: East Asia Market Value (US$ Million) Forecast by Country, 2019 to 2034
Table 62: East Asia Market Volume (Units) Forecast by Country, 2019 to 2034
Table 63: East Asia Market Value (US$ Million) Forecast by Product Type, 2019 to 2034
Table 64: East Asia Market Volume (Units) Forecast by Product Type, 2019 to 2034
Table 65: East Asia Market Value (US$ Million) Forecast by Implants, 2019 to 2034
Table 66: East Asia Market Volume (Units) Forecast by Implants, 2019 to 2034
Table 67: East Asia Market Value (US$ Million) Forecast by Type of Hearing Loss, 2019 to 2034
Table 68: East Asia Market Volume (Units) Forecast by Type of Hearing Loss, 2019 to 2034
Table 69: East Asia Market Value (US$ Million) Forecast by Patient Type, 2019 to 2034
Table 70: East Asia Market Volume (Units) Forecast by Patient Type, 2019 to 2034
Table 71: Middle East and Africa Market Value (US$ Million) Forecast by Country, 2019 to 2034
Table 72: Middle East and Africa Market Volume (Units) Forecast by Country, 2019 to 2034
Table 73: Middle East and Africa Market Value (US$ Million) Forecast by Product Type, 2019 to 2034
Table 74: Middle East and Africa Market Volume (Units) Forecast by Product Type, 2019 to 2034
Table 75: Middle East and Africa Market Value (US$ Million) Forecast by Implants, 2019 to 2034
Table 76: Middle East and Africa Market Volume (Units) Forecast by Implants, 2019 to 2034
Table 77: Middle East and Africa Market Value (US$ Million) Forecast by Type of Hearing Loss, 2019 to 2034
Table 78: Middle East and Africa Market Volume (Units) Forecast by Type of Hearing Loss, 2019 to 2034
Table 79: Middle East and Africa Market Value (US$ Million) Forecast by Patient Type, 2019 to 2034
Table 80: Middle East and Africa Market Volume (Units) Forecast by Patient Type, 2019 to 2034
Figure 1: Global Market Value (US$ Million) by Product Type, 2024 to 2034
Figure 2: Global Market Value (US$ Million) by Implants, 2024 to 2034
Figure 3: Global Market Value (US$ Million) by Type of Hearing Loss, 2024 to 2034
Figure 4: Global Market Value (US$ Million) by Patient Type, 2024 to 2034
Figure 5: Global Market Value (US$ Million) by Region, 2024 to 2034
Figure 6: Global Market Value (US$ Million) Analysis by Region, 2019 to 2034
Figure 7: Global Market Volume (Units) Analysis by Region, 2019 to 2034
Figure 8: Global Market Value Share (%) and BPS Analysis by Region, 2024 to 2034
Figure 9: Global Market Y-o-Y Growth (%) Projections by Region, 2024 to 2034
Figure 10: Global Market Value (US$ Million) Analysis by Product Type, 2019 to 2034
Figure 11: Global Market Volume (Units) Analysis by Product Type, 2019 to 2034
Figure 12: Global Market Value Share (%) and BPS Analysis by Product Type, 2024 to 2034
Figure 13: Global Market Y-o-Y Growth (%) Projections by Product Type, 2024 to 2034
Figure 14: Global Market Value (US$ Million) Analysis by Implants, 2019 to 2034
Figure 15: Global Market Volume (Units) Analysis by Implants, 2019 to 2034
Figure 16: Global Market Value Share (%) and BPS Analysis by Implants, 2024 to 2034
Figure 17: Global Market Y-o-Y Growth (%) Projections by Implants, 2024 to 2034
Figure 18: Global Market Value (US$ Million) Analysis by Type of Hearing Loss, 2019 to 2034
Figure 19: Global Market Volume (Units) Analysis by Type of Hearing Loss, 2019 to 2034
Figure 20: Global Market Value Share (%) and BPS Analysis by Type of Hearing Loss, 2024 to 2034
Figure 21: Global Market Y-o-Y Growth (%) Projections by Type of Hearing Loss, 2024 to 2034
Figure 22: Global Market Value (US$ Million) Analysis by Patient Type, 2019 to 2034
Figure 23: Global Market Volume (Units) Analysis by Patient Type, 2019 to 2034
Figure 24: Global Market Value Share (%) and BPS Analysis by Patient Type, 2024 to 2034
Figure 25: Global Market Y-o-Y Growth (%) Projections by Patient Type, 2024 to 2034
Figure 26: Global Market Attractiveness by Product Type, 2024 to 2034
Figure 27: Global Market Attractiveness by Implants, 2024 to 2034
Figure 28: Global Market Attractiveness by Type of Hearing Loss, 2024 to 2034
Figure 29: Global Market Attractiveness by Patient Type, 2024 to 2034
Figure 30: Global Market Attractiveness by Region, 2024 to 2034
Figure 31: North America Market Value (US$ Million) by Product Type, 2024 to 2034
Figure 32: North America Market Value (US$ Million) by Implants, 2024 to 2034
Figure 33: North America Market Value (US$ Million) by Type of Hearing Loss, 2024 to 2034
Figure 34: North America Market Value (US$ Million) by Patient Type, 2024 to 2034
Figure 35: North America Market Value (US$ Million) by Country, 2024 to 2034
Figure 36: North America Market Value (US$ Million) Analysis by Country, 2019 to 2034
Figure 37: North America Market Volume (Units) Analysis by Country, 2019 to 2034
Figure 38: North America Market Value Share (%) and BPS Analysis by Country, 2024 to 2034
Figure 39: North America Market Y-o-Y Growth (%) Projections by Country, 2024 to 2034
Figure 40: North America Market Value (US$ Million) Analysis by Product Type, 2019 to 2034
Figure 41: North America Market Volume (Units) Analysis by Product Type, 2019 to 2034
Figure 42: North America Market Value Share (%) and BPS Analysis by Product Type, 2024 to 2034
Figure 43: North America Market Y-o-Y Growth (%) Projections by Product Type, 2024 to 2034
Figure 44: North America Market Value (US$ Million) Analysis by Implants, 2019 to 2034
Figure 45: North America Market Volume (Units) Analysis by Implants, 2019 to 2034
Figure 46: North America Market Value Share (%) and BPS Analysis by Implants, 2024 to 2034
Figure 47: North America Market Y-o-Y Growth (%) Projections by Implants, 2024 to 2034
Figure 48: North America Market Value (US$ Million) Analysis by Type of Hearing Loss, 2019 to 2034
Figure 49: North America Market Volume (Units) Analysis by Type of Hearing Loss, 2019 to 2034
Figure 50: North America Market Value Share (%) and BPS Analysis by Type of Hearing Loss, 2024 to 2034
Figure 51: North America Market Y-o-Y Growth (%) Projections by Type of Hearing Loss, 2024 to 2034
Figure 52: North America Market Value (US$ Million) Analysis by Patient Type, 2019 to 2034
Figure 53: North America Market Volume (Units) Analysis by Patient Type, 2019 to 2034
Figure 54: North America Market Value Share (%) and BPS Analysis by Patient Type, 2024 to 2034
Figure 55: North America Market Y-o-Y Growth (%) Projections by Patient Type, 2024 to 2034
Figure 56: North America Market Attractiveness by Product Type, 2024 to 2034
Figure 57: North America Market Attractiveness by Implants, 2024 to 2034
Figure 58: North America Market Attractiveness by Type of Hearing Loss, 2024 to 2034
Figure 59: North America Market Attractiveness by Patient Type, 2024 to 2034
Figure 60: North America Market Attractiveness by Country, 2024 to 2034
Figure 61: Latin America Market Value (US$ Million) by Product Type, 2024 to 2034
Figure 62: Latin America Market Value (US$ Million) by Implants, 2024 to 2034
Figure 63: Latin America Market Value (US$ Million) by Type of Hearing Loss, 2024 to 2034
Figure 64: Latin America Market Value (US$ Million) by Patient Type, 2024 to 2034
Figure 65: Latin America Market Value (US$ Million) by Country, 2024 to 2034
Figure 66: Latin America Market Value (US$ Million) Analysis by Country, 2019 to 2034
Figure 67: Latin America Market Volume (Units) Analysis by Country, 2019 to 2034
Figure 68: Latin America Market Value Share (%) and BPS Analysis by Country, 2024 to 2034
Figure 69: Latin America Market Y-o-Y Growth (%) Projections by Country, 2024 to 2034
Figure 70: Latin America Market Value (US$ Million) Analysis by Product Type, 2019 to 2034
Figure 71: Latin America Market Volume (Units) Analysis by Product Type, 2019 to 2034
Figure 72: Latin America Market Value Share (%) and BPS Analysis by Product Type, 2024 to 2034
Figure 73: Latin America Market Y-o-Y Growth (%) Projections by Product Type, 2024 to 2034
Figure 74: Latin America Market Value (US$ Million) Analysis by Implants, 2019 to 2034
Figure 75: Latin America Market Volume (Units) Analysis by Implants, 2019 to 2034
Figure 76: Latin America Market Value Share (%) and BPS Analysis by Implants, 2024 to 2034
Figure 77: Latin America Market Y-o-Y Growth (%) Projections by Implants, 2024 to 2034
Figure 78: Latin America Market Value (US$ Million) Analysis by Type of Hearing Loss, 2019 to 2034
Figure 79: Latin America Market Volume (Units) Analysis by Type of Hearing Loss, 2019 to 2034
Figure 80: Latin America Market Value Share (%) and BPS Analysis by Type of Hearing Loss, 2024 to 2034
Figure 81: Latin America Market Y-o-Y Growth (%) Projections by Type of Hearing Loss, 2024 to 2034
Figure 82: Latin America Market Value (US$ Million) Analysis by Patient Type, 2019 to 2034
Figure 83: Latin America Market Volume (Units) Analysis by Patient Type, 2019 to 2034
Figure 84: Latin America Market Value Share (%) and BPS Analysis by Patient Type, 2024 to 2034
Figure 85: Latin America Market Y-o-Y Growth (%) Projections by Patient Type, 2024 to 2034
Figure 86: Latin America Market Attractiveness by Product Type, 2024 to 2034
Figure 87: Latin America Market Attractiveness by Implants, 2024 to 2034
Figure 88: Latin America Market Attractiveness by Type of Hearing Loss, 2024 to 2034
Figure 89: Latin America Market Attractiveness by Patient Type, 2024 to 2034
Figure 90: Latin America Market Attractiveness by Country, 2024 to 2034
Figure 91: Western Europe Market Value (US$ Million) by Product Type, 2024 to 2034
Figure 92: Western Europe Market Value (US$ Million) by Implants, 2024 to 2034
Figure 93: Western Europe Market Value (US$ Million) by Type of Hearing Loss, 2024 to 2034
Figure 94: Western Europe Market Value (US$ Million) by Patient Type, 2024 to 2034
Figure 95: Western Europe Market Value (US$ Million) by Country, 2024 to 2034
Figure 96: Western Europe Market Value (US$ Million) Analysis by Country, 2019 to 2034
Figure 97: Western Europe Market Volume (Units) Analysis by Country, 2019 to 2034
Figure 98: Western Europe Market Value Share (%) and BPS Analysis by Country, 2024 to 2034
Figure 99: Western Europe Market Y-o-Y Growth (%) Projections by Country, 2024 to 2034
Figure 100: Western Europe Market Value (US$ Million) Analysis by Product Type, 2019 to 2034
Figure 101: Western Europe Market Volume (Units) Analysis by Product Type, 2019 to 2034
Figure 102: Western Europe Market Value Share (%) and BPS Analysis by Product Type, 2024 to 2034
Figure 103: Western Europe Market Y-o-Y Growth (%) Projections by Product Type, 2024 to 2034
Figure 104: Western Europe Market Value (US$ Million) Analysis by Implants, 2019 to 2034
Figure 105: Western Europe Market Volume (Units) Analysis by Implants, 2019 to 2034
Figure 106: Western Europe Market Value Share (%) and BPS Analysis by Implants, 2024 to 2034
Figure 107: Western Europe Market Y-o-Y Growth (%) Projections by Implants, 2024 to 2034
Figure 108: Western Europe Market Value (US$ Million) Analysis by Type of Hearing Loss, 2019 to 2034
Figure 109: Western Europe Market Volume (Units) Analysis by Type of Hearing Loss, 2019 to 2034
Figure 110: Western Europe Market Value Share (%) and BPS Analysis by Type of Hearing Loss, 2024 to 2034
Figure 111: Western Europe Market Y-o-Y Growth (%) Projections by Type of Hearing Loss, 2024 to 2034
Figure 112: Western Europe Market Value (US$ Million) Analysis by Patient Type, 2019 to 2034
Figure 113: Western Europe Market Volume (Units) Analysis by Patient Type, 2019 to 2034
Figure 114: Western Europe Market Value Share (%) and BPS Analysis by Patient Type, 2024 to 2034
Figure 115: Western Europe Market Y-o-Y Growth (%) Projections by Patient Type, 2024 to 2034
Figure 116: Western Europe Market Attractiveness by Product Type, 2024 to 2034
Figure 117: Western Europe Market Attractiveness by Implants, 2024 to 2034
Figure 118: Western Europe Market Attractiveness by Type of Hearing Loss, 2024 to 2034
Figure 119: Western Europe Market Attractiveness by Patient Type, 2024 to 2034
Figure 120: Western Europe Market Attractiveness by Country, 2024 to 2034
Figure 121: Eastern Europe Market Value (US$ Million) by Product Type, 2024 to 2034
Figure 122: Eastern Europe Market Value (US$ Million) by Implants, 2024 to 2034
Figure 123: Eastern Europe Market Value (US$ Million) by Type of Hearing Loss, 2024 to 2034
Figure 124: Eastern Europe Market Value (US$ Million) by Patient Type, 2024 to 2034
Figure 125: Eastern Europe Market Value (US$ Million) by Country, 2024 to 2034
Figure 126: Eastern Europe Market Value (US$ Million) Analysis by Country, 2019 to 2034
Figure 127: Eastern Europe Market Volume (Units) Analysis by Country, 2019 to 2034
Figure 128: Eastern Europe Market Value Share (%) and BPS Analysis by Country, 2024 to 2034
Figure 129: Eastern Europe Market Y-o-Y Growth (%) Projections by Country, 2024 to 2034
Figure 130: Eastern Europe Market Value (US$ Million) Analysis by Product Type, 2019 to 2034
Figure 131: Eastern Europe Market Volume (Units) Analysis by Product Type, 2019 to 2034
Figure 132: Eastern Europe Market Value Share (%) and BPS Analysis by Product Type, 2024 to 2034
Figure 133: Eastern Europe Market Y-o-Y Growth (%) Projections by Product Type, 2024 to 2034
Figure 134: Eastern Europe Market Value (US$ Million) Analysis by Implants, 2019 to 2034
Figure 135: Eastern Europe Market Volume (Units) Analysis by Implants, 2019 to 2034
Figure 136: Eastern Europe Market Value Share (%) and BPS Analysis by Implants, 2024 to 2034
Figure 137: Eastern Europe Market Y-o-Y Growth (%) Projections by Implants, 2024 to 2034
Figure 138: Eastern Europe Market Value (US$ Million) Analysis by Type of Hearing Loss, 2019 to 2034
Figure 139: Eastern Europe Market Volume (Units) Analysis by Type of Hearing Loss, 2019 to 2034
Figure 140: Eastern Europe Market Value Share (%) and BPS Analysis by Type of Hearing Loss, 2024 to 2034
Figure 141: Eastern Europe Market Y-o-Y Growth (%) Projections by Type of Hearing Loss, 2024 to 2034
Figure 142: Eastern Europe Market Value (US$ Million) Analysis by Patient Type, 2019 to 2034
Figure 143: Eastern Europe Market Volume (Units) Analysis by Patient Type, 2019 to 2034
Figure 144: Eastern Europe Market Value Share (%) and BPS Analysis by Patient Type, 2024 to 2034
Figure 145: Eastern Europe Market Y-o-Y Growth (%) Projections by Patient Type, 2024 to 2034
Figure 146: Eastern Europe Market Attractiveness by Product Type, 2024 to 2034
Figure 147: Eastern Europe Market Attractiveness by Implants, 2024 to 2034
Figure 148: Eastern Europe Market Attractiveness by Type of Hearing Loss, 2024 to 2034
Figure 149: Eastern Europe Market Attractiveness by Patient Type, 2024 to 2034
Figure 150: Eastern Europe Market Attractiveness by Country, 2024 to 2034
Figure 151: South Asia and Pacific Market Value (US$ Million) by Product Type, 2024 to 2034
Figure 152: South Asia and Pacific Market Value (US$ Million) by Implants, 2024 to 2034
Figure 153: South Asia and Pacific Market Value (US$ Million) by Type of Hearing Loss, 2024 to 2034
Figure 154: South Asia and Pacific Market Value (US$ Million) by Patient Type, 2024 to 2034
Figure 155: South Asia and Pacific Market Value (US$ Million) by Country, 2024 to 2034
Figure 156: South Asia and Pacific Market Value (US$ Million) Analysis by Country, 2019 to 2034
Figure 157: South Asia and Pacific Market Volume (Units) Analysis by Country, 2019 to 2034
Figure 158: South Asia and Pacific Market Value Share (%) and BPS Analysis by Country, 2024 to 2034
Figure 159: South Asia and Pacific Market Y-o-Y Growth (%) Projections by Country, 2024 to 2034
Figure 160: South Asia and Pacific Market Value (US$ Million) Analysis by Product Type, 2019 to 2034
Figure 161: South Asia and Pacific Market Volume (Units) Analysis by Product Type, 2019 to 2034
Figure 162: South Asia and Pacific Market Value Share (%) and BPS Analysis by Product Type, 2024 to 2034
Figure 163: South Asia and Pacific Market Y-o-Y Growth (%) Projections by Product Type, 2024 to 2034
Figure 164: South Asia and Pacific Market Value (US$ Million) Analysis by Implants, 2019 to 2034
Figure 165: South Asia and Pacific Market Volume (Units) Analysis by Implants, 2019 to 2034
Figure 166: South Asia and Pacific Market Value Share (%) and BPS Analysis by Implants, 2024 to 2034
Figure 167: South Asia and Pacific Market Y-o-Y Growth (%) Projections by Implants, 2024 to 2034
Figure 168: South Asia and Pacific Market Value (US$ Million) Analysis by Type of Hearing Loss, 2019 to 2034
Figure 169: South Asia and Pacific Market Volume (Units) Analysis by Type of Hearing Loss, 2019 to 2034
Figure 170: South Asia and Pacific Market Value Share (%) and BPS Analysis by Type of Hearing Loss, 2024 to 2034
Figure 171: South Asia and Pacific Market Y-o-Y Growth (%) Projections by Type of Hearing Loss, 2024 to 2034
Figure 172: South Asia and Pacific Market Value (US$ Million) Analysis by Patient Type, 2019 to 2034
Figure 173: South Asia and Pacific Market Volume (Units) Analysis by Patient Type, 2019 to 2034
Figure 174: South Asia and Pacific Market Value Share (%) and BPS Analysis by Patient Type, 2024 to 2034
Figure 175: South Asia and Pacific Market Y-o-Y Growth (%) Projections by Patient Type, 2024 to 2034
Figure 176: South Asia and Pacific Market Attractiveness by Product Type, 2024 to 2034
Figure 177: South Asia and Pacific Market Attractiveness by Implants, 2024 to 2034
Figure 178: South Asia and Pacific Market Attractiveness by Type of Hearing Loss, 2024 to 2034
Figure 179: South Asia and Pacific Market Attractiveness by Patient Type, 2024 to 2034
Figure 180: South Asia and Pacific Market Attractiveness by Country, 2024 to 2034
Figure 181: East Asia Market Value (US$ Million) by Product Type, 2024 to 2034
Figure 182: East Asia Market Value (US$ Million) by Implants, 2024 to 2034
Figure 183: East Asia Market Value (US$ Million) by Type of Hearing Loss, 2024 to 2034
Figure 184: East Asia Market Value (US$ Million) by Patient Type, 2024 to 2034
Figure 185: East Asia Market Value (US$ Million) by Country, 2024 to 2034
Figure 186: East Asia Market Value (US$ Million) Analysis by Country, 2019 to 2034
Figure 187: East Asia Market Volume (Units) Analysis by Country, 2019 to 2034
Figure 188: East Asia Market Value Share (%) and BPS Analysis by Country, 2024 to 2034
Figure 189: East Asia Market Y-o-Y Growth (%) Projections by Country, 2024 to 2034
Figure 190: East Asia Market Value (US$ Million) Analysis by Product Type, 2019 to 2034
Figure 191: East Asia Market Volume (Units) Analysis by Product Type, 2019 to 2034
Figure 192: East Asia Market Value Share (%) and BPS Analysis by Product Type, 2024 to 2034
Figure 193: East Asia Market Y-o-Y Growth (%) Projections by Product Type, 2024 to 2034
Figure 194: East Asia Market Value (US$ Million) Analysis by Implants, 2019 to 2034
Figure 195: East Asia Market Volume (Units) Analysis by Implants, 2019 to 2034
Figure 196: East Asia Market Value Share (%) and BPS Analysis by Implants, 2024 to 2034
Figure 197: East Asia Market Y-o-Y Growth (%) Projections by Implants, 2024 to 2034
Figure 198: East Asia Market Value (US$ Million) Analysis by Type of Hearing Loss, 2019 to 2034
Figure 199: East Asia Market Volume (Units) Analysis by Type of Hearing Loss, 2019 to 2034
Figure 200: East Asia Market Value Share (%) and BPS Analysis by Type of Hearing Loss, 2024 to 2034
Figure 201: East Asia Market Y-o-Y Growth (%) Projections by Type of Hearing Loss, 2024 to 2034
Figure 202: East Asia Market Value (US$ Million) Analysis by Patient Type, 2019 to 2034
Figure 203: East Asia Market Volume (Units) Analysis by Patient Type, 2019 to 2034
Figure 204: East Asia Market Value Share (%) and BPS Analysis by Patient Type, 2024 to 2034
Figure 205: East Asia Market Y-o-Y Growth (%) Projections by Patient Type, 2024 to 2034
Figure 206: East Asia Market Attractiveness by Product Type, 2024 to 2034
Figure 207: East Asia Market Attractiveness by Implants, 2024 to 2034
Figure 208: East Asia Market Attractiveness by Type of Hearing Loss, 2024 to 2034
Figure 209: East Asia Market Attractiveness by Patient Type, 2024 to 2034
Figure 210: East Asia Market Attractiveness by Country, 2024 to 2034
Figure 211: Middle East and Africa Market Value (US$ Million) by Product Type, 2024 to 2034
Figure 212: Middle East and Africa Market Value (US$ Million) by Implants, 2024 to 2034
Figure 213: Middle East and Africa Market Value (US$ Million) by Type of Hearing Loss, 2024 to 2034
Figure 214: Middle East and Africa Market Value (US$ Million) by Patient Type, 2024 to 2034
Figure 215: Middle East and Africa Market Value (US$ Million) by Country, 2024 to 2034
Figure 216: Middle East and Africa Market Value (US$ Million) Analysis by Country, 2019 to 2034
Figure 217: Middle East and Africa Market Volume (Units) Analysis by Country, 2019 to 2034
Figure 218: Middle East and Africa Market Value Share (%) and BPS Analysis by Country, 2024 to 2034
Figure 219: Middle East and Africa Market Y-o-Y Growth (%) Projections by Country, 2024 to 2034
Figure 220: Middle East and Africa Market Value (US$ Million) Analysis by Product Type, 2019 to 2034
Figure 221: Middle East and Africa Market Volume (Units) Analysis by Product Type, 2019 to 2034
Figure 222: Middle East and Africa Market Value Share (%) and BPS Analysis by Product Type, 2024 to 2034
Figure 223: Middle East and Africa Market Y-o-Y Growth (%) Projections by Product Type, 2024 to 2034
Figure 224: Middle East and Africa Market Value (US$ Million) Analysis by Implants, 2019 to 2034
Figure 225: Middle East and Africa Market Volume (Units) Analysis by Implants, 2019 to 2034
Figure 226: Middle East and Africa Market Value Share (%) and BPS Analysis by Implants, 2024 to 2034
Figure 227: Middle East and Africa Market Y-o-Y Growth (%) Projections by Implants, 2024 to 2034
Figure 228: Middle East and Africa Market Value (US$ Million) Analysis by Type of Hearing Loss, 2019 to 2034
Figure 229: Middle East and Africa Market Volume (Units) Analysis by Type of Hearing Loss, 2019 to 2034
Figure 230: Middle East and Africa Market Value Share (%) and BPS Analysis by Type of Hearing Loss, 2024 to 2034
Figure 231: Middle East and Africa Market Y-o-Y Growth (%) Projections by Type of Hearing Loss, 2024 to 2034
Figure 232: Middle East and Africa Market Value (US$ Million) Analysis by Patient Type, 2019 to 2034
Figure 233: Middle East and Africa Market Volume (Units) Analysis by Patient Type, 2019 to 2034
Figure 234: Middle East and Africa Market Value Share (%) and BPS Analysis by Patient Type, 2024 to 2034
Figure 235: Middle East and Africa Market Y-o-Y Growth (%) Projections by Patient Type, 2024 to 2034
Figure 236: Middle East and Africa Market Attractiveness by Product Type, 2024 to 2034
Figure 237: Middle East and Africa Market Attractiveness by Implants, 2024 to 2034
Figure 238: Middle East and Africa Market Attractiveness by Type of Hearing Loss, 2024 to 2034
Figure 239: Middle East and Africa Market Attractiveness by Patient Type, 2024 to 2034
Figure 240: Middle East and Africa Market Attractiveness by Country, 2024 to 2034
The global hearing aids market was valued at US$ 8.74 billion in 2024.
By 2034, the global hearing aids market was valued at US$ 10.98 billion.
Demand from India dominates the global hearing aids market with a CAGR of 7.1%.
The market is anticipated to expand at a sluggish CAGR of 2.3% from 2024 to 2034.
ReSound, Widex, Oticon, Siemens AG, and others dominate the global hearing aids market.
Explore Therapeutic Device Insights
Thank you!
You will receive an email from our Business Development Manager. Please be sure to check your SPAM/JUNK folder too.