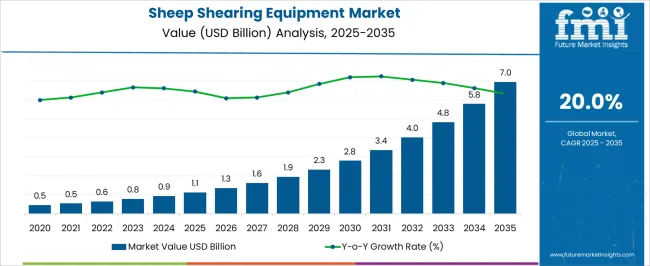
The Sheep Shearing Equipment Market is estimated to be valued at USD 1.1 billion in 2025 and is projected to reach USD 7.0 billion by 2035, registering a compound annual growth rate (CAGR) of 20.0% over the forecast period.
| Metric | Value |
|---|---|
| Sheep Shearing Equipment Market Estimated Value in (2025 E) | USD 1.1 billion |
| Sheep Shearing Equipment Market Forecast Value in (2035 F) | USD 7.0 billion |
| Forecast CAGR (2025 to 2035) | 20.0% |
The Sheep Shearing Equipment market is experiencing notable growth, supported by increasing livestock populations, rising demand for wool, and advancements in agricultural mechanization. The current market scenario reflects a shift from manual to powered shearing tools as sheep farmers prioritize efficiency, safety, and animal welfare. The future outlook remains promising as government programs and farming cooperatives continue to encourage the adoption of modern agricultural tools, particularly in developing economies.
Press releases and investor briefings from agricultural equipment manufacturers have emphasized the role of ergonomic design and energy-efficient motors in expanding usage. Additionally, equipment life cycle improvements and interchangeable components have increased the operational longevity of shearing devices, making them more cost-effective for large-scale usage.
Industry journals and corporate communications also highlight the influence of sustainable farming practices, where precision shearing helps reduce stress on animals and improve fleece quality These factors together are laying the groundwork for consistent demand growth across major sheep-rearing regions.
The market is segmented by Product Type and Material and region. By Product Type, the market is divided into Electric and Hand Sheep Shears. In terms of Material, the market is classified into Stainless Steel, Aluminum, Metal, and Plastic. Regionally, the market is classified into North America, Latin America, Western Europe, Eastern Europe, Balkan & Baltic Countries, Russia & Belarus, Central Asia, East Asia, South Asia & Pacific, and the Middle East & Africa.
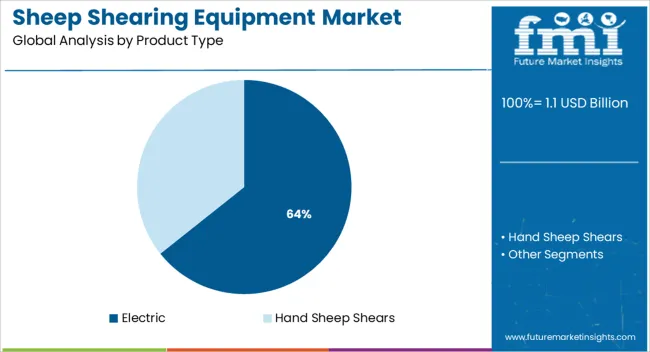
The electric product type segment is projected to account for 64.3% of the Sheep Shearing Equipment market revenue share in 2025, establishing it as the leading segment. This leadership has been influenced by the rising adoption of mechanized shearing solutions that deliver higher productivity and improved animal handling. Electric shearing devices have been favored due to their ability to maintain consistent blade speed and torque, reducing the risk of skin injuries during shearing.
Manufacturer announcements and product launches have demonstrated growing investment in cordless, battery-powered electric models that enhance field mobility and eliminate dependence on fixed power sources. Ease of operation, minimal maintenance, and ergonomic grip design have made these tools suitable for both professional shearers and small-scale farmers.
Additionally, electric equipment supports faster shearing cycles and better fleece quality, which contributes to profitability for commercial wool producers These advantages have positioned the segment as a primary driver of market demand in 2025.
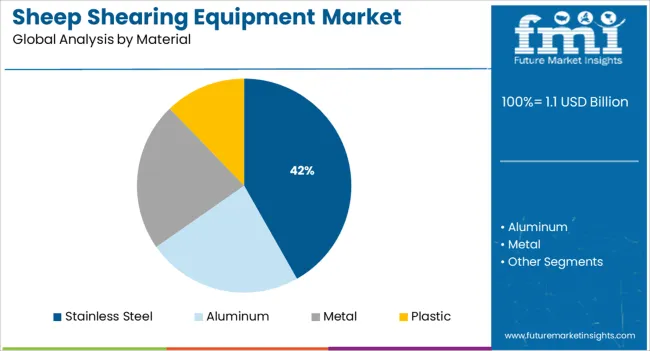
The stainless steel material segment is expected to hold 41.8% of the Sheep Shearing Equipment market revenue share in 2025, making it the leading material segment. The segment’s prominence has been driven by the durability, corrosion resistance, and hygiene benefits offered by stainless steel, as highlighted in technical datasheets and corporate material specifications.
Stainless steel components have been widely utilized in blades and housing parts due to their ability to withstand exposure to wool oils, moisture, and cleaning agents without degrading. As noted in product communications, the long service life and structural integrity of stainless steel contribute to reduced replacement costs and lower equipment downtime.
Its compatibility with high-precision manufacturing has also enabled the development of sharper, longer-lasting cutting surfaces, which are essential in professional shearing environments The growing emphasis on sustainable tools that offer long-term reliability and reduced environmental impact has further reinforced stainless steel’s position as the preferred material choice in the market.
Concerns regarding the mistreatment of sheep during shearing have been highlighted by animal welfare associations, and they have argued against the sale and purchase of wool textiles. There are no official training or licensing standards for sheep shearers. They are compensated by the number of sheep sheared rather than by the hour. It is said that as a result, expediency is valued over accuracy and animal care.
As farmers shifted from raising wool to raising meat and cotton, which offered higher returns, wool both production and consumption throughout have struggled. These events are likely to affect the sheep shearing equipment market negatively.
The demand for equipment used in domesticated animal husbandry is increasing. The primary factor behind this demand is the longing of owners to employ such technologies to boost productivity and raise profits. Certain issues with the manual technique include skin damage, double cutting, and lengthy shearing.
The wool length will be shorter while shearing by hand since the shearer could avoid getting close to the skin. The sheep can get hurt if the shearer accidentally cuts its skin. Due to the shorter shearing time, machine shearing is favored over human shearing.
Sheep shearing equipment manufacturers can benefit from a growing trend away from synthetic, man-made fibers and toward natural fibers like wool. Several businesses are running initiatives to publicize wool as a performance fiber, market their goods, and increase knowledge of the advantages of wool.
Manufacturers are concentrating on reducing their losses via competitive pricing as the demand is anticipated to stay stable. Manufacturers continue to place a high priority on research and development initiatives and advancements in wool manufacturing to lower the current price. Manufacturers are concentrating on boosting their product portfolio and sales of sheep shearing equipment.
| Attributes | Details |
|---|---|
| Sheep Shearing Equipment Market Value (2025) | USD 780 Million |
| Sheep Shearing Equipment Market Expected Value (2035) | USD 1,069 Million |
| Sheep Shearing Equipment Market Projected CAGR (2025 to 2035) | 3.2% |
The sheep shearing equipment market is estimated to flourish at a 3.2% CAGR between 2025 and 2035. Historically, the market value of sheep shearing equipment showed slow progress from 2020 to 2025, recording a CAGR of 2.9%. The wool industry is expanding due to reasons including increased urbanization and a growing population. This has increased the adoption of shearing equipment for sheep.
Several steps have been made by the International Wool Textile Organization (IWTO), a group that controls the quality and traceability of wool. These measures influence to increase in the price of wool and encourage the use of shearing equipment.
Around 0.9 billion kg of pure raw wool are generated by more than 1.2 billion sheep worldwide in 2024, according to the IWTO. The number of sheep in the world reached a record high of 1.266 billion head in 2024, up from 0.9 billion head in 2024.
| Historical CAGR (2020 to 2025) | 2.9% |
|---|---|
| Forecast CAGR (2025 to 2035) | 3.2% |
Short Term (2025 to 2029): Since farmers have realized that shearing sheep does not harm the animals, demand for shearing equipment is anticipated to rise. Shearing sheep is also required to keep them clean and healthy.
Medium Term (2029 to 2035): Wool apparel is more in demand as the population grows. As a result of increased wool output to suit the demand, the market for sheep shearing equipment has grown.
Long Term (2035 to 2035): Wool production process innovation has emerged to reinforce it as a superior option to other current fabrics. Opportunities are likely to open up for the sheep shearing equipment industry owing to the technological advancements that enable efficient production.
On the back of these aspects, the sheep shearing equipment market is expected to develop 1.3X between 2025 and 2035. As per the analysts, a valuation of USD 1,069 Million by 2035 end is projected for the market.
| Year | Valuation |
|---|---|
| 2020 | USD 638 Million |
| 2024 | USD 734.8 Million |
| 2025 | USD 755.8 Million |
| 2025 | USD 780 Million |
| 2035 | USD 1,069 Million |
Expanding wool production and manufacturing were encouraged by the American Revolution. The nature of the wool business significantly altered between the Revolution and the Civil War. The wool and sheep sectors in the US have seen a major development in recent decades. Sheep operations are significant to the economy of the US, even though they generate less than 1% of the livestock industry's sales in the country.
| Country | United States |
|---|---|
| Market Share (2025) | 30.5% |
| Market Value (2025) | USD 230.6 Million |
Wool production is nothing new for the USA the nation shears hundreds of thousands of sheep and lambs each year, and specialty types have seen an especial appeal. The market is recovering despite a little decrease brought on by issues in the American sheep industry.
Currently, the third-largest producer of wool worldwide is the United States. The state that produces the most wool in the USA is Texas. Sales of high-capacity agricultural machinery and equipment are being driven by more farm consolidation, a strong economic outlook, a broad production base, and increased government assistance through subsidies. Therefore, the USA sheep shearing equipment market provides a lot of opportunities for business growth for manufacturers and suppliers.
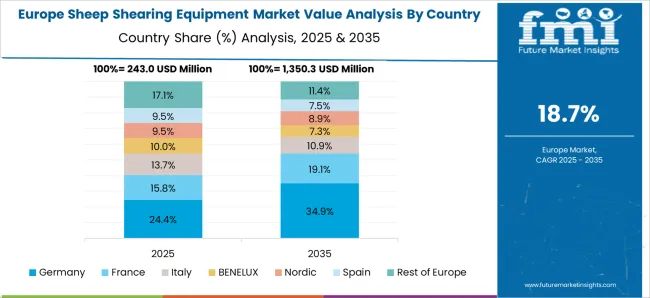
European farmers have always demonstrated a willingness to adopt new methods and techniques. The European Agricultural Machinery Association (CEMA) is the trade association for a sector with 7,000 businesses, ranging from countless SMEs to multinationals. They manufacture 450 different types of machinery. This farm machinery includes livestock equipment and covers all aspects of fieldwork, including planting, weeding, and harvesting. It gives clients the ability to get the most out of their land while also preserving the environment and generating income.
| Country | Germany |
|---|---|
| Market Share (2025) | 16.1% |
| Market Value (2025) | USD 121.5 Million |
Owing to the substantial turnover of this sector in Germany, the nation is one of the biggest marketplaces in Europe for agricultural equipment and tools. The nation is among the top exporters of agricultural equipment worldwide, as well as the top producer and second-largest user of agricultural machinery in Europe. One of the most popular locations in Europe for FDIs in agricultural machinery in Germany. Hence, the German sheep shearing equipment market is likely to be driven by these elements.
In the domain of engineering, Germany is renowned for its technological superiority. To operate the most cutting-edge agricultural equipment, the nation has a sizable pool of skilled workers. In addition, German farmers get yearly funds from the European Union for their investments in agricultural methods, allowing them to buy high-end machinery. All these elements are probably going to help the German sheep shearing equipment market growth.
| Country | United Kingdom |
|---|---|
| CAGR (2025 to 2035) | 3.4% |
| Market Share (2025) | 9.4% |
| Market Value (2025) | USd 70.9 Million |
| Market Value (2035) | USD 99.4 Million |
The market for farming equipment is expanding in the UK due to many factors, such as supportive government policies. Additionally, modern agricultural technology is improving farming practices and reducing prices. The UK sheep shearing equipment market is therefore anticipated to grow throughout the forecast period.
The need for woolen clothing is also being driven by the growing population in the UK, which is likewise pushing up demand for sheep shearing equipment. Additionally, businesses are introducing cutting-edge goods and fresh technology to the marketplace. As a result, the market is likely to rise over the projected period due to the industry's increased innovation.
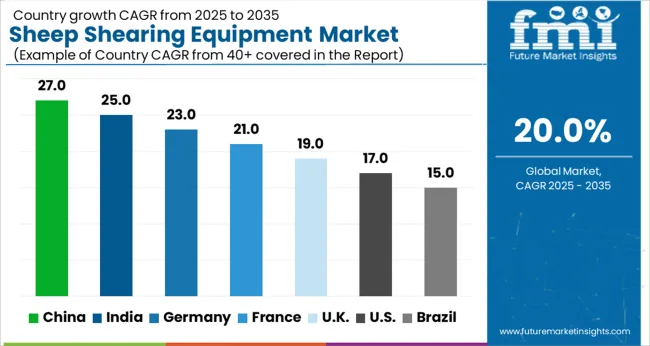
It is anticipated that throughout the projected period, the East Asia and South Asia markets would account for a sizeable portion of the sheep shearing equipment market. Improved economic growth in important nations like China, India, and others has benefited the global market. Other factors driving the growth of the wool market in the Asia-Pacific region are rising urbanization, an increase in the number of middle-class people, and rising sustainability.
China is one of the world's major producers of agricultural machinery and the largest market for it. The Chinese sheep shearing equipment market is predicted to grow significantly during the forecast period, supported by rising government spending on advancing the country's agricultural industry. Besides, decent rebates and incentives launched by the Chinese government to facilitate the purchase of farm equipment are likel to open up growth opportunities.
| Country | China |
|---|---|
| CAGR (2025 to 2035) | 2.6% |
| Market Share (2025) | 9.4% |
| Market Value (2025) | USD 70.95 Million |
| Market Value (2035) | USD 91.4 Million |
People are increasingly using things that were once thought to be prohibitively expensive as a result of expanding economic prosperity and rising disposable income. In turn, this has led to an increase in demand for consumer goods like clothing and accessories. It is anticipated that the demand for wool would be driven by the consistent expansion of end-user industries in China. This is anticipated to create business opportunities for market players.
Given India's expanding population, heavy reliance on agriculture as an economic powerhouse, and shifting demographics, the country has enormous development potential in the agricultural machinery industry. India has continued to be one of the key countries in Asia-Pacific, which has fueled the expansion of its agricultural equipment market due to the nation's high degree of reliance on agriculture and a growing propensity toward adopting technology. Favorable government policies, growing farm revenues, and the significance of automation for productivity in India are some of the key factors driving the Indian sheep shearing equipment market.
| Country | India |
|---|---|
| CAGR (2025 to 2035) | 3.8% |
| Market Share (2025) | 4.2% |
| Market Value (2025) | USD 31.6 Million |
| Market Value (2035) | USD 45.7 Million |
Additionally, India's wool industry is export-focused. As a result, the nation produces a lot of wool, which calls for the deployment of sheep shearing equipment. The Ministry of Textiles created an Integrated Wool Development Program to grow India's wool industry (IWDP). This program intends to connect the wool industry and producers, coordinate the supply chain for wool, and give the smaller Indian makers of woolen goods a marketing platform. The Ministry of Textiles hopes that this program will increase the testing of wool, enhance the production equipment available, and give hand-made producers the ability to grow their skills and expand their manufacturing capacities.
The GDP of the nation only has a 1.4% contribution from the agricultural sector. Japan is a highly industrialized nation, and its industry for agricultural equipment is also fairly advanced. However, a spike in the Japanese agriculture equipment market is anticipated over the projection period to effectively use the limited arable land. Therefore, livestock farming has gained traction recently. Moreover, Japan exported USD 26,8k worth of wool in 2024, ranking 78th among all exporters of the material. In the same year, wool was Japan's 1179th-most-exported good. Therefore, Japanese sheep shearing equipment has decent opportunities for market players.
The global sheep shearing equipment market is segmented based on product type, material, and region.
Electric sheep shearing equipment is mostly preferred by shearers as it offers several advantages such as:
Manufacturers provide updated shearing equipment with a vertical push mechanism and individual electric shearing units with better converters. Given the upgraded converter and shearing machine operating components, this assembly equipment enhances the efficiency of shearing sheep. Some of the sheep shearing equipment even comprise a frequency converter that has an energy-saving feature to lower energy losses. Hence, electric sheep shearing machines are becoming increasingly prevalent among shearers as a result of the aforementioned considerations and manufacturer development.
Shearers prefer stainless steel shearing equipment over equipment made of aluminum, metal, and plastic. Reasons behind this preference include:
Manufacturers offer electric and portable sheep shearing equipment that is constructed of stainless steel and have a long lifespan. Preference for stainless steel shearing equipment is growing since it can be used for Alpacas, llamas, and other big animals with thick coats.
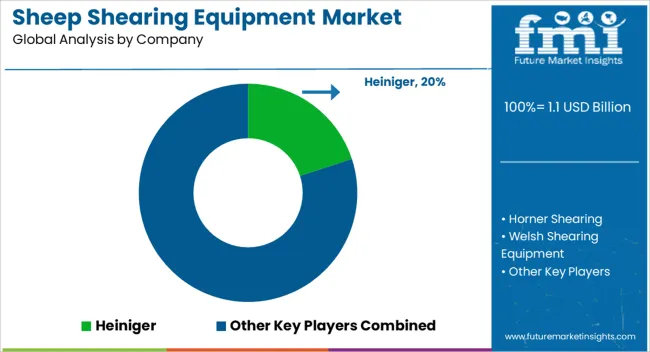
Manufacturers in the sheep shearing equipment industry strive to improve the current products they offer in addition to developing new sheep shearing devices. They are also building meaningful relationships with other firms operating in the same industries. They are building partnerships not just with other businesses, but also with farms, particularly those that need a lot of shearing equipment to increase their entry into successful ventures.
Horner Shearing
Since its founding in 1980, Horner Shearing, which specializes in the shearing of sheep, has grown to become one of the most reputable sellers of animal clipping equipment worldwide. Since then, the business has also been producing its own line of Longhorn® goods.
Welsh Shearing Equipment
For ten years, Welsh Shearing Equipment Limited has been in operation. The whole wool business was revolutionized by Frederick Wolseley's improvements to sheep shearing equipment.
Lister Shearing Equipment Limited
Gloucestershire is the home of the active business Lister Shearing Equipment Limited. It works in the industry that produces agricultural and forestry machinery other than tractors. The business is a leader in the provision of horse clippers, professional sheep shearing equipment, and grooming tools for a variety of animals.
National Meditek has received ISO 9001-2020 certification. It manufactures, produces, imports, and supplies a range of veterinary and surgical supplies, identification tags, cattle breeding equipment, and artificial insemination equipment. The company, which has been in business since 1983, has constantly provided and delivered high-quality products to various stakeholders.
Albert Kerbl GmbH
Albert Kerbl GmbH works in the agriculture sector. The firm sells agricultural products, safety gear, lubricants, disposable safety gear, clippers, and fences.
In November 2024, the clipping machine business is transferred from Aesculap Suhl GmbH to Albert Kerbl GmbH. Aesculap Suhl GmbH will be replaced in the "clippers and hair-cutting machines for small and big animals" market by Aesculap Schermaschinen GmbH, a newly recognized part of Albert Kerbl GmbH.
Other companies operating in the sheep shearing equipment market are:
The global sheep shearing equipment market is estimated to be valued at USD 1.1 billion in 2025.
The market size for the sheep shearing equipment market is projected to reach USD 7.0 billion by 2035.
The sheep shearing equipment market is expected to grow at a 20.0% CAGR between 2025 and 2035.
The key product types in sheep shearing equipment market are electric and hand sheep shears.
In terms of material, stainless steel segment to command 41.8% share in the sheep shearing equipment market in 2025.


Full Research Suite comprises of:
Market outlook & trends analysis
Interviews & case studies
Strategic recommendations
Vendor profiles & capabilities analysis
5-year forecasts
8 regions and 60+ country-level data splits
Market segment data splits
12 months of continuous data updates
DELIVERED AS:
PDF EXCEL ONLINE
Sheep Tilt Table Market Size and Share Forecast Outlook 2025 to 2035
Sheep Supplies Market Analysis by Supply, Farm, Sales and Region: A Forecast for 2025 and 2035
Sheep Creep Feeder Market – Innovations & Market Outlook 2025-2035
Sheep and Goat Equipment Market Size and Share Forecast Outlook 2025 to 2035
Sheep Handling Equipment Market Size and Share Forecast Outlook 2025 to 2035
Cattle and Sheep Disease Diagnostic Kits Market Size and Share Forecast Outlook 2025 to 2035
Equipment Management Software Market Size and Share Forecast Outlook 2025 to 2035
Equipment cases market Size and Share Forecast Outlook 2025 to 2035
Farm Equipment Market Forecast and Outlook 2025 to 2035
Golf Equipment Market Size and Share Forecast Outlook 2025 to 2035
Port Equipment Market Size and Share Forecast Outlook 2025 to 2035
Pouch Equipment Market Growth – Demand, Trends & Outlook 2025 to 2035
Garage Equipment Market Forecast and Outlook 2025 to 2035
Mining Equipment Industry Analysis in Latin America Size and Share Forecast Outlook 2025 to 2035
Subsea Equipment Market Size and Share Forecast Outlook 2025 to 2035
Pavers Equipment Market Size and Share Forecast Outlook 2025 to 2035
Tennis Equipment Market Analysis - Size, Share, and Forecast Outlook 2025 to 2035
Galley Equipment Market Analysis and Forecast by Fit, Application, and Region through 2035
Sorting Equipment Market Size and Share Forecast Outlook 2025 to 2035
General Equipment Rental Services Market Size and Share Forecast Outlook 2025 to 2035

Thank you!
You will receive an email from our Business Development Manager. Please be sure to check your SPAM/JUNK folder too.
Chat With
MaRIA