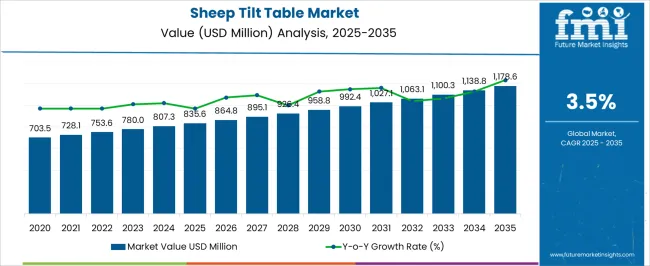
The sheep tilt table market is estimated to be valued at USD 835.6 million in 2025 and is projected to reach USD 1178.6 million by 2035, registering a compound annual growth rate (CAGR) of 3.5% over the forecast period.
The market demonstrates steady growth driven by advancing veterinary care standards and increasing commercial sheep farming operations that require specialized equipment for animal handling, medical procedures, and routine health management. Modern agricultural facilities implement mechanized handling systems that reduce labor requirements while improving animal welfare conditions during veterinary examinations, hoof trimming procedures, and breeding management activities. The equipment's ability to safely restrain sheep in various positions enables veterinarians to perform complex procedures that were previously difficult or dangerous to execute in field conditions.
Commercial sheep operations benefit from tilt table systems that streamline routine maintenance activities including vaccination programs, parasite treatment administration, and pregnancy examinations that require precise animal positioning for effective intervention. Ranch managers report significant labor cost reductions when implementing hydraulic tilt tables compared to traditional manual restraint methods that require multiple workers and create stress conditions for both animals and handlers. The equipment's adjustable positioning capabilities accommodate different sheep breeds and sizes while maintaining consistent access for veterinary procedures across diverse flock compositions.
Veterinary clinic markets experience growing demand for specialized sheep handling equipment as small ruminant practice volumes increase in regions with expanding sheep farming activities. Mobile veterinary services invest in portable tilt table systems that enable field-based procedures without requiring animal transportation to fixed clinic facilities. Equipment manufacturers develop modular designs that accommodate trailer mounting and rapid setup configurations for veterinarians serving dispersed agricultural operations. Clinical efficiency improvements justify equipment investments as practitioners reduce procedure times while improving treatment outcomes through proper animal restraint and positioning.
Equipment design considerations address animal welfare requirements that have become increasingly important in commercial livestock management. Manufacturers implement non-slip surface materials, padded restraint systems, and stress-reducing features that minimize animal anxiety during handling procedures. Regulatory compliance drives adoption of equipment that meets animal welfare standards established by agricultural oversight agencies and organic certification programs. Documentation requirements for livestock treatment records create demand for tilt tables equipped with integrated weighing systems and procedure logging capabilities.
Distribution networks emphasize dealer relationships with agricultural equipment suppliers who provide installation, training, and maintenance support for sheep farming operations. Technical service capabilities become increasingly important as farmers transition from traditional handling methods to mechanized systems that require operator training and periodic maintenance. Regional dealers maintain parts inventory and service capabilities that minimize equipment downtime during critical periods such as breeding season and vaccination schedules when equipment availability directly impacts farm productivity and animal health outcomes.
| Metric | Value |
|---|---|
| Sheep Tilt Table Market Estimated Value in (2025 E) | USD 835.6 million |
| Sheep Tilt Table Market Forecast Value in (2035 F) | USD 1178.6 million |
| Forecast CAGR (2025 to 2035) | 3.5% |
The sheep tilt table market is experiencing steady demand growth driven by the increasing emphasis on livestock welfare, efficiency in veterinary practices, and the rising adoption of mechanized handling equipment in modern farming. Farmers and livestock managers are prioritizing animal-friendly solutions that reduce stress during health inspections, hoof trimming, and other routine procedures.
The market is also being shaped by technological enhancements in table design, such as improved durability, hydraulic systems, and portability features that enable efficient handling in diverse farm environments. Growing herd sizes, regulatory focus on animal welfare, and the drive for operational productivity are further boosting adoption.
With expanding livestock farming practices globally and rising awareness regarding safe handling techniques, the future outlook of this market remains positive, presenting opportunities for innovation and wider adoption across different scales of farming operations.
The market is segmented by Application and Sales Channel and region. By Application, the market is divided into Livestock Industry, Private Farm, and Others. In terms of Sales Channel, the market is classified into Direct Sales and Retail Sales. Regionally, the market is classified into North America, Latin America, Western Europe, Eastern Europe, Balkan & Baltic Countries, Russia & Belarus, Central Asia, East Asia, South Asia & Pacific, and the Middle East & Africa.
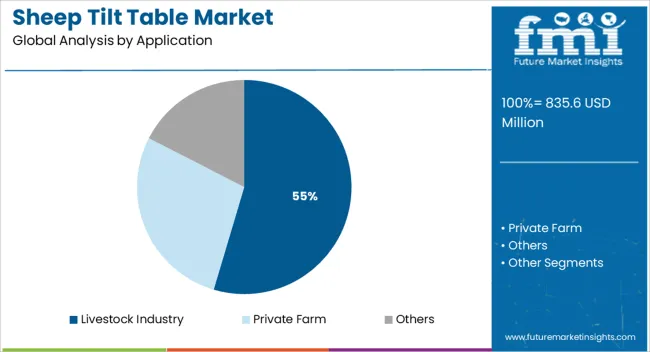
The livestock industry application segment is projected to hold 54.60% of total revenue by 2025, making it the leading application area. This dominance is driven by the rising focus on improving livestock health management and reducing manual labor in animal handling.
Increased herd sizes and higher demand for productivity optimization in farms have created a strong requirement for efficient equipment. By minimizing animal stress and injury, sheep tilt tables are being recognized as critical tools in enhancing animal welfare while streamlining farm operations.
Their adoption has also been influenced by heightened awareness of veterinary best practices and the importance of preventive care in the livestock sector. As a result, the livestock industry segment has emerged as the key driver of market growth.
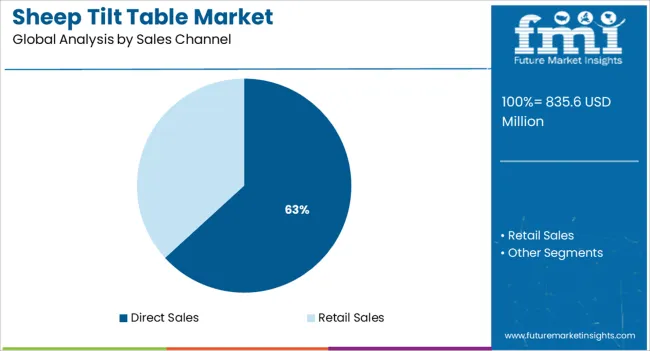
The direct sales channel segment is anticipated to account for 63.20% of total revenue by 2025, making it the most dominant distribution channel. This share is attributed to the trust and reliability that farmers and livestock operators place on direct engagement with manufacturers and specialized suppliers.
Direct sales allow for customized solutions, product demonstrations, and after-sales service, all of which are essential for equipment such as tilt tables. Furthermore, the direct sales approach ensures faster delivery timelines and better technical guidance, which enhances buyer confidence.
With the livestock industry requiring durable and reliable handling equipment, direct sales have continued to dominate due to their ability to foster stronger relationships and provide value-added support, thereby maintaining their leadership in the sales channel category.
The use of automation and robotics in manufacturing is expected to increase efficiency and reduce labor costs, making sheep tilt tables more cost-effective for farmers and ranchers. Here are some innovative manufacturing trends in the sheep tilt tables industry.
3D printing: 3D printing technology is being used to create customized sheep tilt tables that can be tailored to the specific needs of individual farmers and ranchers.
Internet of Things (IoT) and sensor technology: The integration of IoT and sensor technology in sheep tilt tables will enable farmers and ranchers to monitor and track the health and well-being of their sheep in real time.
Big data and analytics: The use of big data and analytics in the manufacture of sheep tilt tables is likely to enable farmers and ranchers to make more informed decisions about their sheep and improve the overall efficiency of their operations.
Smart materials: Manufacturers are likely to utilize smart materials in the manufacture of sheep tilt tables that can adapt to the animal's weight, size, and movements, making the tables more comfortable and safer for sheep.
An increase in government funding for sheep farm efficiency programs and expansions is likely to create further market opportunities for sheep tilt table manufacturers.
Farm owners are becoming increasingly aware of technological advancements in the livestock handling industry, and this is expected to drive the adoption of sheep tilt tables in the market. The adoption of technology in the livestock handling system is also anticipated to create new business opportunities for manufacturers of sheep tilt tables.
Market participants have recognized this trend and are capitalizing on it by providing sheep tilt tables enhanced with a variety of applications for managing sheep. The application of programmed machinery is widely used in the sheep farming business in economies dependent on agriculture. This factor is expected to be essential to the market's expansion in the forecast period.
| Report Attributes | Details |
|---|---|
| Sheep Tilt Table Market Value (2025) | USD 780 million |
| Sheep Tilt Table Market CAGR (2025 to 2035) | 3.5% |
| Anticipated Sheep Tilt Table Market Value (2035) | USD 1,100 million |
According to Future Market Insights, the sheep tilt table industry rose at a CAGR of 6% from USD 703.5 million in 2020 to USD 835.6 million in 2025.
The sheep tilt table market has seen significant growth from 2020 to 2025, driven by several factors. The increasing number of sheep farms around the world has led to a corresponding increase in demand for sheep tilt tables. In addition, government funding and subsidies have been provided to farmers and ranchers to encourage the adoption of advanced technology and automation in sheep farming, which has further increased the number of sheep tilt tables being used on farms.
| Attribute | Valuation |
|---|---|
| 2025 | USD 835.56 million |
| 2035 | USD 926.4 million |
| 2035 | USD 1063.06 million |
The market is anticipated to grow at a CAGR of 3.5% from 2025 to 2035, surpassing USD 1,100 million by 2035.
Short Term (2025 to 2025): The sheep tilt table market is likely to experience significant growth during this period, driven by the increasing adoption of advanced technology and automation in sheep farming. As farmers and ranchers become more aware of the benefits of sheep tilt tables, they are expected to demand more customized and advanced products, which is likely to drive the growth of the market.
Medium Term (2025 to 2035): The increasing demand for automated production line operations among manufacturers in the sheep farming industry is likely to boost sales of sheep tilt tables, and in turn, drive market growth. The integration of IoT and sensor technology in sheep tilt tables are likely to enable farmers and ranchers to monitor and track the health and well-being of their sheep in real-time, which is likely to further drive the adoption of these products.
Long Term (2035 to 2035): The use of advanced technologies in the manufacturing of sheep tilt tables is likely to support market growth. As the global sheep population is expected to increase, manual herd management is likely to become more difficult, leading to a growing demand for sheep tilt tables to assist with routine feeding and herd management. In addition, the trend of precision agriculture in sheep farming is likely to increase the demand for sheep tilt tables that can be integrated with other advanced technologies such as data analysis and automation.
With an anticipated CAGR of 8% throughout the forecast period, the livestock industry category is expected to lead the market.
The livestock industry segment is leading the sheep tilt table industry with a share of 45% in 2025. This segment includes large-scale commercial sheep farms, feedlots, and ranches, which require a high number of sheep tilt tables to handle a large number of sheep. These commercial operations often have a significant budget for livestock management equipment and are more likely to invest in advanced technology and automation. This segment is expected to drive market growth due to the increasing number of commercial sheep operations around the world and the increasing demand for automation and advanced technology in sheep farming.
The direct sales segment is anticipated to lead the market with a CAGR of 5% during the forecast period. This segment includes sales made directly from manufacturers to customers, which allows manufacturers to provide a more personalized and tailored service to customers, and also allows for more efficient and cost-effective sales. The direct sales segment is expected to drive the market growth due to the increasing demand for customized and advanced sheep tilt tables, as farmers and ranchers become more aware of the benefits of sheep tilt tables for the health and well-being of their sheep.
| Country | The United States of America |
|---|---|
| Share (2025 to 2035) | 29.7% |
| Market Value by 2035 (in US million) | 1178.6 |
| Country | Germany |
|---|---|
| Share (2025 to 2035) | 15.7% |
| Market Value by 2035 (in US million) | 118.3 |
| Country | United Kingdom |
|---|---|
| Share (2025 to 2035) | 9.7% |
| Market Value by 2035 (in US million) | 105.6 |
| Country | Japan |
|---|---|
| Share (2025 to 2035) | 4.8% |
| Market Value by 2035 (in US million) | 35.8 |
| Country | China |
|---|---|
| Share (2025 to 2035) | 8.3% |
| Market Value by 2035 (in US million) | 82.1 |
The USA sheep tilt table market is anticipated to surpass USD 1178.6 million by 2035, rising at a CAGR of 9% during the forecast period.
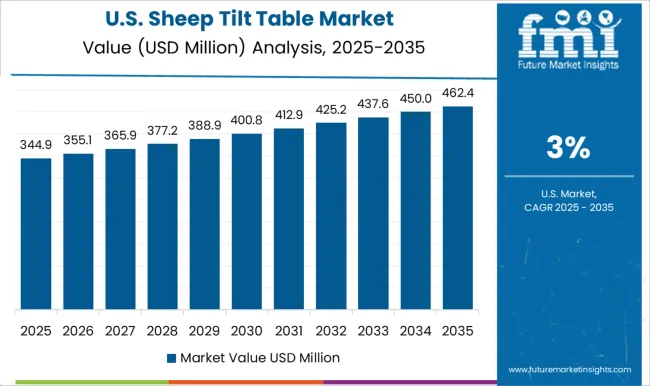
The growth of the sheep tilt table industry in the USA is driven by several factors including increasing demand for meat, growing consumer awareness about animal welfare, and government regulations promoting the use of humane methods for handling livestock. In addition, the use of tilt tables for sheep handling in the USA is becoming more popular as farmers and ranchers look for ways to improve efficiency and reduce labor costs. The USA is also home to a large number of sheep producers and processors, which further drives the growth of the industry in the region.
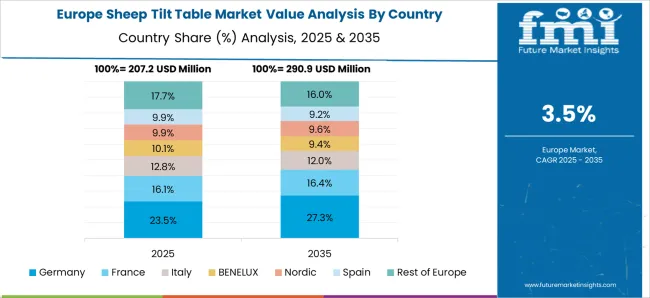
Germany is currently leading the sheep tilt table market in Europe, holding a projected 15.7% share of the global sheep tilt table industry. The German sheep tilt table industry is expected to be worth USD 118.3 million by 2035, with a projected CAGR of 5% during the forecast period. One major factor is the country's strong economy and well-established manufacturing industry. The German manufacturing sector is known for its high efficiency, precision, and quality standards, which allow German manufacturers to produce high-quality sheep tilt tables at competitive prices. In addition, German manufacturers have a strong reputation for innovation and technology, which helps them to maintain a competitive edge in the sheep tilt table market.
Another factor that contributes to Germany's dominance in the sheep tilt table market is the country's large and well-established agricultural industry. The German agricultural industry is one of the most advanced and productive in the world, and the country is known for its high-quality livestock and animal husbandry practices. This has led to a high demand for sheep tilt tables in the country, which has in turn helped to drive the growth of the German sheep tilt table industry.
In contrast, the United Kingdom sheep tilt table industry is estimated to be worth USD 105.6 million by 2035, garnering a CAGR of 3.8% during the forecast period. This growth can be attributed to the increasing focus on technological innovation in sheep tilt table equipment by key industry players in the United Kingdom. These companies are investing in the development of advanced sheep tilt tables to deliver precise amounts of feed at regular intervals, thus improving the nutritional management of animal husbandry in the region.
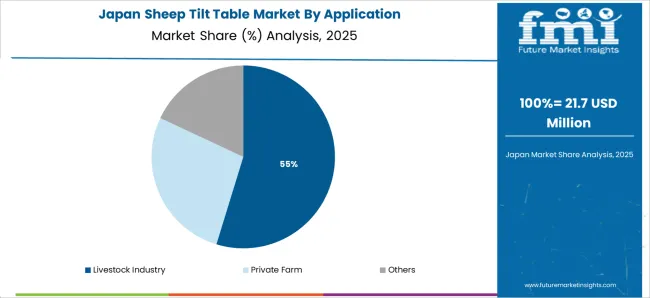
Japan's sheep tilt table industry is to reach USD 35.8 million by 2035, expanding at a steady CAGR of 4.8% over the projected period. This steady growth can be attributed to a few factors such as the increasing demand for sheep products in the country, particularly in the food industry as the population continues to grow, the demand for sheep products is also expected to increase. In addition, the adoption of advanced technology in sheep tilt tables has been a driving factor for the growth of this industry.
China accounts for an 8.3% share of the sheep tilt table industry, recording a CAGR of 2.8% during the forecast period. Due to the significant consumption of sheep meat in the region, China's sheep tilt table industry is anticipated to surpass USD 82.1 million by 2035.
China is a major consumer of sheep meat, which is one of the main factors driving the growth of the sheep tilt table industry in the region. The increasing demand for sheep meat has led to the adoption of more efficient and effective methods of raising sheep, such as the use of sheep tilt tables. Similarly, the Chinese government's focus on animal welfare is also contributing to the growth of the sheep tilt table industry, as these devices can improve the overall health and well-being of sheep.
As the sheep tilt table industry continues to grow, manufacturers are implementing various strategies to gain a competitive edge in the market. These strategies include investing in research and development to improve the technology of sheep tilt tables, expanding their product offerings to cater to a wider range of customers, and increasing their marketing efforts to raise brand awareness.
Similarly, manufacturers are also focusing on building relationships with key industry players and forming strategic partnerships to expand their reach and increase their market share. To stay ahead of the competition, manufacturers are also exploring new markets and regions to expand their business. These growth strategies are expected to drive the growth of the sheep tilt table industry in the coming years.
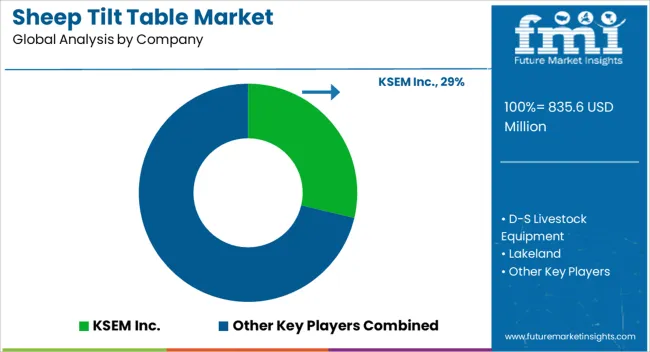
The sheep tilt table market is supported by specialized agricultural equipment manufacturers focused on animal handling efficiency, safety, and durability. KSEM Inc., D-S Livestock Equipment, and Lakeland Farm and Ranch Direct lead the market with advanced sheep tilt tables designed for hoof trimming, medical inspection, and shearing applications. These companies emphasize robust steel construction, ergonomic designs, and adjustable configurations that enhance animal welfare and operator convenience.
Three Willows Ranch and Stegall Fabrication cater to small and mid-sized farms with custom-built tilt tables offering portability, ease of operation, and compatibility with various livestock handling systems. Sydell Sheep and Goat Equipment provides a wide range of livestock handling equipment, including hydraulic and manual tilt tables designed for professional livestock operations. Filson Livestock Equipment focuses on heavy-duty, powder-coated models suited for long-term durability and demanding farm conditions.
Shaul’s Manufacturing and Mountainview Machine supply cost-effective and reliable equipment for small-scale producers, prioritizing ease of maintenance and adaptability to different flock sizes. Marweld Industries offers precision-engineered tilt tables with integrated restraint systems for improved safety and efficiency during animal treatment.
The global sheep tilt table market is estimated to be valued at USD 835.6 million in 2025.
The market size for the sheep tilt table market is projected to reach USD 1,178.6 million by 2035.
The sheep tilt table market is expected to grow at a 3.5% CAGR between 2025 and 2035.
The key product types in sheep tilt table market are livestock industry, private farm and others.
In terms of sales channel, direct sales segment to command 63.2% share in the sheep tilt table market in 2025.


Full Research Suite comprises of:
Market outlook & trends analysis
Interviews & case studies
Strategic recommendations
Vendor profiles & capabilities analysis
5-year forecasts
8 regions and 60+ country-level data splits
Market segment data splits
12 months of continuous data updates
DELIVERED AS:
PDF EXCEL ONLINE
Sheep and Goat Equipment Market Size and Share Forecast Outlook 2025 to 2035
Sheep Shearing Equipment Market Size and Share Forecast Outlook 2025 to 2035
Sheep Handling Equipment Market Size and Share Forecast Outlook 2025 to 2035
Sheep Supplies Market Analysis by Supply, Farm, Sales and Region: A Forecast for 2025 and 2035
Sheep Creep Feeder Market – Innovations & Market Outlook 2025-2035
Cattle and Sheep Disease Diagnostic Kits Market Size and Share Forecast Outlook 2025 to 2035
Tilt Skillets Market Size and Share Forecast Outlook 2025 to 2035
Tilt tray sorter Market
Hydraulic Cab Tilt System Market
Tableware Market Size and Share Forecast Outlook 2025 to 2035
Tablet Hardness Testers Market Size and Share Forecast Outlook 2025 to 2035
Table Tents Market Size and Share Forecast Outlook 2025 to 2035
Tabletop CNC Milling Machines Market Analysis - Size, Share, and Forecast Outlook 2025 to 2035
Table and Kitchen Linen Market Size and Share Forecast Outlook 2025 to 2035
Tablet Packing Machine Market Size and Share Forecast Outlook 2025 to 2035
Tablets for Oral Suspension Market Analysis Size and Share Forecast Outlook 2025 to 2035
Tablet Press Machines Market Size and Share Forecast Outlook 2025 to 2035
Tablet Based E-Detailing Market Size and Share Forecast Outlook 2025 to 2035
Tablet And e-Reader Application Processor Market Size and Share Forecast Outlook 2025 to 2035
Tabletop Pizza Oven Market Size and Share Forecast Outlook 2025 to 2035

Thank you!
You will receive an email from our Business Development Manager. Please be sure to check your SPAM/JUNK folder too.
Chat With
MaRIA