Reports

- Global Locations -

Headquarters

Future Market Insights, Inc.

Christiana Corporate, 200
Continental Drive, Suite 401,
Newark, Delaware - 19713,
United States

T: +1-845-579-5705

Americas

Future Market Insights, Inc.

616 Corporate Way, Suite 2-9018,
Valley Cottage, NY 10989, United States

T: +1-347-918-3531

MEA

Future Market Insights

1602-6 Jumeirah Bay X2 Tower, Plot No: JLT-PH2-X2A,
Jumeirah Lakes Towers, Dubai,
United Arab Emirates

Europe

Future Market Insights

3rd Floor, 207 Regent Street,
W1B 3HH London
United Kingdom

T: + 44 (0) 20 8123 9659
D: +44 (0) 20 3287 4268

Asia Pacific

Future Market Insights

IndiaLand Global Tech Park, Unit UG-1, Behind Grand HighStreet, Phase 1, Hinjawadi, MH, Pune – 411057, India

Sheep Handling Equipment Market Outlook (2023 to 2033)

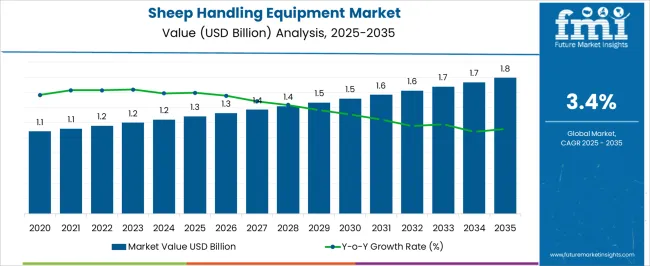
The sheep handling equipment market has a worth of USD 1,220 million in 2023 and is projected to reach USD 1,705 million by 2033, with a CAGR of 3.4% during the forecast period.

Expansion is attributed to the growing demand for efficient, comfortable, and safe handling of sheep. The rising demand for milk and meat products, and awareness about animal welfare, are the key growth factors of the sheep-handling equipment market.

Moreover, the rising number of small-scale and medium-scale sheep farms across the world is expected to fuel the demand for sheep-handling equipment.

  • Due to the rising need for sheep-handling equipment for small enterprises, the market for small-scale industries has experienced a substantial expansion in recent years. The demand for more effective and efficient sheep handling techniques, and the growing number of small-scale sheep producers, are the main drivers of this rise.
  • Specialized sheep handling equipment for small farms and shepherds is offered by the small-scale industry and includes a variety of goods.
  • The sales of sheep handling equipment are anticipated to rise as a result of rising grass-fed and organic product demand, as well as an increase in sheep farms. The need for this equipment is rising due to growing animal welfare awareness and the necessity for productive farm machinery that requires less work.
  • In order to help farmers buy sheep-handling equipment, governments in different nations are also offering assistance and subsidies.
Attributes Details
Sheep Handling Equipment Market CAGR (2023 to 2033) 3.4%
Sheep Handling Equipment Market Size (2023) US$ 1,220 million
Sheep Handling Equipment Market Size (2033) US$ 1,705 million

Don't pay for what you don't need

Customize your report by selecting specific countries or regions and save 30%!

Sheep Handling Equipment Market Historical Scenario and Current Statistics

When compared to the 3.0% CAGR recorded between 2016 and 2022, the sheep-handling equipment business is predicted to expand at a 3.4% CAGR between 2023 and 2033. The average growth of the market is expected to be approx 44% between 2022 and 2033.

Market Statistics Details
Market Share (2016) US$ 985.8 million
Market Share (2021) US$ 1,145.3 million
Market Share (2022) US$ 1,180.1 million

Short-term Growth (2023 to 2026): it's becoming more and more common to handle sheep using low-stress animal handling methods, leading towards potential growth.

Medium-term Growth (2027 to 2029): market expansion is accelerated by an increase in the use of breeding and milking equipment to increase total yield and management techniques.

Long-term Growth (2030 to 2033): An essential commercial development has been the creation of portable sheep-handling equipment. Farmers may now transport sheep without having to move them physically due to new technology.

In order to facilitate farming operations, new farm gear and equipment use technologies like Global Positioning Systems (GPS), measuring sensors, and digital monitoring systems. They are also able to provide an output that is more productive and sustainable due to data collected from the field.

Many recent advancements in the sheep-handling equipment industry aim to minimize human contact while boosting farm production.

Fresh Opportunities in the Sheep Handling Equipment Market

It is projected that the adoption of cutting-edge technology, such as robots and automated systems in sheep handling equipment, presents significant opportunities for market expansion. The adoption of sheep-handling equipment is growing by the continued demand for innovative technologies in the agriculture sector to improve operational efficiency.

More and more automated technology is being used to manage the sheep and perform numerous activities, such as feeding, milking, monitoring, and cleaning. The need for organically grown meat and wool, along with continued technical advancements, is providing new prospects to the major manufacturers of sheep-handling equipment.

The industry growth for sheep handling equipment is mildly impacted by the rising number of people who are lactose intolerant. Also, the trend toward vegetarianism and veganism is affecting the demand for sheep-handling equipment.

Top manufacturers of sheep handling equipment are tracking the sheep and sending real-time alerts via smartphone applications by using smart radio-frequency identification (RFID) tags.
Nandini Roy Choudhury

Principal Consultant

Talk to Analyst

Find your sweet spots for generating winning opportunities in this market.

Comparative View of Sheep Handling Equipment Market

Sheep Handling Equipment Market:

Attributes Sheep Handling Equipment Market
CAGR (2023 to 2033) 3.4%
Market Value (2033) US$ 1,705 million
Growth Factor Automation and robotics
Opportunity Growing small-scale industry
Key Trends GPS and digital monitoring systems

Livestock Farm Equipment Market:

Attributes Livestock Farm Equipment Market
CAGR (2023 to 2033) 3.4%
Market Value (2033) US$ 25.33 billion
Growth Factor Rising consumption of dairy products
Opportunity Efficient management practices
Key Trends Rising automated feeders

Cattle Feed Equipment Market:

Attributes Cattle Feed Equipment Market
CAGR (2023 to 2033) 4.4%
Market Value (2033) US$ 134.31 billion
Growth Factor Tangible advantage of nutritional feed
Opportunity Increased demand for meat protein
Key Trends Rising small-scale producers

Regional Analysis

Organic Animal Products Contributing to the US Sheep Handling Equipment Market Share

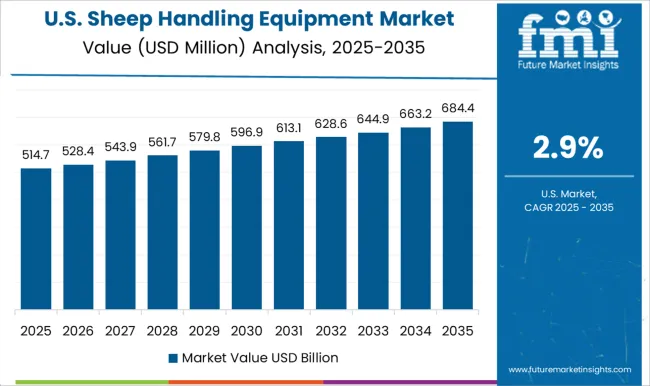
With a share of 30.5%, the sheep-handling equipment business in the United States is worth US$ 360 million in 2022. This market is made up of both small and large businesses and is highly fragmented.

Some of the industry top plates in the US are:

  • Colorado Lamb & Wool
  • Gallagher Animal Management Systems
  • Renteria Manufacturing
  • Shepherd's Supply
  • Valley Vet Supply

With a 20% market share, Colorado Lamb & Wool is the market's top player. The growing need for high-quality livestock products in the livestock business is driving the demand for sheep-handling equipment. The US has an increased demand for natural and organic animal products, which leads to small-scale livestock farm growth.

The adoption of sheep-handling equipment is high due to its utilization in animal exhibitions and shows. The leading firms' increasing investments in Research and Development activities are projected to fuel the US market expansion in the near future.

Top Suppliers Making Majority of the Market Share in the UK

Attributes Statistics
UK Market Value 2022 US$ 115.6 million
UK Market Value 2033 US$ 165.4 million
UK Market Share (2023 to 2033) 9.8%
UK Market CAGR (2023 to 2033) 3.6%

The bulk of suppliers in the UK's sheep-handling equipment sector is situated in England and Wales, with a small number in Scotland and Northern Ireland. The top five providers control over 80% of the market, indicating a highly consolidated market.

The demand for sheep handling equipment in the UK is anticipated to expand, as producers attempt to adopt new procedures to increase productivity.

The market for sheep handling equipment in the UK is quite competitive, with many suppliers providing a range of goods and services. Large agricultural equipment producers, specialized sheep-handling equipment manufacturers, and individual sheep-handling equipment experts are some of these sources.

Asia Pacific Contribution to the Adoption Trends of Sheep Handling Equipment

Country China
Market Share (2022) 8.3%
CAGR (2023 to 2033) 2.7%
Market Value (2033) US$ 127.6 million
Country India
Market Share (2022) 3.6%
CAGR (2023 to 2033) 4%
Market Value (2033) US$ 62.3 million

Compared to other nations, China and India contribute the most to huge livestock. Over the projection period, the regional market would expand due to the rising demand for farm automation in response to the rising livestock.

Governments in the area are likewise promoting and aiding investments in the agricultural industry, aiding the sales of sheep-handling equipment.
The trend of China's growing urbanization has also led to a rise in the demand for sheep and sheep products. As it aids in effective flock management, this has raised the requirement for sheep-handling equipment.

Indian Projects Making Up the Demand

  • The National Livestock Development Programme was started in 2015, giving farmers financial aid for the acquisition of contemporary sheep-handling equipment and other associated infrastructure.
  • The All India Coordinated Research Project offers farmers support in the form of subsidies and equipment for managing sheep. It is supported by the Indian Council of Agricultural Research (ICAR).
  • The National Livestock Improvement Scheme, which was introduced in 2017, encourages small and marginal farmers to utilize contemporary sheep-handling equipment. They offer a 50% subsidy on the equipment's purchase.
  • The Rashtriya Gokul Mission, established in 2014, intends to promote the use of contemporary sheep-handling technology while preserving and advancing indigenous bovine breeds.

Australia Sheep Handling Equipment Industry-Coping with the Agriculture Challenges

Australia held a 2% market share for sheep handling equipment in 2022, with a market value of US$ 23.5 million.

Australia's agricultural sector is most challenging, but new sheep handling equipment is making it safer. Additionally, it might alleviate staff shortages by enabling senior farmers to continue working in the sheep's yards.

According to the National Centre for Farmer Health, farms account for 21% of worker fatalities across all Australian industries, and more people have hospital-treated injuries.

Get the data you need at a Fraction of the cost

Personalize your report by choosing insights you need
and save 40%!

Category Analysis

Automated Sheep Handling Equipment- Profitable Transformation for the Industry

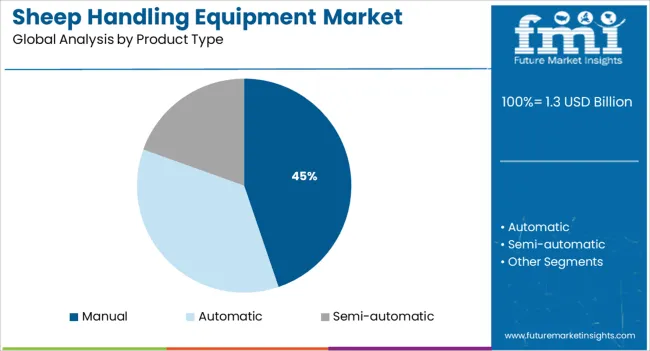
Automatic sheep handling equipment is the largest segment of the industry, based on product type. As the demand for automated systems rises in the agricultural sector, this category is anticipated to dominate the market throughout the forecast period.

Automated solutions give farmers more precision and control over their livestock operations, allowing them to cut labor expenses and boost productivity. Demand for automated sheep handling equipment is desirable since it also provides benefits like increased safety and less animal discomfort.

Based on Category, What is the Outlook of the Industry?

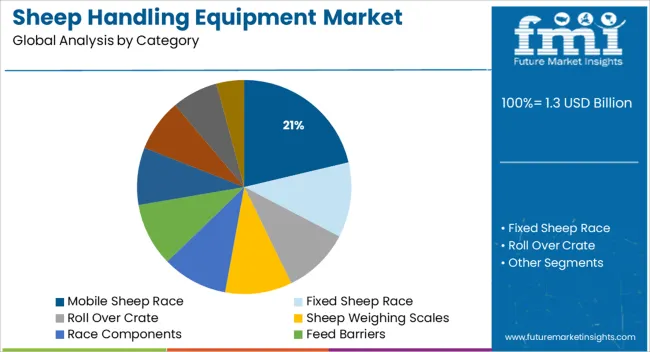
Farmers' desire to transport sheep quickly and safely from one location to another is the main driver of the fixed sheep race segment of the sheep handling equipment industry. In the upcoming years, the market for sheep handling equipment is predicted to have significant growth in the mobile sheep race category.

The rising demand from farmers and other livestock producers for mobile sheep races is what propels this market. Mobile sheep races are made to make it possible for farmers to transport sheep automatically from one field to another.
Competitive Landscape

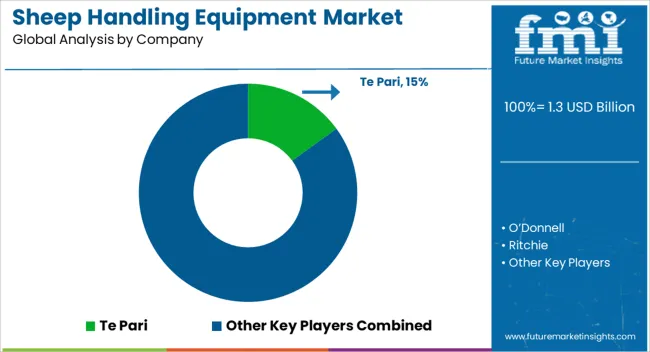
Manufacturers need to look out for solutions that solve the challenges of the sheep-handling equipment industry.

The sheep-handling equipment sector is still in its infancy and is expected to grow quickly. Over the past few years, demand in the industry has steadily increased as farmers seek to strengthen the effectiveness and security of their sheep-handling operations.

The demand is expanding as a result of rising farmer demand and the creation of new and enhanced sheep-handling tools. Currently, a select group of significant players-including Gallagher, Tru-Test, and Sheepmaster-dominate the market. These businesses have a lengthy history in the industry and are recognized as industry leaders.

Smaller businesses, on the other hand, are beginning to enter the market and are providing cutting-edge new goods and services. Future market growth is anticipated due to growing farmer demand, the creation of new, improved goods, and other factors.

Furthermore, through a number of programs, governments and organizations globally are pushing the creation and use of modern livestock management systems. The industry has also expanded as a result of numerous technological developments in the area of sheep management.

Key players in the sheep-handling equipment market are also making investments in R&D to provide goods that are cutting-edge, dependable, and technologically sophisticated. To grow their market share, industry participants are increasingly turning to a stronger regional presence.

Recent Developments

  • In order to improve sales and expand its presence in the Asia Pacific, Big Dutchman constructed a logistics facility and new regional headquarters in Malaysia.
  • In 2020, Premier1Supplies introduced its new line of sheep-handling equipment, which includes sheep scales, handling systems, and feeds. This company is one of the market's major participants. In order to broaden its distribution network, the company also formed a number of new alliances with distributors in the US, Europe, and Australia.
  • Gallagher introduced their new SmartScale weighing system in 2020, with the intention of assisting farmers in keeping tabs on the weights of sheep. In order to increase the security, effectiveness, and precision of managing sheep, the company also unveiled a new computerized sheep-handling system.

Key Players

  • O’Donnell
  • Ritchie
  • Te Pari
  • Tru-Test
  • Premier 1
  • Cotter Agritech
  • OVI Handling
  • Huber Requirement
  • Arrowquip
  • Shepherdsmate
  • StowAg
  • Abattoir equipment & tools

Key segments

By Category:

  • Fixed Sheep Race
  • Mobile Sheep Race
  • Roll Over Crate
  • Sheep Weighing Scales
  • Race Components
  • Feed Barriers
  • Pen Division
  • Walk through feeder
  • Sheep Plastic
  • Other

By Product Type:

  • Manual
  • Automatic
  • Semi-automatic

By Region:

  • North America
  • Latin America
  • Europe
  • East Asia
  • South Asia Pacific
  • Middle East and Africa (MEA)

Frequently Asked Questions

How Much is the Sheep Handling Equipment Market Worth?

The sheep-handling equipment market is estimated to be worth US$ 1,220 million in 2023.

What is the Demand Outlook for the Sheep Handling Equipment Market?

The sheep-handling equipment market is expected to have a CAGR of 3.4% by 2033.

What is the Historical Sheep Handling Equipment Market Share?

The sheep-handling equipment market expanded at a share of US$ 1,180.1 million in 2022.

What is the North America Sheep Handling Equipment Market Outlook?

North America accounted for a 30.5% share of the sheep-handling equipment market in 2022.

Which is the UK Sheep Handling Equipment Market Outlook?

The UK accounts for 3.6% CAGR in the sheep handling equipment market by 2033.

Table of Content

1. Executive Summary | Sheep Handling Equipment Market

    1.1. Global Market Outlook

    1.2. Demand-side Trends

    1.3. Supply-side Trends

    1.4. Technology Roadmap Analysis

    1.5. Analysis and Recommendations

2. Market Overview

    2.1. Market Coverage / Taxonomy

    2.2. Market Definition / Scope / Limitations

3. Market Background

    3.1. Market Dynamics

        3.1.1. Drivers

        3.1.2. Restraints

        3.1.3. Opportunity

        3.1.4. Trends

    3.2. Scenario Forecast

        3.2.1. Demand in Optimistic Scenario

        3.2.2. Demand in Likely Scenario

        3.2.3. Demand in Conservative Scenario

    3.3. Opportunity Map Analysis

    3.4. Product Life Cycle Analysis

    3.5. Supply Chain Analysis

        3.5.1. Supply Side Participants and their Roles

            3.5.1.1. Producers

            3.5.1.2. Mid-Level Participants (Traders / Agents / Brokers)

            3.5.1.3. Wholesalers and Distributors

        3.5.2. Value Added and Value Created at Node in the Supply Chain

        3.5.3. List of Raw Material Suppliers

        3.5.4. List of Existing and Potential Buyers

    3.6. Investment Feasibility Matrix

    3.7. Value Chain Analysis

        3.7.1. Profit Margin Analysis

        3.7.2. Wholesalers and Distributors

        3.7.3. Retailers

    3.8. PESTLE and Porter’s Analysis

    3.9. Regulatory Landscape

        3.9.1. By Key Regions

        3.9.2. By Key Countries

    3.10. Regional Parent Market Outlook

    3.11. Production and Consumption Statistics

    3.12. Import and Export Statistics

4. Global Market Analysis 2018 to 2022 and Forecast, 2023 to 2033

    4.1. Historical Market Size Value (US$ Million) & Volume (Units) Analysis, 2018 to 2022

    4.2. Current and Future Market Size Value (US$ Million) & Volume (Units) Projections, 2023 to 2033

        4.2.1. Y-o-Y Growth Trend Analysis

        4.2.2. Absolute $ Opportunity Analysis

5. Global Market Analysis 2018 to 2022 and Forecast 2023 to 2033, By Type

    5.1. Introduction / Key Findings

    5.2. Historical Market Size Value (US$ Million) & Volume (Units) Analysis By Type, 2018 to 2022

    5.3. Current and Future Market Size Value (US$ Million) & Volume (Units) Analysis and Forecast By Type, 2023 to 2033

        5.3.1. Steel

        5.3.2. Wood

    5.4. Y-o-Y Growth Trend Analysis By Type, 2018 to 2022

    5.5. Absolute $ Opportunity Analysis By Type, 2023 to 2033

6. Global Market Analysis 2018 to 2022 and Forecast 2023 to 2033, By Structure Type

    6.1. Introduction / Key Findings

    6.2. Historical Market Size Value (US$ Million) & Volume (Units) Analysis By Structure Type, 2018 to 2022

    6.3. Current and Future Market Size Value (US$ Million) & Volume (Units) Analysis and Forecast By Structure Type, 2023 to 2033

        6.3.1. Mobile Structures

        6.3.2. Permanent Structures

    6.4. Y-o-Y Growth Trend Analysis By Structure Type, 2018 to 2022

    6.5. Absolute $ Opportunity Analysis By Structure Type, 2023 to 2033

7. Global Market Analysis 2018 to 2022 and Forecast 2023 to 2033, By Region

    7.1. Introduction

    7.2. Historical Market Size Value (US$ Million) & Volume (Units) Analysis By Region, 2018 to 2022

    7.3. Current Market Size Value (US$ Million) & Volume (Units) Analysis and Forecast By Region, 2023 to 2033

        7.3.1. North America

        7.3.2. Latin America

        7.3.3. Europe

        7.3.4. Asia Pacific

        7.3.5. Middle East & Africa (MEA)

    7.4. Market Attractiveness Analysis By Region

8. North America Market Analysis 2018 to 2022 and Forecast 2023 to 2033, By Country

    8.1. Historical Market Size Value (US$ Million) & Volume (Units) Trend Analysis By Market Taxonomy, 2018 to 2022

    8.2. Market Size Value (US$ Million) & Volume (Units) Forecast By Market Taxonomy, 2023 to 2033

        8.2.1. By Country

            8.2.1.1. The US

            8.2.1.2. Canada

        8.2.2. By Type

        8.2.3. By Structure Type

    8.3. Market Attractiveness Analysis

        8.3.1. By Country

        8.3.2. By Type

        8.3.3. By Structure Type

    8.4. Key Takeaways

9. Latin America Market Analysis 2018 to 2022 and Forecast 2023 to 2033, By Country

    9.1. Historical Market Size Value (US$ Million) & Volume (Units) Trend Analysis By Market Taxonomy, 2018 to 2022

    9.2. Market Size Value (US$ Million) & Volume (Units) Forecast By Market Taxonomy, 2023 to 2033

        9.2.1. By Country

            9.2.1.1. Brazil

            9.2.1.2. Mexico

            9.2.1.3. Rest of Latin America

        9.2.2. By Type

        9.2.3. By Structure Type

    9.3. Market Attractiveness Analysis

        9.3.1. By Country

        9.3.2. By Type

        9.3.3. By Structure Type

    9.4. Key Takeaways

10. Europe Market Analysis 2018 to 2022 and Forecast 2023 to 2033, By Country

    10.1. Historical Market Size Value (US$ Million) & Volume (Units) Trend Analysis By Market Taxonomy, 2018 to 2022

    10.2. Market Size Value (US$ Million) & Volume (Units) Forecast By Market Taxonomy, 2023 to 2033

        10.2.1. By Country

            10.2.1.1. Germany

            10.2.1.2. The UK

            10.2.1.3. France

            10.2.1.4. Spain

            10.2.1.5. Italy

            10.2.1.6. Rest of Europe

        10.2.2. By Type

        10.2.3. By Structure Type

    10.3. Market Attractiveness Analysis

        10.3.1. By Country

        10.3.2. By Type

        10.3.3. By Structure Type

    10.4. Key Takeaways

11. Asia Pacific Market Analysis 2018 to 2022 and Forecast 2023 to 2033, By Country

    11.1. Historical Market Size Value (US$ Million) & Volume (Units) Trend Analysis By Market Taxonomy, 2018 to 2022

    11.2. Market Size Value (US$ Million) & Volume (Units) Forecast By Market Taxonomy, 2023 to 2033

        11.2.1. By Country

            11.2.1.1. China

            11.2.1.2. Japan

            11.2.1.3. South Korea

            11.2.1.4. Singapore

            11.2.1.5. Thailand

            11.2.1.6. Indonesia

            11.2.1.7. Australia

            11.2.1.8. New Zealand

            11.2.1.9. Rest of Asia Pacific

        11.2.2. By Type

        11.2.3. By Structure Type

    11.3. Market Attractiveness Analysis

        11.3.1. By Country

        11.3.2. By Type

        11.3.3. By Structure Type

    11.4. Key Takeaways

12. MEA Market Analysis 2018 to 2022 and Forecast 2023 to 2033, By Country

    12.1. Historical Market Size Value (US$ Million) & Volume (Units) Trend Analysis By Market Taxonomy, 2018 to 2022

    12.2. Market Size Value (US$ Million) & Volume (Units) Forecast By Market Taxonomy, 2023 to 2033

        12.2.1. By Country

            12.2.1.1. GCC Countries

            12.2.1.2. South Africa

            12.2.1.3. Israel

            12.2.1.4. Rest of MEA

        12.2.2. By Type

        12.2.3. By Structure Type

    12.3. Market Attractiveness Analysis

        12.3.1. By Country

        12.3.2. By Type

        12.3.3. By Structure Type

    12.4. Key Takeaways

13. Key Countries Market Analysis

    13.1. The US

        13.1.1. Pricing Analysis

        13.1.2. Market Share Analysis, 2022

            13.1.2.1. By Type

            13.1.2.2. By Structure Type

    13.2. Canada

        13.2.1. Pricing Analysis

        13.2.2. Market Share Analysis, 2022

            13.2.2.1. By Type

            13.2.2.2. By Structure Type

    13.3. Brazil

        13.3.1. Pricing Analysis

        13.3.2. Market Share Analysis, 2022

            13.3.2.1. By Type

            13.3.2.2. By Structure Type

    13.4. Mexico

        13.4.1. Pricing Analysis

        13.4.2. Market Share Analysis, 2022

            13.4.2.1. By Type

            13.4.2.2. By Structure Type

    13.5. Germany

        13.5.1. Pricing Analysis

        13.5.2. Market Share Analysis, 2022

            13.5.2.1. By Type

            13.5.2.2. By Structure Type

    13.6. The UK

        13.6.1. Pricing Analysis

        13.6.2. Market Share Analysis, 2022

            13.6.2.1. By Type

            13.6.2.2. By Structure Type

    13.7. France

        13.7.1. Pricing Analysis

        13.7.2. Market Share Analysis, 2022

            13.7.2.1. By Type

            13.7.2.2. By Structure Type

    13.8. Spain

        13.8.1. Pricing Analysis

        13.8.2. Market Share Analysis, 2022

            13.8.2.1. By Type

            13.8.2.2. By Structure Type

    13.9. Italy

        13.9.1. Pricing Analysis

        13.9.2. Market Share Analysis, 2022

            13.9.2.1. By Type

            13.9.2.2. By Structure Type

    13.10. China

        13.10.1. Pricing Analysis

        13.10.2. Market Share Analysis, 2022

            13.10.2.1. By Type

            13.10.2.2. By Structure Type

    13.11. Japan

        13.11.1. Pricing Analysis

        13.11.2. Market Share Analysis, 2022

            13.11.2.1. By Type

            13.11.2.2. By Structure Type

    13.12. South Korea

        13.12.1. Pricing Analysis

        13.12.2. Market Share Analysis, 2022

            13.12.2.1. By Type

            13.12.2.2. By Structure Type

    13.13. Singapore

        13.13.1. Pricing Analysis

        13.13.2. Market Share Analysis, 2022

            13.13.2.1. By Type

            13.13.2.2. By Structure Type

    13.14. Thailand

        13.14.1. Pricing Analysis

        13.14.2. Market Share Analysis, 2022

            13.14.2.1. By Type

            13.14.2.2. By Structure Type

    13.15. Indonesia

        13.15.1. Pricing Analysis

        13.15.2. Market Share Analysis, 2022

            13.15.2.1. By Type

            13.15.2.2. By Structure Type

    13.16. Australia

        13.16.1. Pricing Analysis

        13.16.2. Market Share Analysis, 2022

            13.16.2.1. By Type

            13.16.2.2. By Structure Type

    13.17. New Zealand

        13.17.1. Pricing Analysis

        13.17.2. Market Share Analysis, 2022

            13.17.2.1. By Type

            13.17.2.2. By Structure Type

    13.18. GCC Countries

        13.18.1. Pricing Analysis

        13.18.2. Market Share Analysis, 2022

            13.18.2.1. By Type

            13.18.2.2. By Structure Type

    13.19. South Africa

        13.19.1. Pricing Analysis

        13.19.2. Market Share Analysis, 2022

            13.19.2.1. By Type

            13.19.2.2. By Structure Type

    13.20. Israel

        13.20.1. Pricing Analysis

        13.20.2. Market Share Analysis, 2022

            13.20.2.1. By Type

            13.20.2.2. By Structure Type

14. Market Structure Analysis

    14.1. Competition Dashboard

    14.2. Competition Benchmarking

    14.3. Market Share Analysis of Top Players

        14.3.1. By Regional

        14.3.2. By Type

        14.3.3. By Structure Type

15. Competition Analysis

    15.1. Competition Deep Dive

        15.1.1. Shepherdsmate

            15.1.1.1. Overview

            15.1.1.2. Product Portfolio

            15.1.1.3. Profitability by Market Segments

            15.1.1.4. Sales Footprint

            15.1.1.5. Strategy Overview

                15.1.1.5.1. Marketing Strategy

                15.1.1.5.2. Product Strategy

                15.1.1.5.3. Channel Strategy

        15.1.2. Te Pari

            15.1.2.1. Overview

            15.1.2.2. Product Portfolio

            15.1.2.3. Profitability by Market Segments

            15.1.2.4. Sales Footprint

            15.1.2.5. Strategy Overview

                15.1.2.5.1. Marketing Strategy

                15.1.2.5.2. Product Strategy

                15.1.2.5.3. Channel Strategy

        15.1.3. StowAG

            15.1.3.1. Overview

            15.1.3.2. Product Portfolio

            15.1.3.3. Profitability by Market Segments

            15.1.3.4. Sales Footprint

            15.1.3.5. Strategy Overview

                15.1.3.5.1. Marketing Strategy

                15.1.3.5.2. Product Strategy

                15.1.3.5.3. Channel Strategy

        15.1.4. Hi-Hog

            15.1.4.1. Overview

            15.1.4.2. Product Portfolio

            15.1.4.3. Profitability by Market Segments

            15.1.4.4. Sales Footprint

            15.1.4.5. Strategy Overview

                15.1.4.5.1. Marketing Strategy

                15.1.4.5.2. Product Strategy

                15.1.4.5.3. Channel Strategy

        15.1.5. Tarter

            15.1.5.1. Overview

            15.1.5.2. Product Portfolio

            15.1.5.3. Profitability by Market Segments

            15.1.5.4. Sales Footprint

            15.1.5.5. Strategy Overview

                15.1.5.5.1. Marketing Strategy

                15.1.5.5.2. Product Strategy

                15.1.5.5.3. Channel Strategy

        15.1.6. 2W Equipment

            15.1.6.1. Overview

            15.1.6.2. Product Portfolio

            15.1.6.3. Profitability by Market Segments

            15.1.6.4. Sales Footprint

            15.1.6.5. Strategy Overview

                15.1.6.5.1. Marketing Strategy

                15.1.6.5.2. Product Strategy

                15.1.6.5.3. Channel Strategy

        15.1.7. IAE

            15.1.7.1. Overview

            15.1.7.2. Product Portfolio

            15.1.7.3. Profitability by Market Segments

            15.1.7.4. Sales Footprint

            15.1.7.5. Strategy Overview

                15.1.7.5.1. Marketing Strategy

                15.1.7.5.2. Product Strategy

                15.1.7.5.3. Channel Strategy

        15.1.8. D-S Livestock Equipment

            15.1.8.1. Overview

            15.1.8.2. Product Portfolio

            15.1.8.3. Profitability by Market Segments

            15.1.8.4. Sales Footprint

            15.1.8.5. Strategy Overview

                15.1.8.5.1. Marketing Strategy

                15.1.8.5.2. Product Strategy

                15.1.8.5.3. Channel Strategy

        15.1.9. Zeitlow Distributing

            15.1.9.1. Overview

            15.1.9.2. Product Portfolio

            15.1.9.3. Profitability by Market Segments

            15.1.9.4. Sales Footprint

            15.1.9.5. Strategy Overview

                15.1.9.5.1. Marketing Strategy

                15.1.9.5.2. Product Strategy

                15.1.9.5.3. Channel Strategy

        15.1.10. Pearson Livestock Equipment

            15.1.10.1. Overview

            15.1.10.2. Product Portfolio

            15.1.10.3. Profitability by Market Segments

            15.1.10.4. Sales Footprint

            15.1.10.5. Strategy Overview

                15.1.10.5.1. Marketing Strategy

                15.1.10.5.2. Product Strategy

                15.1.10.5.3. Channel Strategy

16. Assumptions & Acronyms Used

17. Research Methodology

List of Tables

Table 1: Global Market Value (US$ Million) Forecast by Region, 2018 to 2033

Table 2: Global Market Volume (Units) Forecast by Region, 2018 to 2033

Table 3: Global Market Value (US$ Million) Forecast by Type, 2018 to 2033

Table 4: Global Market Volume (Units) Forecast by Type, 2018 to 2033

Table 5: Global Market Value (US$ Million) Forecast by Structure Type, 2018 to 2033

Table 6: Global Market Volume (Units) Forecast by Structure Type, 2018 to 2033

Table 7: North America Market Value (US$ Million) Forecast by Country, 2018 to 2033

Table 8: North America Market Volume (Units) Forecast by Country, 2018 to 2033

Table 9: North America Market Value (US$ Million) Forecast by Type, 2018 to 2033

Table 10: North America Market Volume (Units) Forecast by Type, 2018 to 2033

Table 11: North America Market Value (US$ Million) Forecast by Structure Type, 2018 to 2033

Table 12: North America Market Volume (Units) Forecast by Structure Type, 2018 to 2033

Table 13: Latin America Market Value (US$ Million) Forecast by Country, 2018 to 2033

Table 14: Latin America Market Volume (Units) Forecast by Country, 2018 to 2033

Table 15: Latin America Market Value (US$ Million) Forecast by Type, 2018 to 2033

Table 16: Latin America Market Volume (Units) Forecast by Type, 2018 to 2033

Table 17: Latin America Market Value (US$ Million) Forecast by Structure Type, 2018 to 2033

Table 18: Latin America Market Volume (Units) Forecast by Structure Type, 2018 to 2033

Table 19: Europe Market Value (US$ Million) Forecast by Country, 2018 to 2033

Table 20: Europe Market Volume (Units) Forecast by Country, 2018 to 2033

Table 21: Europe Market Value (US$ Million) Forecast by Type, 2018 to 2033

Table 22: Europe Market Volume (Units) Forecast by Type, 2018 to 2033

Table 23: Europe Market Value (US$ Million) Forecast by Structure Type, 2018 to 2033

Table 24: Europe Market Volume (Units) Forecast by Structure Type, 2018 to 2033

Table 25: Asia Pacific Market Value (US$ Million) Forecast by Country, 2018 to 2033

Table 26: Asia Pacific Market Volume (Units) Forecast by Country, 2018 to 2033

Table 27: Asia Pacific Market Value (US$ Million) Forecast by Type, 2018 to 2033

Table 28: Asia Pacific Market Volume (Units) Forecast by Type, 2018 to 2033

Table 29: Asia Pacific Market Value (US$ Million) Forecast by Structure Type, 2018 to 2033

Table 30: Asia Pacific Market Volume (Units) Forecast by Structure Type, 2018 to 2033

Table 31: MEA Market Value (US$ Million) Forecast by Country, 2018 to 2033

Table 32: MEA Market Volume (Units) Forecast by Country, 2018 to 2033

Table 33: MEA Market Value (US$ Million) Forecast by Type, 2018 to 2033

Table 34: MEA Market Volume (Units) Forecast by Type, 2018 to 2033

Table 35: MEA Market Value (US$ Million) Forecast by Structure Type, 2018 to 2033

Table 36: MEA Market Volume (Units) Forecast by Structure Type, 2018 to 2033

List of Charts

Figure 1: Global Market Value (US$ Million) by Type, 2023 to 2033

Figure 2: Global Market Value (US$ Million) by Structure Type, 2023 to 2033

Figure 3: Global Market Value (US$ Million) by Region, 2023 to 2033

Figure 4: Global Market Value (US$ Million) Analysis by Region, 2018 to 2033

Figure 5: Global Market Volume (Units) Analysis by Region, 2018 to 2033

Figure 6: Global Market Value Share (%) and BPS Analysis by Region, 2023 to 2033

Figure 7: Global Market Y-o-Y Growth (%) Projections by Region, 2023 to 2033

Figure 8: Global Market Value (US$ Million) Analysis by Type, 2018 to 2033

Figure 9: Global Market Volume (Units) Analysis by Type, 2018 to 2033

Figure 10: Global Market Value Share (%) and BPS Analysis by Type, 2023 to 2033

Figure 11: Global Market Y-o-Y Growth (%) Projections by Type, 2023 to 2033

Figure 12: Global Market Value (US$ Million) Analysis by Structure Type, 2018 to 2033

Figure 13: Global Market Volume (Units) Analysis by Structure Type, 2018 to 2033

Figure 14: Global Market Value Share (%) and BPS Analysis by Structure Type, 2023 to 2033

Figure 15: Global Market Y-o-Y Growth (%) Projections by Structure Type, 2023 to 2033

Figure 16: Global Market Attractiveness by Type, 2023 to 2033

Figure 17: Global Market Attractiveness by Structure Type, 2023 to 2033

Figure 18: Global Market Attractiveness by Region, 2023 to 2033

Figure 19: North America Market Value (US$ Million) by Type, 2023 to 2033

Figure 20: North America Market Value (US$ Million) by Structure Type, 2023 to 2033

Figure 21: North America Market Value (US$ Million) by Country, 2023 to 2033

Figure 22: North America Market Value (US$ Million) Analysis by Country, 2018 to 2033

Figure 23: North America Market Volume (Units) Analysis by Country, 2018 to 2033

Figure 24: North America Market Value Share (%) and BPS Analysis by Country, 2023 to 2033

Figure 25: North America Market Y-o-Y Growth (%) Projections by Country, 2023 to 2033

Figure 26: North America Market Value (US$ Million) Analysis by Type, 2018 to 2033

Figure 27: North America Market Volume (Units) Analysis by Type, 2018 to 2033

Figure 28: North America Market Value Share (%) and BPS Analysis by Type, 2023 to 2033

Figure 29: North America Market Y-o-Y Growth (%) Projections by Type, 2023 to 2033

Figure 30: North America Market Value (US$ Million) Analysis by Structure Type, 2018 to 2033

Figure 31: North America Market Volume (Units) Analysis by Structure Type, 2018 to 2033

Figure 32: North America Market Value Share (%) and BPS Analysis by Structure Type, 2023 to 2033

Figure 33: North America Market Y-o-Y Growth (%) Projections by Structure Type, 2023 to 2033

Figure 34: North America Market Attractiveness by Type, 2023 to 2033

Figure 35: North America Market Attractiveness by Structure Type, 2023 to 2033

Figure 36: North America Market Attractiveness by Country, 2023 to 2033

Figure 37: Latin America Market Value (US$ Million) by Type, 2023 to 2033

Figure 38: Latin America Market Value (US$ Million) by Structure Type, 2023 to 2033

Figure 39: Latin America Market Value (US$ Million) by Country, 2023 to 2033

Figure 40: Latin America Market Value (US$ Million) Analysis by Country, 2018 to 2033

Figure 41: Latin America Market Volume (Units) Analysis by Country, 2018 to 2033

Figure 42: Latin America Market Value Share (%) and BPS Analysis by Country, 2023 to 2033

Figure 43: Latin America Market Y-o-Y Growth (%) Projections by Country, 2023 to 2033

Figure 44: Latin America Market Value (US$ Million) Analysis by Type, 2018 to 2033

Figure 45: Latin America Market Volume (Units) Analysis by Type, 2018 to 2033

Figure 46: Latin America Market Value Share (%) and BPS Analysis by Type, 2023 to 2033

Figure 47: Latin America Market Y-o-Y Growth (%) Projections by Type, 2023 to 2033

Figure 48: Latin America Market Value (US$ Million) Analysis by Structure Type, 2018 to 2033

Figure 49: Latin America Market Volume (Units) Analysis by Structure Type, 2018 to 2033

Figure 50: Latin America Market Value Share (%) and BPS Analysis by Structure Type, 2023 to 2033

Figure 51: Latin America Market Y-o-Y Growth (%) Projections by Structure Type, 2023 to 2033

Figure 52: Latin America Market Attractiveness by Type, 2023 to 2033

Figure 53: Latin America Market Attractiveness by Structure Type, 2023 to 2033

Figure 54: Latin America Market Attractiveness by Country, 2023 to 2033

Figure 55: Europe Market Value (US$ Million) by Type, 2023 to 2033

Figure 56: Europe Market Value (US$ Million) by Structure Type, 2023 to 2033

Figure 57: Europe Market Value (US$ Million) by Country, 2023 to 2033

Figure 58: Europe Market Value (US$ Million) Analysis by Country, 2018 to 2033

Figure 59: Europe Market Volume (Units) Analysis by Country, 2018 to 2033

Figure 60: Europe Market Value Share (%) and BPS Analysis by Country, 2023 to 2033

Figure 61: Europe Market Y-o-Y Growth (%) Projections by Country, 2023 to 2033

Figure 62: Europe Market Value (US$ Million) Analysis by Type, 2018 to 2033

Figure 63: Europe Market Volume (Units) Analysis by Type, 2018 to 2033

Figure 64: Europe Market Value Share (%) and BPS Analysis by Type, 2023 to 2033

Figure 65: Europe Market Y-o-Y Growth (%) Projections by Type, 2023 to 2033

Figure 66: Europe Market Value (US$ Million) Analysis by Structure Type, 2018 to 2033

Figure 67: Europe Market Volume (Units) Analysis by Structure Type, 2018 to 2033

Figure 68: Europe Market Value Share (%) and BPS Analysis by Structure Type, 2023 to 2033

Figure 69: Europe Market Y-o-Y Growth (%) Projections by Structure Type, 2023 to 2033

Figure 70: Europe Market Attractiveness by Type, 2023 to 2033

Figure 71: Europe Market Attractiveness by Structure Type, 2023 to 2033

Figure 72: Europe Market Attractiveness by Country, 2023 to 2033

Figure 73: Asia Pacific Market Value (US$ Million) by Type, 2023 to 2033

Figure 74: Asia Pacific Market Value (US$ Million) by Structure Type, 2023 to 2033

Figure 75: Asia Pacific Market Value (US$ Million) by Country, 2023 to 2033

Figure 76: Asia Pacific Market Value (US$ Million) Analysis by Country, 2018 to 2033

Figure 77: Asia Pacific Market Volume (Units) Analysis by Country, 2018 to 2033

Figure 78: Asia Pacific Market Value Share (%) and BPS Analysis by Country, 2023 to 2033

Figure 79: Asia Pacific Market Y-o-Y Growth (%) Projections by Country, 2023 to 2033

Figure 80: Asia Pacific Market Value (US$ Million) Analysis by Type, 2018 to 2033

Figure 81: Asia Pacific Market Volume (Units) Analysis by Type, 2018 to 2033

Figure 82: Asia Pacific Market Value Share (%) and BPS Analysis by Type, 2023 to 2033

Figure 83: Asia Pacific Market Y-o-Y Growth (%) Projections by Type, 2023 to 2033

Figure 84: Asia Pacific Market Value (US$ Million) Analysis by Structure Type, 2018 to 2033

Figure 85: Asia Pacific Market Volume (Units) Analysis by Structure Type, 2018 to 2033

Figure 86: Asia Pacific Market Value Share (%) and BPS Analysis by Structure Type, 2023 to 2033

Figure 87: Asia Pacific Market Y-o-Y Growth (%) Projections by Structure Type, 2023 to 2033

Figure 88: Asia Pacific Market Attractiveness by Type, 2023 to 2033

Figure 89: Asia Pacific Market Attractiveness by Structure Type, 2023 to 2033

Figure 90: Asia Pacific Market Attractiveness by Country, 2023 to 2033

Figure 91: MEA Market Value (US$ Million) by Type, 2023 to 2033

Figure 92: MEA Market Value (US$ Million) by Structure Type, 2023 to 2033

Figure 93: MEA Market Value (US$ Million) by Country, 2023 to 2033

Figure 94: MEA Market Value (US$ Million) Analysis by Country, 2018 to 2033

Figure 95: MEA Market Volume (Units) Analysis by Country, 2018 to 2033

Figure 96: MEA Market Value Share (%) and BPS Analysis by Country, 2023 to 2033

Figure 97: MEA Market Y-o-Y Growth (%) Projections by Country, 2023 to 2033

Figure 98: MEA Market Value (US$ Million) Analysis by Type, 2018 to 2033

Figure 99: MEA Market Volume (Units) Analysis by Type, 2018 to 2033

Figure 100: MEA Market Value Share (%) and BPS Analysis by Type, 2023 to 2033

Figure 101: MEA Market Y-o-Y Growth (%) Projections by Type, 2023 to 2033

Figure 102: MEA Market Value (US$ Million) Analysis by Structure Type, 2018 to 2033

Figure 103: MEA Market Volume (Units) Analysis by Structure Type, 2018 to 2033

Figure 104: MEA Market Value Share (%) and BPS Analysis by Structure Type, 2023 to 2033

Figure 105: MEA Market Y-o-Y Growth (%) Projections by Structure Type, 2023 to 2033

Figure 106: MEA Market Attractiveness by Type, 2023 to 2033

Figure 107: MEA Market Attractiveness by Structure Type, 2023 to 2033

Figure 108: MEA Market Attractiveness by Country, 2023 to 2033

Recommendations

Industrial Automation

Poultry Keeping Machinery Market

Published : September 2023

Process Automation

Chicken Plucking Machine Market

Published : January 2023

Explore Food and Beverage Insights

View Reports

Sheep Handling Equipment Market