Reports

- Global Locations -

Headquarters

Future Market Insights, Inc.

Christiana Corporate, 200
Continental Drive, Suite 401,
Newark, Delaware - 19713,
United States

T: +1-845-579-5705

Americas

Future Market Insights, Inc.

616 Corporate Way, Suite 2-9018,
Valley Cottage, NY 10989, United States

T: +1-347-918-3531

MEA

Future Market Insights

1602-6 Jumeirah Bay X2 Tower, Plot No: JLT-PH2-X2A,
Jumeirah Lakes Towers, Dubai,
United Arab Emirates

Europe

Future Market Insights

3rd Floor, 207 Regent Street,
W1B 3HH London
United Kingdom

T: + 44 (0) 20 8123 9659
D: +44 (0) 20 3287 4268

Asia Pacific

Future Market Insights

IndiaLand Global Tech Park, Unit UG-1, Behind Grand HighStreet, Phase 1, Hinjawadi, MH, Pune – 411057, India

Hydration Backpack Market Snapshot (2023 to 2033)

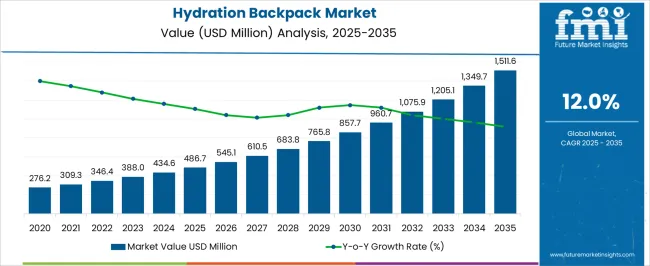
The global hydration backpack market is currently valued at US$ 388 Million and is expected to grow at a CAGR of 12%. Due to its key features such as hands-free operation and its functionality to deliver optimal hydration, the market continues to grow at a rapid rate and will continue to be driven by rising demand for the product. Hydration backpacks are projected to grow to US$ 5,735 Million by 2033, constituting approximately 6% of the global market share.

Demand for military hydration backpacks, increasing consumer awareness of the benefits of staying hydrated, and adventurous outdoor activities are likely to drive the growth of the hydration backpack market in the forecast period. A rise in the use of bladders that can be removed for simpler reservoir maintenance and hydration nozzles designed to make sipping water easier will further grow demand for the product.

Consumers have been increasingly participating in outdoor sports and activities, which has helped boost the product adoption. Additionally, the backpacks and luggage bags industry provides rain covers and fabrics that assist military personnel in camouflaging themselves. Outdoor activities are projected to have a positive impact on the growth of the global market owing to the increasing consumer awareness regarding their improved health and fitness levels.

Report Attribute Details
Expected Market Value (2023) US$ 388 Million
Projected Forecast Value (2033) US$ 5735 Million
Global Growth Rate (2023 to 2033) 12% CAGR

Don't pay for what you don't need

Customize your report by selecting specific countries or regions and save 30%!

Hydration Backpack Revenue Analysis 2018 to 2022 vs. Future Outlook 2023 to 2033

According to market research and competitive intelligence provider FMI, the hydration backpack industry grew at a CAGR of 11.6% from 2018 to 2022. Demand for military hydration products will be driven in the future by a combination of long-term durability, high performance, and high reliability for the products. With the advent of new technologies and advancements in materials, the backpack and luggage bags industry will continue to innovate, which will contribute to the growth of the market.

As one of the most popular outdoor sports gear in the coming years, hydration packs are expected to witness a surge in demand, allowing users to transport liquids without using their hands. Water dispensing systems allow consumers to easily dispense water from them without having to remove their backpacks or remove them while performing certain operations. High demand for sports activities is expected to increase in the coming years due to the popularity of sports activities and the possibility of spending less time at work.

In the wake of the recent pandemic, the world has returned to normalcy and consumers are choosing to make their lives more active. This trend is only going to increase in popularity in the future. Further, due to the substantial increase in defense expenditures across the globe, it is anticipated that new products will be introduced in order to meet the demands of fresh water for soldiers. This is due to the substantial increases in defense expenditures across the globe. In addition to preventing chronic ailments, these products also assist in reducing the number of medicines consumed, as well as improving the overall well-being of users.

What factors are Driving Hydration Backpack Market?

The Popularity of Outdoor Activities is Expected to Boost Demand for Hydration Backpacks

Increasing demand for adventure outdoor activities, a major driving force behind the global hydration backpack market, has contributed substantially to the market development. Sporting activities have been growing in popularity across the globe as consumers have become more interested in leisure activities as part of their busy lives and as a way to reduce stress in their busy lives.

The increasing awareness of hydration while performing activities and hiking instructions has also contributed to the growth of the market. Due to their busy schedules and health concerns, people turn to adventure activities like hikes, treks, cycling, and skiing to escape their stress. In addition, the growth of the global economy and the increase in disposable income will make it easier for established as well as emerging economies to invest more in tourism and events globally.

The increasing trend of e-tailing offers an array of opportunities that are changing the face of e-commerce. The increased interest from consumers presents a significant opportunity for key players to increase revenues and expand their geographic reach. Through social media and listing their products in a variety of marketplaces, several companies have successfully reached a broader consumer base in the market. Backpack and luggage bag manufacturers are enthusiastic about boosting the visibility of their products across regions in order to distinguish themselves from their competitors. Internet penetration is growing significantly, which offers them an excellent opportunity to reach their audience in the market.

Technological Advancement to Drive the Hydration Backpack Market Growth

As more and more body mapping technologies are employed along with ventilation in hydration backpacks, it is forecast that the hydration backpack market will experience steady growth in the coming years.

Additionally, manufacturers are offering hydration backpacks with integrated hydration compartments, vapor-barrier liners, and reflective closed-cell insulation to keep water cold for up to four hours. Aside from that, manufacturers are now also emphasizing the development of transparent hydration backpacks designed to meet the needs of a variety of end users around the globe

Sudip Saha
Sudip Saha

Principal Consultant

Talk to Analyst

Find your sweet spots for generating winning opportunities in this market.

What factors are Limiting the Growth of the Hydration Backpack Market?

While it may sound easy, setting up and cleaning hydration packs during events can be quite a challenge. To access the reservoirs, participants will have to take off their gear, unhook their packs, fill them with water, and wash the packs with cleaning tablets. In the recent development of these packs, soft plastic materials may eventually break down and leak under critical conditions. In the coming years, military hydration products may struggle to succeed due to their nontransparent structure, which may impede sales of hydration backpacks in the coming years.

A lack of disposable income and high prices of hydration backpacks are likely to hamper the market growth in developing nations. As part of the forecast analysis, global brands will also be examined for presence and availability, and the challenges they face due to increased or reduced competition from national and international brands. As well as looking at international trade routes and domestic tariffs, we will also examine the impact of domestic tariffs.
Country-wise Analysis

How does North America Contribute to Global Hydration Backpacks?

Growing Sports Outlets and Product Visibility in the Region contribute to Growth

The North American market is expected to be the top market for hydration backpacks through the forecast period, accumulating a revenue share of 41% over the forecast period. USA and Canadian adventure sports destinations are driving the market. With increased Research and Development investment, many new hydration backpack products are now being developed, which is expected to boost the growth of the North American hydration backpack market.

Also, improved visibility of products and the well-established sports industry will fuel demand for the products in the future. Moreover, the sporting goods retail outlets of major manufacturers as well as technological advancements led to major changes in the sports industry.

The popularity of outdoor activities across the region has boosted the demand for hydration backpacks, especially hiking hydration backpacks in this region. Hydration backpacks tend to gain wide acceptance because they help outdoors enthusiasts drink enough water while they are active. All these factors are expected to grow the market for hydration backpacks in the coming years.
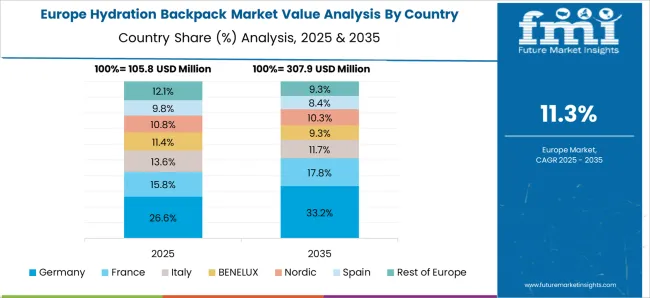
What makes Europe an Opportunistic Market for Hydration Backpacks?

Governing Support and Demand for Military Products in Europe to Boost the Market Growth

Europe is expected to remain the market leader in hydration backpacks through 2023. European hydration backpack market share currently stands at 38% of the global market share. In addition, governments are continually implementing a plethora of initiatives, ensuring that they are constantly developing cutting-edge equipment for the military. As a result of the increased purchases of sports equipment by the United Kingdom, Germany, and France, the market is expected to strengthen the market for hydration backpacks in the coming years.

Among all the countries with military hydration backpacks, the United Kingdom is the most progressive when it comes to adopting new technologies and facilitating their rapid adoption of them. In addition, European military products enjoy government support, which allows them to dominate the market. Several key market players continue to invest in hydration backpack development initiatives that are expected to fuel global demand.

How does the Asia Pacific Region Impact the Hydration Backpack Market?

Growing demand for Hydration Backpacks will Broaden Future Growth Prospects

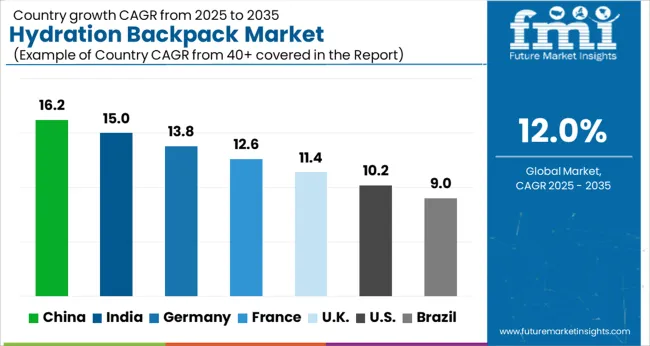
Hydration backpacks dominated the Asia Pacific market with a revenue share of 15% and will continue to do so in the coming years. Several countries, such as China, India, Japan, and South Korea, are focusing their efforts on the production of these bags, which will further increase the market for hydration backpacks. Market growth is expected to continue in the coming years as the population grows, lifestyles become more prevalent, disposable incomes increase, and different styles and innovations develop.

In recent years, hydration backpacks have gained popularity among hikers and biking enthusiasts, contributing to the market's growth. The market growth for these bags has also been driven by social trends as well as celebrity endorsements, which have contributed to the growth of this market.

Growing demand for hydration backpacks that have different sizes and liter capacities in this region is expected to drive the growth of the hydration backpack market in this region in the near future. Additionally, the growing trend of e-tailing will further contribute to the growth of the market in the future.

Get the data you need at a Fraction of the cost

Personalize your report by choosing insights you need
and save 40%!

Category-wise Insights

Which End-user Segment Generates High Revenue in the Hydration Backpack?

Military Segment Generates High Revenue in the Hydration Backpack Market

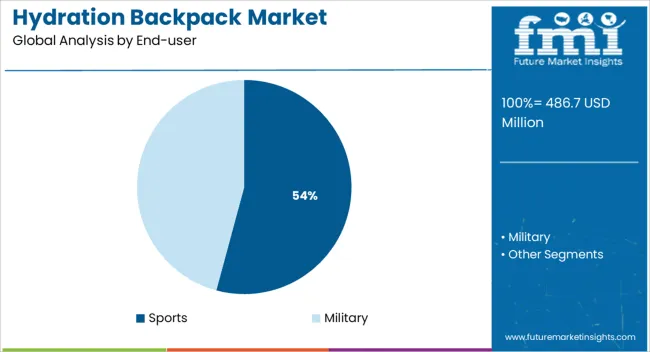
Based on end users the market is segmented into sports and military segments. According to projections, the military market for hydration backpacks will grow at a CAGR of 4.5% by 2033. Military hydration products are projected to gain popularity during the evaluation period due to advances in new technologies, such as high-resolution liquid crystal displays (LCD) screens on water bottles that can provide on-the-go functionality. In addition to the military's increased use of these products, primarily for training purposes, market growth is also expected to increase.

As soldiers throughout the world are expected to employ these products in a variety of training exercises which might involve sprinting, running with heavy loads, or marching over a long distance in a series of events, usually involving short sprints, these products provide essential support. With the increasing demand for hydration packs among military personnel, there is an increased preference for these products in the form of their capacity to hold a great deal of water, compared to other types of products.

In the coming years, military hydration products market growth may be accelerated as concerns about health and safety in the military and defense industry grow. Various countries around the world are increasing their defense expenditures, and it is expected that this will lead to an influx of products that will provide fresh water to soldiers.

How does Online Retail Dominate the Hydration Backpack Market?

Growing E-commerce Websites are expected to Drive Hydration Backpack Sales

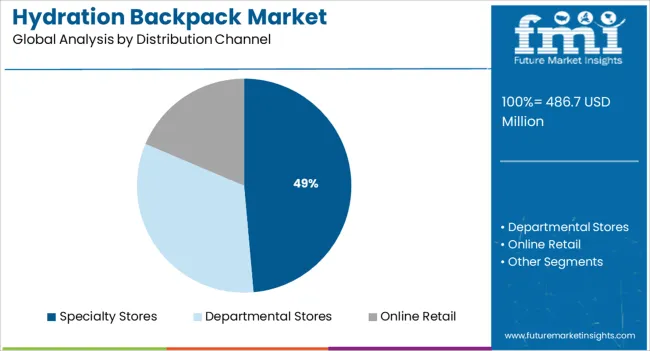
FMI forecasts that online retailers will record the highest CAGR for hydration backpack sales during the forecast period. Further, the increasing number of smart screens and the wide availability of brands and products in the market are likely to further contribute to the growth of the market. Online shopping experiences have been improved by major companies like CamelBak, Jack Wolfskin, and Gregory to enhance sales of these products.

E-commerce has gained popularity over the past few years, mainly due to the convenience that it provides when it comes to shopping with easy access through the internet. Increasingly, buyers across the world are switching from brick-and-mortar to online shopping due to the convenience of having everything at their fingertips has added to the growth of this market. The market is currently flooded with a considerable number of niche players promoting high-quality hydration backpacks for a wide variety of activities and sports.

Start-up Scenario

What Contribution do New Entrants Make to the Hydration Backpack Market?

In an effort to meet consumers' needs, startups are now entering the hydration backpack market. Additionally, these innovative backpack companies offer athletic activity-specific hydration backpacks with additional features and durability. There are several start-up companies now focusing on developing leakproof backpacks and splashproof products for the market.

Some of the start-ups in the hydration backpack market include-
  • The USA-based start-up Vibedration develops products with features such as adjustable sternum straps, a water bladder, and a mouthpiece. This company produces hydration backpacks under a private label. Products are categorized based on their bladder sizes and themes like rave parties, hippies, and psychedelics.
  • USA-based start-up Thrillseeker Key Metrics has established itself as one of the first online travel accessories brands. Their products include hydration backpacks, water sachets, water pipes, and sachets that can be used to store water. Besides offering international shipping for its products, the company also offers the option of local shipping.
  • The USA-based start-up Geigerrig Key Metrics provides a range of performance-enhancing water filters and hydration packs for outdoor sports enthusiasts. In collaboration with Hydrapak, Geigerrig makes hydration packs, accessories, and pressurized hydration systems. In May 2016, Aquamira acquired the company for an undisclosed amount.

Competitive Landscape

By increasing production and meeting consumer demand through strategic partnerships, manufacturers can increase revenues and gain a greater share of the market. Through the adoption of hydration backpacks, users will be able to benefit from new products and technologies. Through strategic partnerships, production capabilities can be expanded.

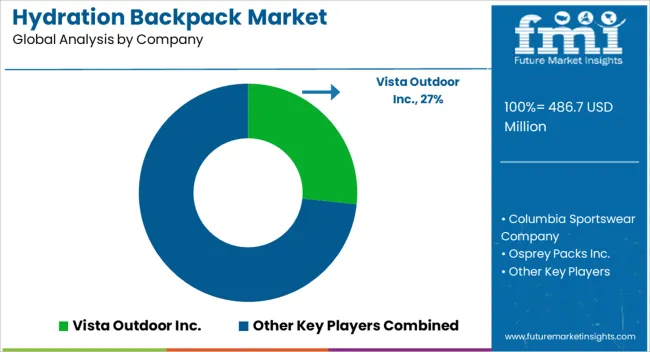
Key players in the global hydration backpack market include Vista Outdoor Inc. (CamelBak), Columbia Sportswear Company, Osprey Packs Inc., High Sierra, Gregory Mountain Products, Source Tactical Gear, Hydro Flask, Mazama Designs, LLC., USWE Sports AB, and TETON Sports.

  • As part of its long-standing leadership in backpack design and innovation, Gregory Mountain Products introduced three new daypack families for fall 2022. With the Tempo H2O and Pace H2O, Gregory introduces a brand-new category of hydration packs that feature insulation technology that keeps the water cooler for two times longer than standard hydration packs. Ventilation and organization upgrades are offered on Salvo H2O and Sula H2O, hydration daypacks. With a modern style, functional design, and recycled materials, Gregory introduces the Rhune into its everyday adventure category.
  • In collaboration with the Designer Park Company, Deborah Walter, the owner and founder of the company, has developed a bag for amusement park trips. Her pack combines extra functionality and style, finally allowing Walter to show off her style. A hydration kit attached to a regular water bottle makes it versatile. It's made from vegan leather. Hydration tubes will be accommodated in the back opening.

Report Scope

Report Attribute Details
Growth Rate (2023 to 2033) 12%
Expected Market Value (2023) US$ 388 Million
ProjectedForecast Value (2033) US$ 5,735 Million
Base Year for Estimation 2022
Historical Data 2018 to 2022
Forecast Period 2023 to 2033
Quantitative Units Revenue in USD Million and CAGR from 2023 to 2033
Report Coverage Revenue Forecast, Volume Forecast, Company Ranking, Competitive Landscape, Growth Factors, Trends, and Pricing Analysis
Segments Covered
  • End User
  • Distribution Channel
  • Region
Regions Covered
  • North America
  • Latin America
  • Europe
  • Asia Pacific
  • Middle East & Africa
Key Countries Profiled
  • USA
  • Canada
  • Brazil
  • Mexico
  • Germany
  • United Kingdom
  • France
  • Spain
  • Italy
  • China
  • Japan
  • South Korea
  • Singapore
  • Thailand
  • Indonesia
  • Australia
  • New Zealand
  • GCC Countries
  • South Africa
  • Israel
Key Companies Profiled
  • Vista Outdoor Inc. (CamelBak)
  • Columbia Sportswear Company
  • Osprey Packs Inc.
  • High Sierra, Gregory Mountain Products
  • Source Tactical Gear
  • Hydro Flask
  • Mazama Designs, LLC.
  • USWE Sports AB
  • TETON Sports
  • GenZ Outdoor
  • Whipsaw
Customization Available Upon Request

Key Segments Covered in the Hydration Backpack Market Industry Survey

Hydration Backpack Market by End User:

  • Hydration Backpack for Sports
  • Hydration Backpack for Military

Hydration Backpack Market by Distribution Channel:

  • Hydration Backpack Sales via Specialty Stores
  • Hydration Backpack Sales via Departmental Stores
  • Hydration Backpack Sales via Online Retail

Hydration Backpack Market by Region:

  • North America Hydration Backpack Market
  • Latin America Hydration Backpack Market
  • Europe Hydration Backpack Market
  • Asia Pacific Hydration Backpack Market
  • Middle East & Africa Hydration Backpack Market

Frequently Asked Questions

What is the expected valuation of the hydration backpack market?

The global hydration backpack market is likely to reach a valuation of US$ 388 million by the end of 2023.

Who are the key players in the hydration backpack market?

Vista Outdoor Inc. (CamelBak), Columbia Sportswear Company, Osprey Packs Inc., High Sierra, Gregory Mountain Products, Source Tactical Gear, Hydro Flask, Mazama Designs, LLC., USWE Sports AB, and TETON Sports.

What are the future prospects for hydration backpack market sales?

Sales of the hydration backpack market are likely to expand at 12% CAGR through 2033.

Which are the top 5 countries driving demand for the hydration backpack market?

The USA, United Kingdom, Canada, China, and Germany are predicted to drive most of the hydration backpack market demand.

What will be the global hydration backpack market revenue total by 2033?

By the end of 2033, the global market for the hydration backpack market is predicted to reach a valuation of US$ 1,205 Million

Table of Content

1. Executive Summary | Hydration Backpack Market

    1.1. Global Market Outlook

    1.2. Demand-side Trends

    1.3. Supply-side Trends

    1.4. Technology Roadmap Analysis

    1.5. Analysis and Recommendations

2. Market Overview

    2.1. Market Coverage / Taxonomy

    2.2. Market Definition / Scope / Limitations

3. Market Background

    3.1. Market Dynamics

        3.1.1. Drivers

        3.1.2. Restraints

        3.1.3. Opportunity

        3.1.4. Trends

    3.2. Scenario Forecast

        3.2.1. Demand in Optimistic Scenario

        3.2.2. Demand in Likely Scenario

        3.2.3. Demand in Conservative Scenario

    3.3. Opportunity Map Analysis

    3.4. Product Life Cycle Analysis

    3.5. Supply Chain Analysis

        3.5.1. Supply Side Participants and their Roles

            3.5.1.1. Producers

            3.5.1.2. Mid-Level Participants (Traders/ Agents/ Brokers)

            3.5.1.3. Wholesalers and Distributors

        3.5.2. Value Added and Value Created at Node in the Supply Chain

        3.5.3. List of Raw Material Suppliers

        3.5.4. List of Existing and Potential Buyers

    3.6. Investment Feasibility Matrix

    3.7. Value Chain Analysis

        3.7.1. Profit Margin Analysis

        3.7.2. Wholesalers and Distributors

        3.7.3. Retailers

    3.8. PESTLE and Porter’s Analysis

    3.9. Regulatory Landscape

        3.9.1. By Key Regions

        3.9.2. By Key Countries

    3.10. Regional Parent Market Outlook

    3.11. Production and Consumption Statistics

    3.12. Import and Export Statistics

4. Global Market Analysis 2018 to 2022 and Forecast, 2023 to 2033

    4.1. Historical Market Size Value (US$ Million) & Volume (Units) Analysis, 2018 to 2022

    4.2. Current and Future Market Size Value (US$ Million) & Volume (Units) Projections, 2023 to 2033

        4.2.1. Y-o-Y Growth Trend Analysis

        4.2.2. Absolute $ Opportunity Analysis

5. Global Market Analysis 2018 to 2022 and Forecast 2023 to 2033, By End-user

    5.1. Introduction / Key Findings

    5.2. Historical Market Size Value (US$ Million) & Volume (Units) Analysis By End-user, 2018 to 2022

    5.3. Current and Future Market Size Value (US$ Million) & Volume (Units) Analysis and Forecast By End-user, 2023 to 2033

        5.3.1. Sports

        5.3.2. Military

    5.4. Y-o-Y Growth Trend Analysis By End-user, 2018 to 2022

    5.5. Absolute $ Opportunity Analysis By End-user, 2023 to 2033

6. Global Market Analysis 2018 to 2022 and Forecast 2023 to 2033, By Distribution Channel

    6.1. Introduction / Key Findings

    6.2. Historical Market Size Value (US$ Million) & Volume (Units) Analysis By Distribution Channel, 2018 to 2022

    6.3. Current and Future Market Size Value (US$ Million) & Volume (Units) Analysis and Forecast By Distribution Channel, 2023 to 2033

        6.3.1. Specialty Stores

        6.3.2. Departmental Stores

        6.3.3. Online Retail

    6.4. Y-o-Y Growth Trend Analysis By Distribution Channel, 2018 to 2022

    6.5. Absolute $ Opportunity Analysis By Distribution Channel, 2023 to 2033

7. Global Market Analysis 2018 to 2022 and Forecast 2023 to 2033, By Region

    7.1. Introduction

    7.2. Historical Market Size Value (US$ Million) & Volume (Units) Analysis By Region, 2018 to 2022

    7.3. Current Market Size Value (US$ Million) & Volume (Units) Analysis and Forecast By Region, 2023 to 2033

        7.3.1. North America

        7.3.2. Latin America

        7.3.3. Europe

        7.3.4. Asia Pacific

        7.3.5. Middle East and Africa(MEA)

    7.4. Market Attractiveness Analysis By Region

8. North America Market Analysis 2018 to 2022 and Forecast 2023 to 2033, By Country

    8.1. Historical Market Size Value (US$ Million) & Volume (Units) Trend Analysis By Market Taxonomy, 2018 to 2022

    8.2. Market Size Value (US$ Million) & Volume (Units) Forecast By Market Taxonomy, 2023 to 2033

        8.2.1. By Country

            8.2.1.1. USA

            8.2.1.2. Canada

        8.2.2. By End-user

        8.2.3. By Distribution Channel

    8.3. Market Attractiveness Analysis

        8.3.1. By Country

        8.3.2. By End-user

        8.3.3. By Distribution Channel

    8.4. Key Takeaways

9. Latin America Market Analysis 2018 to 2022 and Forecast 2023 to 2033, By Country

    9.1. Historical Market Size Value (US$ Million) & Volume (Units) Trend Analysis By Market Taxonomy, 2018 to 2022

    9.2. Market Size Value (US$ Million) & Volume (Units) Forecast By Market Taxonomy, 2023 to 2033

        9.2.1. By Country

            9.2.1.1. Brazil

            9.2.1.2. Mexico

            9.2.1.3. Rest of Latin America

        9.2.2. By End-user

        9.2.3. By Distribution Channel

    9.3. Market Attractiveness Analysis

        9.3.1. By Country

        9.3.2. By End-user

        9.3.3. By Distribution Channel

    9.4. Key Takeaways

10. Europe Market Analysis 2018 to 2022 and Forecast 2023 to 2033, By Country

    10.1. Historical Market Size Value (US$ Million) & Volume (Units) Trend Analysis By Market Taxonomy, 2018 to 2022

    10.2. Market Size Value (US$ Million) & Volume (Units) Forecast By Market Taxonomy, 2023 to 2033

        10.2.1. By Country

            10.2.1.1. Germany

            10.2.1.2. United Kingdom

            10.2.1.3. France

            10.2.1.4. Spain

            10.2.1.5. Italy

            10.2.1.6. Rest of Europe

        10.2.2. By End-user

        10.2.3. By Distribution Channel

    10.3. Market Attractiveness Analysis

        10.3.1. By Country

        10.3.2. By End-user

        10.3.3. By Distribution Channel

    10.4. Key Takeaways

11. Asia Pacific Market Analysis 2018 to 2022 and Forecast 2023 to 2033, By Country

    11.1. Historical Market Size Value (US$ Million) & Volume (Units) Trend Analysis By Market Taxonomy, 2018 to 2022

    11.2. Market Size Value (US$ Million) & Volume (Units) Forecast By Market Taxonomy, 2023 to 2033

        11.2.1. By Country

            11.2.1.1. China

            11.2.1.2. Japan

            11.2.1.3. South Korea

            11.2.1.4. Singapore

            11.2.1.5. Thailand

            11.2.1.6. Indonesia

            11.2.1.7. Australia

            11.2.1.8. New Zealand

            11.2.1.9. Rest of Asia Pacific

        11.2.2. By End-user

        11.2.3. By Distribution Channel

    11.3. Market Attractiveness Analysis

        11.3.1. By Country

        11.3.2. By End-user

        11.3.3. By Distribution Channel

    11.4. Key Takeaways

12. MEA Market Analysis 2018 to 2022 and Forecast 2023 to 2033, By Country

    12.1. Historical Market Size Value (US$ Million) & Volume (Units) Trend Analysis By Market Taxonomy, 2018 to 2022

    12.2. Market Size Value (US$ Million) & Volume (Units) Forecast By Market Taxonomy, 2023 to 2033

        12.2.1. By Country

            12.2.1.1. GCC Countries

            12.2.1.2. South Africa

            12.2.1.3. Israel

            12.2.1.4. Rest of Middle East and Africa(MEA)

        12.2.2. By End-user

        12.2.3. By Distribution Channel

    12.3. Market Attractiveness Analysis

        12.3.1. By Country

        12.3.2. By End-user

        12.3.3. By Distribution Channel

    12.4. Key Takeaways

13. Key Countries Market Analysis

    13.1. USA

        13.1.1. Pricing Analysis

        13.1.2. Market Share Analysis, 2021

            13.1.2.1. By End-user

            13.1.2.2. By Distribution Channel

    13.2. Canada

        13.2.1. Pricing Analysis

        13.2.2. Market Share Analysis, 2021

            13.2.2.1. By End-user

            13.2.2.2. By Distribution Channel

    13.3. Brazil

        13.3.1. Pricing Analysis

        13.3.2. Market Share Analysis, 2021

            13.3.2.1. By End-user

            13.3.2.2. By Distribution Channel

    13.4. Mexico

        13.4.1. Pricing Analysis

        13.4.2. Market Share Analysis, 2021

            13.4.2.1. By End-user

            13.4.2.2. By Distribution Channel

    13.5. Germany

        13.5.1. Pricing Analysis

        13.5.2. Market Share Analysis, 2021

            13.5.2.1. By End-user

            13.5.2.2. By Distribution Channel

    13.6. United Kingdom

        13.6.1. Pricing Analysis

        13.6.2. Market Share Analysis, 2021

            13.6.2.1. By End-user

            13.6.2.2. By Distribution Channel

    13.7. France

        13.7.1. Pricing Analysis

        13.7.2. Market Share Analysis, 2021

            13.7.2.1. By End-user

            13.7.2.2. By Distribution Channel

    13.8. Spain

        13.8.1. Pricing Analysis

        13.8.2. Market Share Analysis, 2021

            13.8.2.1. By End-user

            13.8.2.2. By Distribution Channel

    13.9. Italy

        13.9.1. Pricing Analysis

        13.9.2. Market Share Analysis, 2021

            13.9.2.1. By End-user

            13.9.2.2. By Distribution Channel

    13.10. China

        13.10.1. Pricing Analysis

        13.10.2. Market Share Analysis, 2021

            13.10.2.1. By End-user

            13.10.2.2. By Distribution Channel

    13.11. Japan

        13.11.1. Pricing Analysis

        13.11.2. Market Share Analysis, 2021

            13.11.2.1. By End-user

            13.11.2.2. By Distribution Channel

    13.12. South Korea

        13.12.1. Pricing Analysis

        13.12.2. Market Share Analysis, 2021

            13.12.2.1. By End-user

            13.12.2.2. By Distribution Channel

    13.13. Singapore

        13.13.1. Pricing Analysis

        13.13.2. Market Share Analysis, 2021

            13.13.2.1. By End-user

            13.13.2.2. By Distribution Channel

    13.14. Thailand

        13.14.1. Pricing Analysis

        13.14.2. Market Share Analysis, 2021

            13.14.2.1. By End-user

            13.14.2.2. By Distribution Channel

    13.15. Indonesia

        13.15.1. Pricing Analysis

        13.15.2. Market Share Analysis, 2021

            13.15.2.1. By End-user

            13.15.2.2. By Distribution Channel

    13.16. Australia

        13.16.1. Pricing Analysis

        13.16.2. Market Share Analysis, 2021

            13.16.2.1. By End-user

            13.16.2.2. By Distribution Channel

    13.17. New Zealand

        13.17.1. Pricing Analysis

        13.17.2. Market Share Analysis, 2021

            13.17.2.1. By End-user

            13.17.2.2. By Distribution Channel

    13.18. GCC Countries

        13.18.1. Pricing Analysis

        13.18.2. Market Share Analysis, 2021

            13.18.2.1. By End-user

            13.18.2.2. By Distribution Channel

    13.19. South Africa

        13.19.1. Pricing Analysis

        13.19.2. Market Share Analysis, 2021

            13.19.2.1. By End-user

            13.19.2.2. By Distribution Channel

    13.20. Israel

        13.20.1. Pricing Analysis

        13.20.2. Market Share Analysis, 2021

            13.20.2.1. By End-user

            13.20.2.2. By Distribution Channel

14. Market Structure Analysis

    14.1. Competition Dashboard

    14.2. Competition Benchmarking

    14.3. Market Share Analysis of Top Players

        14.3.1. By Regional

        14.3.2. By End-user

        14.3.3. By Distribution Channel

15. Competition Analysis

    15.1. Competition Deep Dive

        15.1.1. Vista Outdoor Inc.

            15.1.1.1. Overview

            15.1.1.2. Product Portfolio

            15.1.1.3. Profitability by Market Segments

            15.1.1.4. Sales Footprint

            15.1.1.5. Strategy Overview

                15.1.1.5.1. Marketing Strategy

                15.1.1.5.2. Product Strategy

                15.1.1.5.3. Channel Strategy

        15.1.2. Columbia Sportswear Company

            15.1.2.1. Overview

            15.1.2.2. Product Portfolio

            15.1.2.3. Profitability by Market Segments

            15.1.2.4. Sales Footprint

            15.1.2.5. Strategy Overview

                15.1.2.5.1. Marketing Strategy

                15.1.2.5.2. Product Strategy

                15.1.2.5.3. Channel Strategy

        15.1.3. Osprey Packs Inc.

            15.1.3.1. Overview

            15.1.3.2. Product Portfolio

            15.1.3.3. Profitability by Market Segments

            15.1.3.4. Sales Footprint

            15.1.3.5. Strategy Overview

                15.1.3.5.1. Marketing Strategy

                15.1.3.5.2. Product Strategy

                15.1.3.5.3. Channel Strategy

        15.1.4. High Sierra

            15.1.4.1. Overview

            15.1.4.2. Product Portfolio

            15.1.4.3. Profitability by Market Segments

            15.1.4.4. Sales Footprint

            15.1.4.5. Strategy Overview

                15.1.4.5.1. Marketing Strategy

                15.1.4.5.2. Product Strategy

                15.1.4.5.3. Channel Strategy

        15.1.5. Gregory Mountain Products

            15.1.5.1. Overview

            15.1.5.2. Product Portfolio

            15.1.5.3. Profitability by Market Segments

            15.1.5.4. Sales Footprint

            15.1.5.5. Strategy Overview

                15.1.5.5.1. Marketing Strategy

                15.1.5.5.2. Product Strategy

                15.1.5.5.3. Channel Strategy

        15.1.6. Source Tactical Gear

            15.1.6.1. Overview

            15.1.6.2. Product Portfolio

            15.1.6.3. Profitability by Market Segments

            15.1.6.4. Sales Footprint

            15.1.6.5. Strategy Overview

                15.1.6.5.1. Marketing Strategy

                15.1.6.5.2. Product Strategy

                15.1.6.5.3. Channel Strategy

        15.1.7. Hydro Flask

            15.1.7.1. Overview

            15.1.7.2. Product Portfolio

            15.1.7.3. Profitability by Market Segments

            15.1.7.4. Sales Footprint

            15.1.7.5. Strategy Overview

                15.1.7.5.1. Marketing Strategy

                15.1.7.5.2. Product Strategy

                15.1.7.5.3. Channel Strategy

        15.1.8. Mazama Designs LLC

            15.1.8.1. Overview

            15.1.8.2. Product Portfolio

            15.1.8.3. Profitability by Market Segments

            15.1.8.4. Sales Footprint

            15.1.8.5. Strategy Overview

                15.1.8.5.1. Marketing Strategy

                15.1.8.5.2. Product Strategy

                15.1.8.5.3. Channel Strategy

        15.1.9. USWE Sports AB

            15.1.9.1. Overview

            15.1.9.2. Product Portfolio

            15.1.9.3. Profitability by Market Segments

            15.1.9.4. Sales Footprint

            15.1.9.5. Strategy Overview

                15.1.9.5.1. Marketing Strategy

                15.1.9.5.2. Product Strategy

                15.1.9.5.3. Channel Strategy

        15.1.10. TETON Sports

            15.1.10.1. Overview

            15.1.10.2. Product Portfolio

            15.1.10.3. Profitability by Market Segments

            15.1.10.4. Sales Footprint

            15.1.10.5. Strategy Overview

                15.1.10.5.1. Marketing Strategy

                15.1.10.5.2. Product Strategy

                15.1.10.5.3. Channel Strategy

        15.1.11. GenZ Outdoor

            15.1.11.1. Overview

            15.1.11.2. Product Portfolio

            15.1.11.3. Profitability by Market Segments

            15.1.11.4. Sales Footprint

            15.1.11.5. Strategy Overview

                15.1.11.5.1. Marketing Strategy

                15.1.11.5.2. Product Strategy

                15.1.11.5.3. Channel Strategy

        15.1.12. Whipsaw

            15.1.12.1. Overview

            15.1.12.2. Product Portfolio

            15.1.12.3. Profitability by Market Segments

            15.1.12.4. Sales Footprint

            15.1.12.5. Strategy Overview

                15.1.12.5.1. Marketing Strategy

                15.1.12.5.2. Product Strategy

                15.1.12.5.3. Channel Strategy

        15.1.13. Vibedration

            15.1.13.1. Overview

            15.1.13.2. Product Portfolio

            15.1.13.3. Profitability by Market Segments

            15.1.13.4. Sales Footprint

            15.1.13.5. Strategy Overview

                15.1.13.5.1. Marketing Strategy

                15.1.13.5.2. Product Strategy

                15.1.13.5.3. Channel Strategy

        15.1.14. Thrillseeker Key Metric

            15.1.14.1. Overview

            15.1.14.2. Product Portfolio

            15.1.14.3. Profitability by Market Segments

            15.1.14.4. Sales Footprint

            15.1.14.5. Strategy Overview

                15.1.14.5.1. Marketing Strategy

                15.1.14.5.2. Product Strategy

                15.1.14.5.3. Channel Strategy

        15.1.15. Geigerrig Key Metrics

            15.1.15.1. Overview

            15.1.15.2. Product Portfolio

            15.1.15.3. Profitability by Market Segments

            15.1.15.4. Sales Footprint

            15.1.15.5. Strategy Overview

                15.1.15.5.1. Marketing Strategy

                15.1.15.5.2. Product Strategy

                15.1.15.5.3. Channel Strategy

List of Tables

Table 1: Global Market Value (US$ Million) Forecast by Region, 2018 to 2033

Table 2: Global Market Volume (Units) Forecast by Region, 2018 to 2033

Table 3: Global Market Value (US$ Million) Forecast by End-user, 2018 to 2033

Table 4: Global Market Volume (Units) Forecast by End-user, 2018 to 2033

Table 5: Global Market Value (US$ Million) Forecast by Distribution Channel, 2018 to 2033

Table 6: Global Market Volume (Units) Forecast by Distribution Channel, 2018 to 2033

Table 7: North America Market Value (US$ Million) Forecast by Country, 2018 to 2033

Table 8: North America Market Volume (Units) Forecast by Country, 2018 to 2033

Table 9: North America Market Value (US$ Million) Forecast by End-user, 2018 to 2033

Table 10: North America Market Volume (Units) Forecast by End-user, 2018 to 2033

Table 11: North America Market Value (US$ Million) Forecast by Distribution Channel, 2018 to 2033

Table 12: North America Market Volume (Units) Forecast by Distribution Channel, 2018 to 2033

Table 13: Latin America Market Value (US$ Million) Forecast by Country, 2018 to 2033

Table 14: Latin America Market Volume (Units) Forecast by Country, 2018 to 2033

Table 15: Latin America Market Value (US$ Million) Forecast by End-user, 2018 to 2033

Table 16: Latin America Market Volume (Units) Forecast by End-user, 2018 to 2033

Table 17: Latin America Market Value (US$ Million) Forecast by Distribution Channel, 2018 to 2033

Table 18: Latin America Market Volume (Units) Forecast by Distribution Channel, 2018 to 2033

Table 19: Europe Market Value (US$ Million) Forecast by Country, 2018 to 2033

Table 20: Europe Market Volume (Units) Forecast by Country, 2018 to 2033

Table 21: Europe Market Value (US$ Million) Forecast by End-user, 2018 to 2033

Table 22: Europe Market Volume (Units) Forecast by End-user, 2018 to 2033

Table 23: Europe Market Value (US$ Million) Forecast by Distribution Channel, 2018 to 2033

Table 24: Europe Market Volume (Units) Forecast by Distribution Channel, 2018 to 2033

Table 25: Asia Pacific Market Value (US$ Million) Forecast by Country, 2018 to 2033

Table 26: Asia Pacific Market Volume (Units) Forecast by Country, 2018 to 2033

Table 27: Asia Pacific Market Value (US$ Million) Forecast by End-user, 2018 to 2033

Table 28: Asia Pacific Market Volume (Units) Forecast by End-user, 2018 to 2033

Table 29: Asia Pacific Market Value (US$ Million) Forecast by Distribution Channel, 2018 to 2033

Table 30: Asia Pacific Market Volume (Units) Forecast by Distribution Channel, 2018 to 2033

Table 31: MEA Market Value (US$ Million) Forecast by Country, 2018 to 2033

Table 32: MEA Market Volume (Units) Forecast by Country, 2018 to 2033

Table 33: MEA Market Value (US$ Million) Forecast by End-user, 2018 to 2033

Table 34: MEA Market Volume (Units) Forecast by End-user, 2018 to 2033

Table 35: MEA Market Value (US$ Million) Forecast by Distribution Channel, 2018 to 2033

Table 36: MEA Market Volume (Units) Forecast by Distribution Channel, 2018 to 2033

List of Charts

Figure 1: Global Market Value (US$ Million) by End-user, 2023 to 2033

Figure 2: Global Market Value (US$ Million) by Distribution Channel, 2023 to 2033

Figure 3: Global Market Value (US$ Million) by Region, 2023 to 2033

Figure 4: Global Market Value (US$ Million) Analysis by Region, 2018 to 2033

Figure 5: Global Market Volume (Units) Analysis by Region, 2018 to 2033

Figure 6: Global Market Value Share (%) and BPS Analysis by Region, 2023 to 2033

Figure 7: Global Market Y-o-Y Growth (%) Projections by Region, 2023 to 2033

Figure 8: Global Market Value (US$ Million) Analysis by End-user, 2018 to 2033

Figure 9: Global Market Volume (Units) Analysis by End-user, 2018 to 2033

Figure 10: Global Market Value Share (%) and BPS Analysis by End-user, 2023 to 2033

Figure 11: Global Market Y-o-Y Growth (%) Projections by End-user, 2023 to 2033

Figure 12: Global Market Value (US$ Million) Analysis by Distribution Channel, 2018 to 2033

Figure 13: Global Market Volume (Units) Analysis by Distribution Channel, 2018 to 2033

Figure 14: Global Market Value Share (%) and BPS Analysis by Distribution Channel, 2023 to 2033

Figure 15: Global Market Y-o-Y Growth (%) Projections by Distribution Channel, 2023 to 2033

Figure 16: Global Market Attractiveness by End-user, 2023 to 2033

Figure 17: Global Market Attractiveness by Distribution Channel, 2023 to 2033

Figure 18: Global Market Attractiveness by Region, 2023 to 2033

Figure 19: North America Market Value (US$ Million) by End-user, 2023 to 2033

Figure 20: North America Market Value (US$ Million) by Distribution Channel, 2023 to 2033

Figure 21: North America Market Value (US$ Million) by Country, 2023 to 2033

Figure 22: North America Market Value (US$ Million) Analysis by Country, 2018 to 2033

Figure 23: North America Market Volume (Units) Analysis by Country, 2018 to 2033

Figure 24: North America Market Value Share (%) and BPS Analysis by Country, 2023 to 2033

Figure 25: North America Market Y-o-Y Growth (%) Projections by Country, 2023 to 2033

Figure 26: North America Market Value (US$ Million) Analysis by End-user, 2018 to 2033

Figure 27: North America Market Volume (Units) Analysis by End-user, 2018 to 2033

Figure 28: North America Market Value Share (%) and BPS Analysis by End-user, 2023 to 2033

Figure 29: North America Market Y-o-Y Growth (%) Projections by End-user, 2023 to 2033

Figure 30: North America Market Value (US$ Million) Analysis by Distribution Channel, 2018 to 2033

Figure 31: North America Market Volume (Units) Analysis by Distribution Channel, 2018 to 2033

Figure 32: North America Market Value Share (%) and BPS Analysis by Distribution Channel, 2023 to 2033

Figure 33: North America Market Y-o-Y Growth (%) Projections by Distribution Channel, 2023 to 2033

Figure 34: North America Market Attractiveness by End-user, 2023 to 2033

Figure 35: North America Market Attractiveness by Distribution Channel, 2023 to 2033

Figure 36: North America Market Attractiveness by Country, 2023 to 2033

Figure 37: Latin America Market Value (US$ Million) by End-user, 2023 to 2033

Figure 38: Latin America Market Value (US$ Million) by Distribution Channel, 2023 to 2033

Figure 39: Latin America Market Value (US$ Million) by Country, 2023 to 2033

Figure 40: Latin America Market Value (US$ Million) Analysis by Country, 2018 to 2033

Figure 41: Latin America Market Volume (Units) Analysis by Country, 2018 to 2033

Figure 42: Latin America Market Value Share (%) and BPS Analysis by Country, 2023 to 2033

Figure 43: Latin America Market Y-o-Y Growth (%) Projections by Country, 2023 to 2033

Figure 44: Latin America Market Value (US$ Million) Analysis by End-user, 2018 to 2033

Figure 45: Latin America Market Volume (Units) Analysis by End-user, 2018 to 2033

Figure 46: Latin America Market Value Share (%) and BPS Analysis by End-user, 2023 to 2033

Figure 47: Latin America Market Y-o-Y Growth (%) Projections by End-user, 2023 to 2033

Figure 48: Latin America Market Value (US$ Million) Analysis by Distribution Channel, 2018 to 2033

Figure 49: Latin America Market Volume (Units) Analysis by Distribution Channel, 2018 to 2033

Figure 50: Latin America Market Value Share (%) and BPS Analysis by Distribution Channel, 2023 to 2033

Figure 51: Latin America Market Y-o-Y Growth (%) Projections by Distribution Channel, 2023 to 2033

Figure 52: Latin America Market Attractiveness by End-user, 2023 to 2033

Figure 53: Latin America Market Attractiveness by Distribution Channel, 2023 to 2033

Figure 54: Latin America Market Attractiveness by Country, 2023 to 2033

Figure 55: Europe Market Value (US$ Million) by End-user, 2023 to 2033

Figure 56: Europe Market Value (US$ Million) by Distribution Channel, 2023 to 2033

Figure 57: Europe Market Value (US$ Million) by Country, 2023 to 2033

Figure 58: Europe Market Value (US$ Million) Analysis by Country, 2018 to 2033

Figure 59: Europe Market Volume (Units) Analysis by Country, 2018 to 2033

Figure 60: Europe Market Value Share (%) and BPS Analysis by Country, 2023 to 2033

Figure 61: Europe Market Y-o-Y Growth (%) Projections by Country, 2023 to 2033

Figure 62: Europe Market Value (US$ Million) Analysis by End-user, 2018 to 2033

Figure 63: Europe Market Volume (Units) Analysis by End-user, 2018 to 2033

Figure 64: Europe Market Value Share (%) and BPS Analysis by End-user, 2023 to 2033

Figure 65: Europe Market Y-o-Y Growth (%) Projections by End-user, 2023 to 2033

Figure 66: Europe Market Value (US$ Million) Analysis by Distribution Channel, 2018 to 2033

Figure 67: Europe Market Volume (Units) Analysis by Distribution Channel, 2018 to 2033

Figure 68: Europe Market Value Share (%) and BPS Analysis by Distribution Channel, 2023 to 2033

Figure 69: Europe Market Y-o-Y Growth (%) Projections by Distribution Channel, 2023 to 2033

Figure 70: Europe Market Attractiveness by End-user, 2023 to 2033

Figure 71: Europe Market Attractiveness by Distribution Channel, 2023 to 2033

Figure 72: Europe Market Attractiveness by Country, 2023 to 2033

Figure 73: Asia Pacific Market Value (US$ Million) by End-user, 2023 to 2033

Figure 74: Asia Pacific Market Value (US$ Million) by Distribution Channel, 2023 to 2033

Figure 75: Asia Pacific Market Value (US$ Million) by Country, 2023 to 2033

Figure 76: Asia Pacific Market Value (US$ Million) Analysis by Country, 2018 to 2033

Figure 77: Asia Pacific Market Volume (Units) Analysis by Country, 2018 to 2033

Figure 78: Asia Pacific Market Value Share (%) and BPS Analysis by Country, 2023 to 2033

Figure 79: Asia Pacific Market Y-o-Y Growth (%) Projections by Country, 2023 to 2033

Figure 80: Asia Pacific Market Value (US$ Million) Analysis by End-user, 2018 to 2033

Figure 81: Asia Pacific Market Volume (Units) Analysis by End-user, 2018 to 2033

Figure 82: Asia Pacific Market Value Share (%) and BPS Analysis by End-user, 2023 to 2033

Figure 83: Asia Pacific Market Y-o-Y Growth (%) Projections by End-user, 2023 to 2033

Figure 84: Asia Pacific Market Value (US$ Million) Analysis by Distribution Channel, 2018 to 2033

Figure 85: Asia Pacific Market Volume (Units) Analysis by Distribution Channel, 2018 to 2033

Figure 86: Asia Pacific Market Value Share (%) and BPS Analysis by Distribution Channel, 2023 to 2033

Figure 87: Asia Pacific Market Y-o-Y Growth (%) Projections by Distribution Channel, 2023 to 2033

Figure 88: Asia Pacific Market Attractiveness by End-user, 2023 to 2033

Figure 89: Asia Pacific Market Attractiveness by Distribution Channel, 2023 to 2033

Figure 90: Asia Pacific Market Attractiveness by Country, 2023 to 2033

Figure 91: MEA Market Value (US$ Million) by End-user, 2023 to 2033

Figure 92: MEA Market Value (US$ Million) by Distribution Channel, 2023 to 2033

Figure 93: MEA Market Value (US$ Million) by Country, 2023 to 2033

Figure 94: MEA Market Value (US$ Million) Analysis by Country, 2018 to 2033

Figure 95: MEA Market Volume (Units) Analysis by Country, 2018 to 2033

Figure 96: MEA Market Value Share (%) and BPS Analysis by Country, 2023 to 2033

Figure 97: MEA Market Y-o-Y Growth (%) Projections by Country, 2023 to 2033

Figure 98: MEA Market Value (US$ Million) Analysis by End-user, 2018 to 2033

Figure 99: MEA Market Volume (Units) Analysis by End-user, 2018 to 2033

Figure 100: MEA Market Value Share (%) and BPS Analysis by End-user, 2023 to 2033

Figure 101: MEA Market Y-o-Y Growth (%) Projections by End-user, 2023 to 2033

Figure 102: MEA Market Value (US$ Million) Analysis by Distribution Channel, 2018 to 2033

Figure 103: MEA Market Volume (Units) Analysis by Distribution Channel, 2018 to 2033

Figure 104: MEA Market Value Share (%) and BPS Analysis by Distribution Channel, 2023 to 2033

Figure 105: MEA Market Y-o-Y Growth (%) Projections by Distribution Channel, 2023 to 2033

Figure 106: MEA Market Attractiveness by End-user, 2023 to 2033

Figure 107: MEA Market Attractiveness by Distribution Channel, 2023 to 2033

Figure 108: MEA Market Attractiveness by Country, 2023 to 2033

Recommendations

Consumer Product

Hiking Backpacks Market

Published : March 2023

Travel and Tourism

Global Backpacker Gears Market

Published : October 2022

Industrial Automation

Military Hydration Products Market

Published : March 2022

Explore Consumer Product Insights

View Reports

Hydration Backpack Market