
- Market Size (2026)
- USD 10.6 Bn
- Forecast (2036)
- USD 21.8 Bn
- CAGR (2026 to 2036)
- 7.5%
How big is the Hydration Boosters Market in 2026?
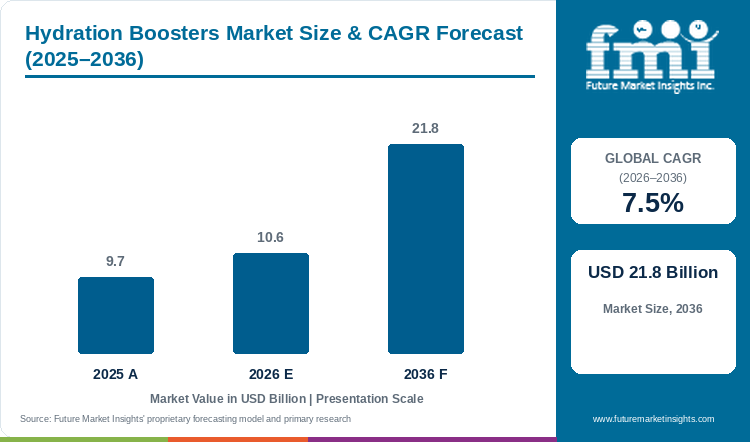
The Hydration Boosters Market is projected to reach USD 21.8 billion by 2036, growing at a 7.5% CAGR from 2026 to 2036.
FMI estimates the market at USD 10.6 billion in 2026, after it was valued at USD 9.7 billion in 2025. US sales of powdered mixes grew 20.0% in 2024 to about USD 1.5 billion according to Circana. The market covers powders, concentrates, gels and tablets that consumers add to water. Ready-to-drink electrolyte and sports drinks are adjacent substitutes and sit outside the market.
Compliance rules now decide how hydration products are named, taxed and claimed. The WHO low-osmolarity rehydration formula delivers 75 mmol of sodium per litre. It uses 2.6 g of sodium chloride and 2.9 g of trisodium citrate dihydrate per litre. The EU permits endurance claims only at 20 to 50 mmol of sodium per litre. India withdrew permission to use the term ORS in brand names on 14 October 2025. Australia cut the carbohydrate minimum for electrolyte drinks from 50 to 20 g per litre in 2022. Mexico raised its levy on flavoured drinks with added sugar from MXN 1.64 to 3.08 per litre for 2026. Each rule sets a formulation or label limit, so compliance cost rises with each country served.
Key Market Trends & Insights
- Hydration powders are moving beyond sports into daily use. Liquid I.V., acquired by Unilever in 2020, has quadrupled its business since and moved from sports recovery to office, travel and festival use, and its sugar-free energy mix, launched in August 2025, takes it into energy drinks. Brands are therefore widening claims from hydration to energy and focus.
- Large beverage groups are adding powders to sports drink portfolios. Gatorade reports that its enhancer sales grew 200.0% over four years. BodyArmor sells Flash I.V. Boosters as zero sugar electrolyte drink mix packets.
- Retail distribution is widening beyond specialty stores. Liquid I.V. expanded in Australia in November 2026 to Coles, WHSmith, Relay, 7-Eleven, Amazon and independent grocers, building on its 2024 launch through Chemist Warehouse and Costco, which places powders on mass-market shelves.
Regional Highlights
- In North America, the powdered drink category is large and fast-growing but crowded. The category leader and several large beverage groups all compete in powders.
- In Oceania, hydration is a growth category. Rehydration value sales in Australia grew more than 20.0% according to Nielsen data, driven by new buyers and more frequent purchases. Almost half of Australians regularly end the day without drinking enough water, according to commissioned research.
Hydration Boosters Market Size and Forecast
Table 1: Hydration Boosters Market Size and Forecast
| Market size and forecast | Value |
|---|---|
| Market size in 2025 | USD 9.7 billion |
| Estimated market size in 2026 | USD 10.6 billion |
| Projected market size by 2036 | USD 21.8 billion |
| CAGR from 2026 to 2036 | 7.5% |
Analyst Perspective
“Hydration boosters sell on convenience, taste and a wellness image that goes well beyond sport, and powder sticks win because they are light, last long and fit a bag or desk drawer. Brand strength and distribution decide results, since many products use similar electrolyte blends. Growth now depends on moving from hot-weather and sports use to everyday use while avoiding claims that exaggerate how many people are dehydrated, and large beverage companies and private label are the main competitive threat to independent brands.”
- Nandini Roy Choudhury, Principal Consultant, FMI
How is the Hydration Boosters Market segmented?
- By product type: Powders, Liquid Concentrates, Gels, Tablets and Effervescents, Others.
- By flavor: Citrus, Watermelon, Green Apple, Berries, Tropical and Others.
- By end use: General Hydration, Energy Boost, Immune Support, Skin Health, Others.
- By sales channel: Store-Based Retail, Online Retail.
- By region: North America, Latin America, Europe, East Asia, South Asia, Oceania, Middle East and Africa.
Why do Powders lead by Product Type in the Hydration Boosters Market in 2026?
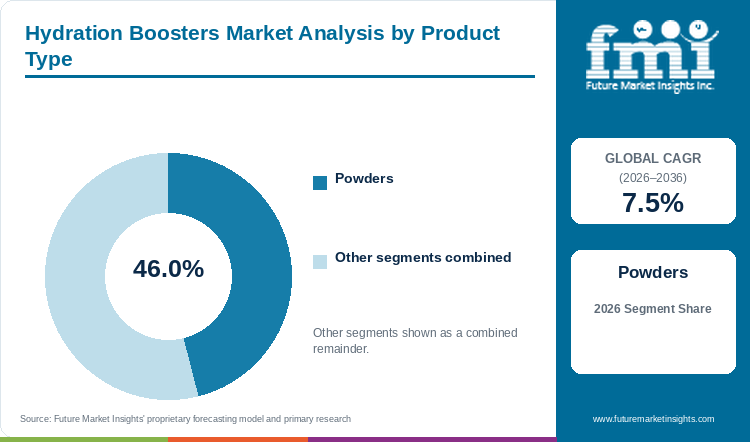
Powders hold 46.0% of the Hydration Boosters Market by product type in 2026.
Powders are light, long-lasting and easy to carry, and an industry analyst told CNN that convenience is the big factor. A powder can sit in a desk drawer or a gym bag without fridge space. Single-serve sticks also suit festivals and travel, which the category leader uses as a marketing route through event sponsorship. Liquid concentrates, gels, tablets and others hold the remaining 54.0%. Ready-to-drink electrolyte drinks such as Pedialyte and Electrolit are substitutes outside this market definition.
Table 2: Product Type, 2026 Share
| Leading Share | 2026 market share |
|---|---|
| Powders | 46.0% |
| All Other Segments Combined Share | 54.0% |
Source: Future Market Insights analysis of the hydration boosters market, 2026.
Why does Citrus lead by Flavor in the Hydration Boosters Market in 2026?
Citrus holds 38.0% of the Hydration Boosters Market by flavor in 2026.
Lemon, lime and orange are the citrus flavors that buyers link with freshness and with salt-and-lemon traditions in rehydration drinks. They anchor the ranges of leading brands. The category leader's Australian range starts with Lemon Lime, Watermelon, Strawberry, Tropical Punch and Passionfruit. Many buyers use boosters to make plain water more pleasant to drink, as a consumer goods analyst told CNN. Watermelon, apple, berries and tropical flavors hold the remaining 62.0%. Sugar-free ranges add flavors such as Mango Pineapple, Peach, Raspberry Melon and Raspberry Lemonade in Australia.
Table 3: Flavor, 2026 Share
| Leading Share | 2026 market share |
|---|---|
| Citrus | 38.0% |
| All Other Segments Combined Share | 62.0% |
Source: Future Market Insights analysis of the hydration boosters market, 2026.
Why does General Hydration lead by End Use in the Hydration Boosters Market in 2026?
General hydration accounts for 60.0% of the Hydration Boosters Market by end use in 2026.
Buyers now use these products daily as well as after exercise. The category leader's chief executive says its growth took off when it recognised that hydration is not just for athletes. Research commissioned by the company found that 93.0% of Australian adults see hydration as important for health. Energy, immune, skin and other uses hold the remaining 40.0%.
Table 4: End Use, 2026 Share
| Leading Share | 2026 market share |
|---|---|
| General Hydration | 60.0% |
| All Other Segments Combined Share | 40.0% |
Source: Future Market Insights analysis of the hydration boosters market, 2026.
Why does Store-Based Retail lead by Sales Channel in the Hydration Boosters Market in 2026?
Store-based retail accounts for 57.0% of the Hydration Boosters Market by sales channel in 2026.
Hydration sticks are impulse and routine purchases, and brands have invested in grocery, club and convenience placement. Online retail holds the remaining 43.0%. The category leader launched in Germany and Spain through Amazon in July 2026, and Amazon is also part of the Australian rollout.
Table 5: Sales Channel, 2026 Share
| Leading Share | 2026 market share |
|---|---|
| Store-Based Retail | 57.0% |
| All Other Segments Combined Share | 43.0% |
Source: Future Market Insights analysis of the hydration boosters market, 2026.
What are the key drivers, restraints and opportunities?
Driver
Everyday wellness use and double-digit category growth. US powdered mixes have posted double-digit growth for four straight years, according to Circana, which shows hydration becoming a daily wellness habit.
Gen Z and millennial preference for drink enhancers. Liquid drink enhancers lead unit sales growth for Gen Z in the beverage category and rank second for millennials, according to Circana, and these younger buyers use powders to flavour water and replace sugary drinks.
Restraint
Weak evidence that most people need electrolyte products. A senior sports nutritionist told CNN that chronic dehydration is probably overstated for people with ready access to water and that less active people probably do not need electrolyte powders, so health authorities and regulators may challenge strong claims.
Low barriers to entry and price competition. A consumer goods analyst told CNN that anyone can produce an electrolyte powder and that fast followers emerge when one brand succeeds. More competition pushes up marketing costs and lowers price per serving.
Opportunity
Energy and functional blends. The category leader's sugar-free energy mix aims at the energy drink market. Circana says energy enhancers lead growth across all generations. Combined hydration and energy products can therefore win buyers from canned energy drinks.
International expansion. The category leader reached 15 markets after its July 2026 European launches. Brands with proven formats can enter markets where the category is newer.
Hydration Boosters Market by Country (2026 to 2036)
Table 6: Hydration Boosters Market Country Growth Forecast
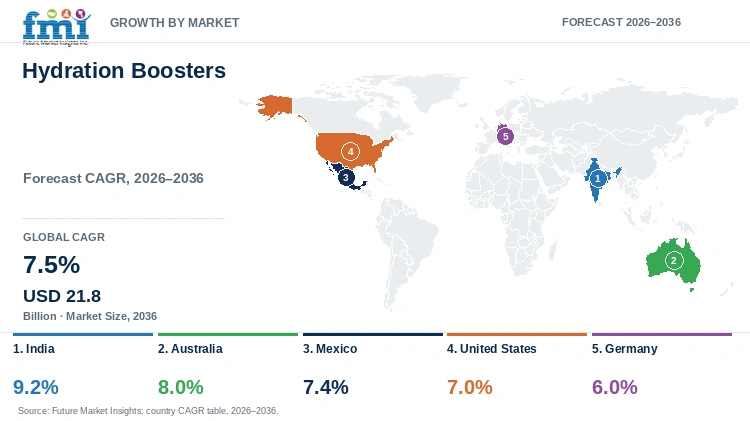
| Country | CAGR, 2026 to 2036 |
|---|---|
| India | 9.2% |
| Australia | 8.0% |
| Mexico | 7.4% |
| United States | 7.0% |
| Germany | 6.0% |
Source: Future Market Insights analysis of the hydration boosters market, 2026.
India
India is the fastest-growing profiled market from a small base, as hot weather, rising incomes and a large oral rehydration tradition support demand for flavoured and branded sachets, while local brands compete on price against imports. That supports a projected 9.2% CAGR for 2026 to 2036.
Heat sets the timing of demand. The India Meteorological Department recorded a 2025 mean land temperature 0.28°C above the 1991 to 2020 average. The decade 2016 to 2025 was the warmest on record. Heat waves hit western India from 10 to 15 March 2025. Rajasthan and Gujarat then logged 6 to 11 heat wave days in April.
Labelling law supplies the second driver. FSSAI, India's food regulator, withdrew its permissions to use the term ORS in brand names on 14 October 2025. Only WHO-formula products can now use the ORS name, so flavoured drinks must compete as electrolyte products. The WHO low-osmolarity formula carries 75 mmol of sodium per litre. An Indian Journal of Medical Research review states that flavoured electrolyte drinks are not ORS. Foreign powder brands are also entering the market. On 4 June 2026 Hindustan Unilever launched the category leader's sugar-free range in India after its 2025 debut. It sells through the brand website, e-commerce and quick-commerce platforms and select retail channels.
Australia
Australia is a fast-growing market in Oceania, where new buyers and more frequent purchases are lifting rehydration sales. Wider distribution by the category leader in November 2026 supports an 8.0% CAGR for 2026 to 2036.
The compositional rule is the main driver. Food Standards Australia New Zealand (FSANZ) regulates electrolyte drinks by composition. It cut the minimum carbohydrate from 50 to 20 g per litre. A 500 ml serve therefore needs 10 g of carbohydrate instead of 25 g. The regulator also capped fructose at 50% of total carbohydrate and allowed 24 months from gazettal to comply. FSANZ intended the change to let manufacturers develop healthier options. Powders made up to 20 g of carbohydrate per litre now qualify as electrolyte drink bases.
Claims are tightly limited. FSANZ prohibited health claims on electrolyte drinks except three pre-approved ones. Those apply only to drinks of 200 to 340 mOsm/kg and to strenuous activity of at least 60 minutes. Nutrition content claims are limited to carbohydrate, sugar, energy and electrolytes. Competitive advantage therefore rests on distribution and price, not on benefit language. FSANZ reported in 2022 that Codex, the EU and the United States have no commodity standard for electrolyte drinks. Australian brands therefore compete inside a defined product class. The category leader widened its national retail network in November 2026 to include Coles, 7-Eleven and Amazon.
Mexico
Hot weather and a strong rehydration culture support demand for powders in Mexico. An excise tax on sugared drinks also shapes formulation and supports a 7.4% CAGR forecast for 2026 to 2036.
Tax policy explains Mexico's position. Mexico's IEPS excise tax on flavoured drinks with added sugar rises from MXN 1.64 to 3.08 per litre. It applies from the start of 2026. That is an increase of MXN 1.44 per litre or 87.8%. A 600 ml bottle now carries MXN 1.85 of tax against MXN 0.98 before. Drinks with added sweeteners instead pay MXN 1.50 per litre, which is MXN 1.58 or 51.3% below the sugar rate. The lower rate rewards reformulation with sweeteners, so reformulation has a direct price effect. A 2 litre bottle carries MXN 6.16 of tax if sugared and MXN 3.00 if sweetened. The soft drink industry agreed with government to continue reformulating and to launch new pack sizes.
The exemption shapes channel strategy. Oral serums made only of anhydrous glucose, sodium chloride, potassium chloride and trisodium citrate stay outside the levy. Those four ingredients are the WHO formula. The exemption therefore turns on formula and not on brand. Mexico enforces the WHO benchmark through tax, and India enforces it through product naming. Flavoured lines therefore face higher shelf prices than untaxed WHO-formula serums.
United States
The United States is the base for the powder format that leads sales. A high base and many competitors hold growth to a 7.0% CAGR for 2026 to 2036.
Water already dominates US drinking, which limits the pool of new users. A national health survey shows water supplied 57.3% of adult nonalcoholic beverage intake by weight in 2021 to 2023. In 2013 to 2014 the share was 46.9%. Sweetened beverages fell from 14.9% to 11.2% over the same period. Water gained 10.4 percentage points of share while sweetened beverages lost 3.7 percentage points. Powders that flavour water address a habit that has already formed. Growth therefore depends on price and mix, not on new drinkers.
Entry barriers are low. FSANZ reported in 2022 that the United States has no commodity standard for electrolyte or sports drinks. Any brand can therefore set its own sodium and sugar levels, which keeps entry costs low and pricing power weak. The only US reference FSANZ cites is an American College of Sports Medicine position on fluid replacement. Incumbents also defend shelf space. PepsiCo reported higher 2026 US sales and wider distribution for its Gatorade and Propel hydration powders. It had removed artificial flavors and colors from both. Independent powder brands therefore compete for the same shelf space as established beverage groups.
Germany
Germany is a mature European market with strong pharmacy and drugstore channels and cautious regulation of health claims, and branded powders compete with private label. Germany is projected to grow at a 6.0% CAGR from 2026 to 2036.
Mineral water is the incumbent hydration product in Germany. The mineral water association VDM reports 2025 mineral and medicinal water sales of 10.2 billion litres, up 2.4%. Consumption reached 128.8 litres per person, and still mineral water grew 6.1%. That equals about 0.35 litres per person per day. A Kantar survey for the VDM found 90% choose mineral water for conscious nutrition and 89% for purity. Boosters must therefore justify a premium over a trusted product.
EU claim rules narrow the argument. The EU lists two claims for carbohydrate-electrolyte solutions, on endurance and water absorption. Both apply only to solutions with 80 to 350 kcal per litre from carbohydrates. They also require 20 to 50 mmol of sodium per litre and 200 to 330 mOsm/kg of osmolality. A low-sugar powder below 80 kcal per litre cannot use them. German brands therefore compete on taste, price and retail placement. In July 2026 the category leader entered Germany with its Hydration Multiplier and Sugar Free ranges. Germany launches through Amazon alone, one of five European launches that month.
Who are the notable companies in the Hydration Boosters Market?
Notable companies in the Hydration Boosters Market include Unilever, Coca-Cola, PepsiCo, Nestlé and Drink LMNT, Inc.
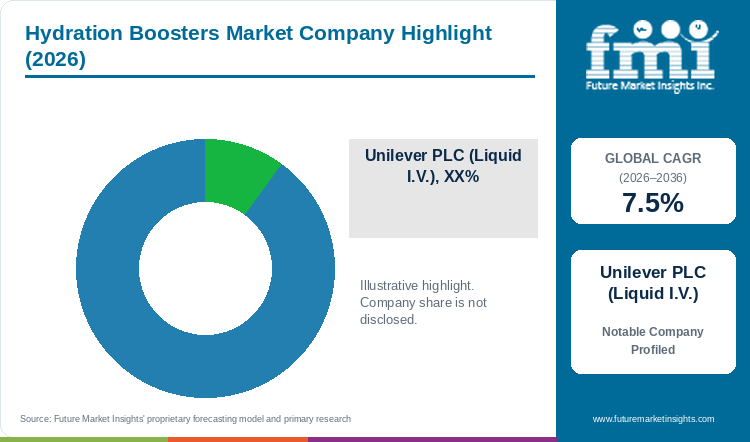
Suppliers differ most in shelf access and in the sugar content of their mixes. Liquid I.V., owned by Unilever, describes itself as the number one US powdered hydration brand. It has quadrupled its business since the 2020 acquisition. In July 2026 it launched in Spain, Germany, France, Sweden and Iceland through Amazon and Costco. It reports 15 clinical studies behind its formulations, including a sugar-free range. Drink LMNT, Inc.competes as a diet-friendly startup in portable electrolyte mixes.
Coca-Cola and PepsiCo reach the powder format through BodyArmor and Gatorade. BodyArmor sells Flash I.V. Boosters as zero sugar electrolyte drink mix packets in seven flavours. PepsiCo reported higher 2026 US sales and wider distribution for Gatorade and Propel powders. Its range includes Gatorade Zero Powder, Gatorlyte Powder and Propel Immune Support and Boost varieties. A consumer goods analyst told CNN that anyone can produce an electrolyte powder and that fast followers emerge when one brand succeeds.
Nuun sells electrolyte tablets and powders. Nestlé bought the supplement assets in 2021. In September 2026 Nestlé agreed to sell its Holistic Health portfolio to Yellow Wood Partners for about USD 1.0 billion. The portfolio includes Nuun. The transaction needs regulatory approval and is expected to close by the first half of 2027. The brand changes owner once the transaction closes.
Key Developments in the Hydration Boosters Market
- In November 2026, PepsiCo, Inc. reported higher US sales and wider distribution for its Gatorade and Propel hydration powders after removing artificial flavors and colors from both ranges. The updated line includes Gatorade Zero Powder and Gatorlyte Powder alongside new Propel Immune Support and Boost varieties [20].
- In September 2026, Nestlé S.A. agreed to divest its mainstream Vitamins, Minerals and Supplements business, the Holistic Health portfolio, to Yellow Wood Partners for USD 1.0 billion. The scope of the transaction includes seven brands, among them the Nuun hydration range, and the transaction is subject to applicable regulatory approvals with closing expected by the first half of 2027 [21].
- In July 2026, Unilever PLC launched its Liquid I.V. powdered hydration brand in Spain, Germany, France, Sweden and Iceland, bringing the brand to 15 global markets. Germany and Spain launched through Amazon, and Spain, France, Sweden and Iceland also launched through Costco [22].
Key Players in the Hydration Boosters Market
- Unilever PLC (Liquid I.V.)
- The Coca-Cola Company (BodyArmor)
- PepsiCo, Inc. (Gatorade)
- Nestlé S.A. (Nuun)
- Drink LMNT, Inc.
Hydration Boosters Market Report Scope
Table 7: Hydration Boosters Market Report Scope
| Coverage field | Report scope |
|---|---|
| Market definition | Electrolyte and hydration enhancement products sold as powders, liquid concentrates, gels, tablets and other formats that are added to water. They are valued at manufacturer selling prices. Ready-to-drink electrolyte and sports drinks, bottled flavoured water, energy drinks and pharmaceutical rehydration salts are excluded and treated as adjacent substitutes. |
| Product Type | Powders; Liquid Concentrates; Gels; Tablets and Effervescents; Others |
| Flavor | Citrus; Watermelon; Green Apple; Berries; Tropical and Others |
| End Use | General Hydration; Energy Boost; Immune Support; Skin Health; Others |
| Sales Channel | Store-Based Retail; Online Retail |
| Regions and profiled countries | North America, Latin America, Europe, East Asia, South Asia, Oceania, Middle East and Africa |
| Companies covered | Unilever PLC (Liquid I.V.); The Coca-Cola Company (BodyArmor); PepsiCo, Inc. (Gatorade); Nestlé S.A. (Nuun); Drink LMNT, Inc. |
| Quantitative Units | USD billion |
Hydration Boosters Market by Segments
Hydration Boosters Market segmented by Product Type:
- Powders
- Liquid Concentrates
- Gels
- Tablets and Effervescents
- Others
Hydration Boosters Market segmented by Flavor:
- Citrus
- Watermelon
- Green Apple
- Berries
- Tropical and Others
Hydration Boosters Market segmented by End Use:
- General Hydration
- Energy Boost
- Immune Support
- Skin Health
- Others
Hydration Boosters Market segmented by Sales Channel:
- Store-Based Retail
- Online Retail
Hydration Boosters Market by Region
- North America
- Latin America
- Europe
- East Asia
- South Asia
- Oceania
- Middle East
- Africa
- India
- Australia
- Mexico
- United States
- Germany
Research Sources and Bibliography
- [1] CNN Business. (2025, May 24). How America's obsession with staying hydrated became a $1.5 billion business. https://www.cnn.com/2025/05/24/food/hydration-electrolytes-drinks-popularity
- [2] Fast Company. (2025, August 25). Energy drinks are booming, and Liquid I.V. wants a piece of the action. https://www.fastcompany.com/91391290/liquid-iv-energy-drink
- [3] Inside FMCG. (2026, November 3). Liquid IV expands Australian retail footprint amid hydration boom. https://insidefmcg.com.au/2026/11/03/liquid-iv-expands-australian-retail-footprint-amid-hydration-boom/
- [4] FoodNavigator. (2025, October 29). 'A national shame': FSSAI embroiled in fight over ORS label misuse. https://www.foodnavigator.com/Article/2025/10/29/a-national-shame-fssai-embroiled-in-fight-over-ors-label-misuse/
- [5] European Commission. (2012, May 16). Commission Regulation (EU) No 432/2012 establishing a list of permitted health claims made on foods, other than those referring to the reduction of disease risk and to children's development and health. https://eur-lex.europa.eu/legal-content/EN/TXT/HTML/?uri=CELEX:32012R0432
- [6] Food Standards Australia New Zealand. (2022, June 22). Approval Report, Proposal P1030: Composition and Labelling of Electrolyte Drinks. https://www.foodstandards.gov.au/sites/default/files/food-standards-code/proposals/Documents/P1030%20Approval%20Report.pdf
- [7] El Economista. (2025, October 17). Suben impuestos a bebidas con azúcar y moderan IEPS a bebidas light y cero (in Spanish). https://www.eleconomista.com.mx/economia/suben-impuestos-bebidas-azucar-moderan-ieps-bebidas-light-cero-20251017-782247.html
- [8] Expansión. (2025, November 25). Lo que subirá de precio en 2026: impuestos nuevos, ajustes y quién pagará más (in Spanish). https://expansion.mx/finanzas-personales/2025/11/25/nuevos-impuestos-2026-que-encareceran-productos-servicios
- [9] India Meteorological Department. (2026, March 31). Annual Report 2025. https://metnet.imd.gov.in/docs/imdnews/ANNUAL_REPORT2025English.pdf
- [10] National Center for Health Statistics. (2026, September 2). Nonalcoholic Beverage Consumption Among Youth and Adults: United States, August 2021 to August 2023. NCHS Data Brief No. 568. https://www.cdc.gov/nchs/data/databriefs/db568.pdf
- [11] Verband Deutscher Mineralbrunnen. (2026, January 27). Mineralwasser-Absatz steigt 2025 deutlich (in German). https://www.vdm-bonn.de/presse/pressemitteilungen/mineralwasser-absatz-steigt-2025-deutlich/
- [12] Patwari, A. K. (2026). ORS: from choir to solo. Indian Journal of Medical Research, 164, 1-4. https://pmc.ncbi.nlm.nih.gov/articles/PMC13363002/
- [13] USAID Global Health Supply Chain Program. (2019). Manual for Procurement and Supply of Quality-Assured MNCH Commodities, Module: Oral Rehydration. https://www.ghsupplychain.org/sites/default/files/2019-02/MNCH%20Commodities-OralRehydration.pdf
- [14] Food and Drink Technology. (2026, July 3). Liquid I.V. powers the rise of powdered hydration. https://www.foodanddrinktechnology.com/news/68346/liquid-i-v-powers-the-rise-of-powdered-hydration/
- [15] PepsiCo. (2026, November 3). Hydration powders: PepsiCo expands personalized hydration throughout the day. https://www.pepsico.com/newsroom/stories/2026/pepsico-hydration-powders-gatorade-propel-gatorlyte
- [16] The Wire / PTI. (2026, June 4). Liquid I.V. expands its hydration portfolio in India with the launch of sugar-free range.
- [17] Just Food. (2026, September 2). Nestlé to sell "mainstream" supplements business for $1bn. https://www.just-food.com/news/nestle-to-sell-mainstream-supplements-business-for-1bn/
- [18] BODYARMOR. Flash I.V. Boosters: Zero Sugar Electrolyte Drink Mix Packets. https://www.drinkbodyarmor.com/flash-iv-sticks
- [19] Nuun and Company, Inc. Nuun Hydration: Electrolyte Tablets and Hydration Powders. https://nuunlife.com/
- [20] PepsiCo, Inc. (2026, November 3). Hydration powders: PepsiCo expands personalized hydration throughout the day. https://www.pepsico.com/newsroom/stories/2026/pepsico-hydration-powders-gatorade-propel-gatorlyte
- [21] Nestlé S.A. (2026, September 1). Nestlé reaches agreement to divest its mainstream vitamins, minerals and supplements business. https://www.nestlehealthscience.us/stories/nestle-reaches-agreement-divest-its-mainstream-vitamins-minerals-and-supplements-business
- [22] Liquid I.V. (2026, July 2). Liquid I.V. expands across Europe, powering the global rise of powdered hydration. PR Newswire. https://www.prnewswire.co.uk/news-releases/liquid-iv-expands-across-europe-powering-the-global-rise-of-powdered-hydration-302813358.html
Table of Content
- Key Takeaways
- Market Size and CAGR
- Top Growth Driver
- Fastest Growing Segment
- Leading Region
- Key Companies
- Emerging Opportunities
- Executive Summary
- Global Market Outlook
- Demand-side Trends
- Supply-side Trends
- Technology Roadmap Analysis
- Analysis and Recommendations
- Analyst Perspective (What is happening? Why now? What should investors know?)
- Key Questions Answered
- How large is the market?
- What is the CAGR?
- What are key trends?
- Which region dominates?
- Who are the leaders?
Read More...
- Market Overview
- Market Coverage / Taxonomy
- Market Definition / Scope / Limitations
- Research Methodology
- Chapter Orientation
- Analytical Lens and Working Hypotheses
- Market Structure, Signals, and Trend Drivers
- Benchmarking and Cross-market Comparability
- Market Sizing, Forecasting, and Opportunity Mapping
- Research Design and Evidence Framework
- Desk Research Programme (Secondary Evidence)
- Expert Input and Fieldwork (Primary Evidence)
- Tooling, Models, and Reference Databases
- Data Engineering and Model Build
- Quality Assurance and Audit Trail
- Market Background
- Market Dynamics (Drivers, Restraints, Opportunity, Trends)
- Scenario Forecast (Optimistic, Likely, Conservative)
- Impact Analysis
- AI Impact
- Sustainability Impact
- Regulatory Impact
- Technology Impact
- Consumer / Buyer Analysis
- Purchase Drivers
- Adoption Barriers
- Buyer Journey
- Opportunity Map Analysis
- Product Life Cycle Analysis
- Supply Chain Analysis
- Investment Feasibility Matrix
- Value Chain Analysis
- PESTLE and Porter's Analysis
- Regulatory Landscape
- Regional Parent Market Outlook
- Production and Consumption Statistics
- Import and Export Statistics
- Global Market Analysis and Forecast, 2021 to 2036
- Historical Market Size Value (USD Billion) Analysis, 2021 to 2025
- Current and Future Market Size Value (USD Billion) Projections, 2026 to 2036
- Y-o-Y Growth Trend Analysis
- Absolute $ Opportunity Analysis
- Global Market Pricing Analysis, 2021 to 2036
- Global Market Analysis and Forecast, By Product Type, 2021 to 2036
- Introduction / Key Findings
- Historical Market Size Value (USD Billion) Analysis By Product Type, 2021 to 2025
- Current and Future Market Size Value (USD Billion) Analysis and Forecast By Product Type, 2026 to 2036
- Powders
- Liquid Concentrates
- Gels
- Tablets and Effervescents
- Others
- Y-o-Y Growth Trend Analysis By Product Type, 2021 to 2025
- Absolute $ Opportunity Analysis By Product Type, 2026 to 2036
- Global Market Analysis and Forecast, By Flavor, 2021 to 2036
- Introduction / Key Findings
- Historical Market Size Value (USD Billion) Analysis By Flavor, 2021 to 2025
- Current and Future Market Size Value (USD Billion) Analysis and Forecast By Flavor, 2026 to 2036
- Citrus
- Watermelon
- Green Apple
- Berries
- Tropical and Others
- Y-o-Y Growth Trend Analysis By Flavor, 2021 to 2025
- Absolute $ Opportunity Analysis By Flavor, 2026 to 2036
- Global Market Analysis and Forecast, By End Use, 2021 to 2036
- Introduction / Key Findings
- Historical Market Size Value (USD Billion) Analysis By End Use, 2021 to 2025
- Current and Future Market Size Value (USD Billion) Analysis and Forecast By End Use, 2026 to 2036
- General Hydration
- Energy Boost
- Immune Support
- Skin Health
- Others
- Y-o-Y Growth Trend Analysis By End Use, 2021 to 2025
- Absolute $ Opportunity Analysis By End Use, 2026 to 2036
- Global Market Analysis and Forecast, By Sales Channel, 2021 to 2036
- Introduction / Key Findings
- Historical Market Size Value (USD Billion) Analysis By Sales Channel, 2021 to 2025
- Current and Future Market Size Value (USD Billion) Analysis and Forecast By Sales Channel, 2026 to 2036
- Store-Based Retail
- Online Retail
- Y-o-Y Growth Trend Analysis By Sales Channel, 2021 to 2025
- Absolute $ Opportunity Analysis By Sales Channel, 2026 to 2036
- Global Market Analysis and Forecast, By Region, 2021 to 2036
- Introduction
- Historical Market Size Value (USD Billion) Analysis By Region, 2021 to 2025
- Current Market Size Value (USD Billion) Analysis and Forecast By Region, 2026 to 2036
- North America
- Latin America
- Europe
- East Asia
- South Asia
- Oceania
- Middle East
- Africa
- Market Attractiveness Analysis By Region
- North America Market Analysis and Forecast, By Country, 2021 to 2036
- Historical Market Size Value (USD Billion) Trend Analysis By Market Taxonomy, 2021 to 2025
- Market Size Value (USD Billion) Forecast By Market Taxonomy, 2026 to 2036
- By Country
- By Product Type
- By Flavor
- By End Use
- By Sales Channel
- Market Attractiveness Analysis
- By Country
- By Product Type
- By Flavor
- By End Use
- By Sales Channel
- Key Takeaways
- Latin America Market Analysis and Forecast, By Country
- Historical Market Size Value (USD Billion) Trend Analysis By Market Taxonomy, 2021 to 2025
- Market Size Value (USD Billion) Forecast By Market Taxonomy, 2026 to 2036
- By Country
- By Product Type
- By Flavor
- By End Use
- By Sales Channel
- Market Attractiveness Analysis
- By Country
- By Product Type
- By Flavor
- By End Use
- By Sales Channel
- Key Takeaways
- Europe Market Analysis and Forecast, By Country
- Historical Market Size Value (USD Billion) Trend Analysis By Market Taxonomy, 2021 to 2025
- Market Size Value (USD Billion) Forecast By Market Taxonomy, 2026 to 2036
- By Country
- By Product Type
- By Flavor
- By End Use
- By Sales Channel
- Market Attractiveness Analysis
- By Country
- By Product Type
- By Flavor
- By End Use
- By Sales Channel
- Key Takeaways
- East Asia Market Analysis and Forecast, By Country
- Historical Market Size Value (USD Billion) Trend Analysis By Market Taxonomy, 2021 to 2025
- Market Size Value (USD Billion) Forecast By Market Taxonomy, 2026 to 2036
- By Country
- By Product Type
- By Flavor
- By End Use
- By Sales Channel
- Market Attractiveness Analysis
- By Country
- By Product Type
- By Flavor
- By End Use
- By Sales Channel
- Key Takeaways
- South Asia Market Analysis and Forecast, By Country
- Historical Market Size Value (USD Billion) Trend Analysis By Market Taxonomy, 2021 to 2025
- Market Size Value (USD Billion) Forecast By Market Taxonomy, 2026 to 2036
- By Country
- By Product Type
- By Flavor
- By End Use
- By Sales Channel
- Market Attractiveness Analysis
- By Country
- By Product Type
- By Flavor
- By End Use
- By Sales Channel
- Key Takeaways
- Oceania Market Analysis and Forecast, By Country
- Historical Market Size Value (USD Billion) Trend Analysis By Market Taxonomy, 2021 to 2025
- Market Size Value (USD Billion) Forecast By Market Taxonomy, 2026 to 2036
- By Country
- By Product Type
- By Flavor
- By End Use
- By Sales Channel
- Market Attractiveness Analysis
- By Country
- By Product Type
- By Flavor
- By End Use
- By Sales Channel
- Key Takeaways
- Middle East Market Analysis and Forecast, By Country
- Historical Market Size Value (USD Billion) Trend Analysis By Market Taxonomy, 2021 to 2025
- Market Size Value (USD Billion) Forecast By Market Taxonomy, 2026 to 2036
- By Country
- By Product Type
- By Flavor
- By End Use
- By Sales Channel
- Market Attractiveness Analysis
- By Country
- By Product Type
- By Flavor
- By End Use
- By Sales Channel
- Key Takeaways
- Africa Market Analysis and Forecast, By Country
- Historical Market Size Value (USD Billion) Trend Analysis By Market Taxonomy, 2021 to 2025
- Market Size Value (USD Billion) Forecast By Market Taxonomy, 2026 to 2036
- By Country
- India
- Australia
- Mexico
- United States
- Germany
- By Product Type
- By Flavor
- By End Use
- By Sales Channel
- By Country
- Market Attractiveness Analysis
- By Country
- By Product Type
- By Flavor
- By End Use
- By Sales Channel
- Key Takeaways
- Key Countries Market Analysis
- United States
- Pricing Analysis
- Market Share Analysis, 2025
- By Product Type
- By Flavor
- By End Use
- By Sales Channel
- Mexico
- Pricing Analysis
- Market Share Analysis, 2025
- By Product Type
- By Flavor
- By End Use
- By Sales Channel
- Germany
- Pricing Analysis
- Market Share Analysis, 2025
- By Product Type
- By Flavor
- By End Use
- By Sales Channel
- India
- Pricing Analysis
- Market Share Analysis, 2025
- By Product Type
- By Flavor
- By End Use
- By Sales Channel
- Australia
- Pricing Analysis
- Market Share Analysis, 2025
- By Product Type
- By Flavor
- By End Use
- By Sales Channel
- United States
- Market Structure Analysis
- Competition Dashboard
- Competition Benchmarking
- Market Share Analysis of Top Players
- By Regional
- By Product Type
- By Flavor
- By End Use
- By Sales Channel
- Emerging Startups
- Innovation Benchmarking
- Competition Analysis
- Competition Deep Dive
- Unilever PLC (Liquid I.V.)
- Overview
- Product Portfolio
- Profitability by Market Segments
- Sales Footprint
- Strategy Overview
- Marketing Strategy
- Product Strategy
- Channel Strategy
- The Coca-Cola Company (BodyArmor)
- PepsiCo, Inc. (Gatorade)
- Nestlé S.A. (Nuun)
- Drink LMNT, Inc.
- Unilever PLC (Liquid I.V.)
- Success Stories
- Recent Developments
- Competition Deep Dive
- Assumptions & Acronyms Used
List of Tables
- Table 1: Global Market Value (USD Billion) Forecast by Region, 2021 to 2036
- Table 2: Global Market Value (USD Billion) Forecast by Product Type, 2021 to 2036
- Table 3: Global Market Value (USD Billion) Forecast by Flavor, 2021 to 2036
- Table 4: Global Market Value (USD Billion) Forecast by End Use, 2021 to 2036
- Table 5: Global Market Value (USD Billion) Forecast by Sales Channel, 2021 to 2036
- Table 6: North America Market Value (USD Billion) Forecast by Country, 2021 to 2036
- Table 7: North America Market Value (USD Billion) Forecast by Product Type, 2021 to 2036
- Table 8: North America Market Value (USD Billion) Forecast by Flavor, 2021 to 2036
- Table 9: North America Market Value (USD Billion) Forecast by End Use, 2021 to 2036
- Table 10: North America Market Value (USD Billion) Forecast by Sales Channel, 2021 to 2036
- Table 11: Latin America Market Value (USD Billion) Forecast by Country, 2021 to 2036
- Table 12: Latin America Market Value (USD Billion) Forecast by Product Type, 2021 to 2036
- Table 13: Latin America Market Value (USD Billion) Forecast by Flavor, 2021 to 2036
- Table 14: Latin America Market Value (USD Billion) Forecast by End Use, 2021 to 2036
- Table 15: Latin America Market Value (USD Billion) Forecast by Sales Channel, 2021 to 2036
- Table 16: Europe Market Value (USD Billion) Forecast by Country, 2021 to 2036
- Table 17: Europe Market Value (USD Billion) Forecast by Product Type, 2021 to 2036
- Table 18: Europe Market Value (USD Billion) Forecast by Flavor, 2021 to 2036
- Table 19: Europe Market Value (USD Billion) Forecast by End Use, 2021 to 2036
- Table 20: Europe Market Value (USD Billion) Forecast by Sales Channel, 2021 to 2036
- Table 21: East Asia Market Value (USD Billion) Forecast by Country, 2021 to 2036
- Table 22: East Asia Market Value (USD Billion) Forecast by Product Type, 2021 to 2036
- Table 23: East Asia Market Value (USD Billion) Forecast by Flavor, 2021 to 2036
- Table 24: East Asia Market Value (USD Billion) Forecast by End Use, 2021 to 2036
- Table 25: East Asia Market Value (USD Billion) Forecast by Sales Channel, 2021 to 2036
- Table 26: South Asia Market Value (USD Billion) Forecast by Country, 2021 to 2036
- Table 27: South Asia Market Value (USD Billion) Forecast by Product Type, 2021 to 2036
- Table 28: South Asia Market Value (USD Billion) Forecast by Flavor, 2021 to 2036
- Table 29: South Asia Market Value (USD Billion) Forecast by End Use, 2021 to 2036
- Table 30: South Asia Market Value (USD Billion) Forecast by Sales Channel, 2021 to 2036
- Table 31: Oceania Market Value (USD Billion) Forecast by Country, 2021 to 2036
- Table 32: Oceania Market Value (USD Billion) Forecast by Product Type, 2021 to 2036
- Table 33: Oceania Market Value (USD Billion) Forecast by Flavor, 2021 to 2036
- Table 34: Oceania Market Value (USD Billion) Forecast by End Use, 2021 to 2036
- Table 35: Oceania Market Value (USD Billion) Forecast by Sales Channel, 2021 to 2036
- Table 36: Middle East Market Value (USD Billion) Forecast by Country, 2021 to 2036
- Table 37: Middle East Market Value (USD Billion) Forecast by Product Type, 2021 to 2036
- Table 38: Middle East Market Value (USD Billion) Forecast by Flavor, 2021 to 2036
- Table 39: Middle East Market Value (USD Billion) Forecast by End Use, 2021 to 2036
- Table 40: Middle East Market Value (USD Billion) Forecast by Sales Channel, 2021 to 2036
- Table 41: Africa Market Value (USD Billion) Forecast by Country, 2021 to 2036
- Table 42: Africa Market Value (USD Billion) Forecast by Product Type, 2021 to 2036
- Table 43: Africa Market Value (USD Billion) Forecast by Flavor, 2021 to 2036
- Table 44: Africa Market Value (USD Billion) Forecast by End Use, 2021 to 2036
- Table 45: Africa Market Value (USD Billion) Forecast by Sales Channel, 2021 to 2036
List of Figures
- Figure 1: Global Market Pricing Analysis
- Figure 2: Global Market Value (USD Billion) Forecast 2021-2036
- Figure 3: Global Market Value Share and BPS Analysis by Product Type, 2026 and 2036
- Figure 4: Global Market Y-o-Y Growth Comparison by Product Type, 2026-2036
- Figure 5: Global Market Attractiveness Analysis by Product Type
- Figure 6: Global Market Value Share and BPS Analysis by Flavor, 2026 and 2036
- Figure 7: Global Market Y-o-Y Growth Comparison by Flavor, 2026-2036
- Figure 8: Global Market Attractiveness Analysis by Flavor
- Figure 9: Global Market Value Share and BPS Analysis by End Use, 2026 and 2036
- Figure 10: Global Market Y-o-Y Growth Comparison by End Use, 2026-2036
- Figure 11: Global Market Attractiveness Analysis by End Use
- Figure 12: Global Market Value Share and BPS Analysis by Sales Channel, 2026 and 2036
- Figure 13: Global Market Y-o-Y Growth Comparison by Sales Channel, 2026-2036
- Figure 14: Global Market Attractiveness Analysis by Sales Channel
- Figure 15: Global Market Value (USD Billion) Share and BPS Analysis by Region, 2026 and 2036
- Figure 16: Global Market Y-o-Y Growth Comparison by Region, 2026-2036
- Figure 17: Global Market Attractiveness Analysis by Region
- Figure 18: North America Market Incremental Dollar Opportunity, 2026-2036
- Figure 19: Latin America Market Incremental Dollar Opportunity, 2026-2036
- Figure 20: Europe Market Incremental Dollar Opportunity, 2026-2036
- Figure 21: East Asia Market Incremental Dollar Opportunity, 2026-2036
- Figure 22: South Asia Market Incremental Dollar Opportunity, 2026-2036
- Figure 23: Oceania Market Incremental Dollar Opportunity, 2026-2036
- Figure 24: Middle East Market Incremental Dollar Opportunity, 2026-2036
- Figure 25: Africa Market Incremental Dollar Opportunity, 2026-2036
- Figure 26: North America Market Value Share and BPS Analysis by Country, 2026 and 2036
- Figure 27: North America Market Value Share and BPS Analysis by Product Type, 2026 and 2036
- Figure 28: North America Market Y-o-Y Growth Comparison by Product Type, 2026-2036
- Figure 29: North America Market Attractiveness Analysis by Product Type
- Figure 30: North America Market Value Share and BPS Analysis by Flavor, 2026 and 2036
- Figure 31: North America Market Y-o-Y Growth Comparison by Flavor, 2026-2036
- Figure 32: North America Market Attractiveness Analysis by Flavor
- Figure 33: North America Market Value Share and BPS Analysis by End Use, 2026 and 2036
- Figure 34: North America Market Y-o-Y Growth Comparison by End Use, 2026-2036
- Figure 35: North America Market Attractiveness Analysis by End Use
- Figure 36: North America Market Value Share and BPS Analysis by Sales Channel, 2026 and 2036
- Figure 37: North America Market Y-o-Y Growth Comparison by Sales Channel, 2026-2036
- Figure 38: North America Market Attractiveness Analysis by Sales Channel
- Figure 39: Latin America Market Value Share and BPS Analysis by Country, 2026 and 2036
- Figure 40: Latin America Market Value Share and BPS Analysis by Product Type, 2026 and 2036
- Figure 41: Latin America Market Y-o-Y Growth Comparison by Product Type, 2026-2036
- Figure 42: Latin America Market Attractiveness Analysis by Product Type
- Figure 43: Latin America Market Value Share and BPS Analysis by Flavor, 2026 and 2036
- Figure 44: Latin America Market Y-o-Y Growth Comparison by Flavor, 2026-2036
- Figure 45: Latin America Market Attractiveness Analysis by Flavor
- Figure 46: Latin America Market Value Share and BPS Analysis by End Use, 2026 and 2036
- Figure 47: Latin America Market Y-o-Y Growth Comparison by End Use, 2026-2036
- Figure 48: Latin America Market Attractiveness Analysis by End Use
- Figure 49: Latin America Market Value Share and BPS Analysis by Sales Channel, 2026 and 2036
- Figure 50: Latin America Market Y-o-Y Growth Comparison by Sales Channel, 2026-2036
- Figure 51: Latin America Market Attractiveness Analysis by Sales Channel
- Figure 52: Europe Market Value Share and BPS Analysis by Country, 2026 and 2036
- Figure 53: Europe Market Value Share and BPS Analysis by Product Type, 2026 and 2036
- Figure 54: Europe Market Y-o-Y Growth Comparison by Product Type, 2026-2036
- Figure 55: Europe Market Attractiveness Analysis by Product Type
- Figure 56: Europe Market Value Share and BPS Analysis by Flavor, 2026 and 2036
- Figure 57: Europe Market Y-o-Y Growth Comparison by Flavor, 2026-2036
- Figure 58: Europe Market Attractiveness Analysis by Flavor
- Figure 59: Europe Market Value Share and BPS Analysis by End Use, 2026 and 2036
- Figure 60: Europe Market Y-o-Y Growth Comparison by End Use, 2026-2036
- Figure 61: Europe Market Attractiveness Analysis by End Use
- Figure 62: Europe Market Value Share and BPS Analysis by Sales Channel, 2026 and 2036
- Figure 63: Europe Market Y-o-Y Growth Comparison by Sales Channel, 2026-2036
- Figure 64: Europe Market Attractiveness Analysis by Sales Channel
- Figure 65: East Asia Market Value Share and BPS Analysis by Country, 2026 and 2036
- Figure 66: East Asia Market Value Share and BPS Analysis by Product Type, 2026 and 2036
- Figure 67: East Asia Market Y-o-Y Growth Comparison by Product Type, 2026-2036
- Figure 68: East Asia Market Attractiveness Analysis by Product Type
- Figure 69: East Asia Market Value Share and BPS Analysis by Flavor, 2026 and 2036
- Figure 70: East Asia Market Y-o-Y Growth Comparison by Flavor, 2026-2036
- Figure 71: East Asia Market Attractiveness Analysis by Flavor
- Figure 72: East Asia Market Value Share and BPS Analysis by End Use, 2026 and 2036
- Figure 73: East Asia Market Y-o-Y Growth Comparison by End Use, 2026-2036
- Figure 74: East Asia Market Attractiveness Analysis by End Use
- Figure 75: East Asia Market Value Share and BPS Analysis by Sales Channel, 2026 and 2036
- Figure 76: East Asia Market Y-o-Y Growth Comparison by Sales Channel, 2026-2036
- Figure 77: East Asia Market Attractiveness Analysis by Sales Channel
- Figure 78: South Asia Market Value Share and BPS Analysis by Country, 2026 and 2036
- Figure 79: South Asia Market Value Share and BPS Analysis by Product Type, 2026 and 2036
- Figure 80: South Asia Market Y-o-Y Growth Comparison by Product Type, 2026-2036
- Figure 81: South Asia Market Attractiveness Analysis by Product Type
- Figure 82: South Asia Market Value Share and BPS Analysis by Flavor, 2026 and 2036
- Figure 83: South Asia Market Y-o-Y Growth Comparison by Flavor, 2026-2036
- Figure 84: South Asia Market Attractiveness Analysis by Flavor
- Figure 85: South Asia Market Value Share and BPS Analysis by End Use, 2026 and 2036
- Figure 86: South Asia Market Y-o-Y Growth Comparison by End Use, 2026-2036
- Figure 87: South Asia Market Attractiveness Analysis by End Use
- Figure 88: South Asia Market Value Share and BPS Analysis by Sales Channel, 2026 and 2036
- Figure 89: South Asia Market Y-o-Y Growth Comparison by Sales Channel, 2026-2036
- Figure 90: South Asia Market Attractiveness Analysis by Sales Channel
- Figure 91: Oceania Market Value Share and BPS Analysis by Country, 2026 and 2036
- Figure 92: Oceania Market Value Share and BPS Analysis by Product Type, 2026 and 2036
- Figure 93: Oceania Market Y-o-Y Growth Comparison by Product Type, 2026-2036
- Figure 94: Oceania Market Attractiveness Analysis by Product Type
- Figure 95: Oceania Market Value Share and BPS Analysis by Flavor, 2026 and 2036
- Figure 96: Oceania Market Y-o-Y Growth Comparison by Flavor, 2026-2036
- Figure 97: Oceania Market Attractiveness Analysis by Flavor
- Figure 98: Oceania Market Value Share and BPS Analysis by End Use, 2026 and 2036
- Figure 99: Oceania Market Y-o-Y Growth Comparison by End Use, 2026-2036
- Figure 100: Oceania Market Attractiveness Analysis by End Use
- Figure 101: Oceania Market Value Share and BPS Analysis by Sales Channel, 2026 and 2036
- Figure 102: Oceania Market Y-o-Y Growth Comparison by Sales Channel, 2026-2036
- Figure 103: Oceania Market Attractiveness Analysis by Sales Channel
- Figure 104: Middle East Market Value Share and BPS Analysis by Country, 2026 and 2036
- Figure 105: Middle East Market Value Share and BPS Analysis by Product Type, 2026 and 2036
- Figure 106: Middle East Market Y-o-Y Growth Comparison by Product Type, 2026-2036
- Figure 107: Middle East Market Attractiveness Analysis by Product Type
- Figure 108: Middle East Market Value Share and BPS Analysis by Flavor, 2026 and 2036
- Figure 109: Middle East Market Y-o-Y Growth Comparison by Flavor, 2026-2036
- Figure 110: Middle East Market Attractiveness Analysis by Flavor
- Figure 111: Middle East Market Value Share and BPS Analysis by End Use, 2026 and 2036
- Figure 112: Middle East Market Y-o-Y Growth Comparison by End Use, 2026-2036
- Figure 113: Middle East Market Attractiveness Analysis by End Use
- Figure 114: Middle East Market Value Share and BPS Analysis by Sales Channel, 2026 and 2036
- Figure 115: Middle East Market Y-o-Y Growth Comparison by Sales Channel, 2026-2036
- Figure 116: Middle East Market Attractiveness Analysis by Sales Channel
- Figure 117: Africa Market Value Share and BPS Analysis by Country, 2026 and 2036
- Figure 118: Africa Market Value Share and BPS Analysis by Product Type, 2026 and 2036
- Figure 119: Africa Market Y-o-Y Growth Comparison by Product Type, 2026-2036
- Figure 120: Africa Market Attractiveness Analysis by Product Type
- Figure 121: Africa Market Value Share and BPS Analysis by Flavor, 2026 and 2036
- Figure 122: Africa Market Y-o-Y Growth Comparison by Flavor, 2026-2036
- Figure 123: Africa Market Attractiveness Analysis by Flavor
- Figure 124: Africa Market Value Share and BPS Analysis by End Use, 2026 and 2036
- Figure 125: Africa Market Y-o-Y Growth Comparison by End Use, 2026-2036
- Figure 126: Africa Market Attractiveness Analysis by End Use
- Figure 127: Africa Market Value Share and BPS Analysis by Sales Channel, 2026 and 2036
- Figure 128: Africa Market Y-o-Y Growth Comparison by Sales Channel, 2026-2036
- Figure 129: Africa Market Attractiveness Analysis by Sales Channel
- Figure 130: Global Market - Tier Structure Analysis
- Figure 131: Global Market - Company Share Analysis
Frequently Asked Questions
How big is the Hydration Boosters Market in 2026?
FMI estimates the market at USD 10.6 billion in 2026, up from USD 9.7 billion in 2025. It is forecast to reach USD 21.8 billion by 2036 at a 7.5% CAGR.
Which product type leads the Hydration Boosters Market in 2026?
Powders lead with 46.0% by product type, while liquid concentrates, gels, tablets and others together hold 54.0%.
Which flavor is most popular?
Citrus leads with 38.0% by flavor in 2026, ahead of watermelon, green apple, berries and tropical flavors.
Which country is forecast to grow fastest through 2036?
India has the highest forecast CAGR among the profiled countries at 9.2% during 2026 to 2036, followed by Australia at 8.0%.
How big is the US powdered mix category?
Circana measured US powdered mixes at about USD 1.5 billion in 2024, up 20.0% [1].
Preview the report firsthand - request a free sample
Get SampleGet the brochure for pricing and purchase details.
Get PDF
