Hydrodesulfurization Catalyst Market
Market Insights on Hydrodesulfurization Catalyst covering sales outlook, demand forecast & up-to-date key trends
Hydrodesulfurization Catalyst Market by Type, Feedstock, End Use Industry & Region - Forecast 2022 – 2032
Hydrodesulfurization Catalyst Market Snapshot (2022-2032)
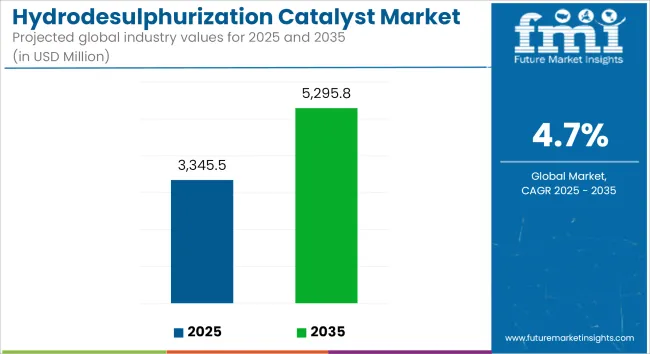
[297 Pages Report] Global Hydrodesulfurization Catalyst demand is anticipated to be valued at US$ 2.89 Billion in 2022, forecast to grow at a CAGR of 5% to be valued at US$ 4.71 Billion from 2022 to 2032.
The Hydrodesulfurization Catalyst enables the hydrotreating process in petroleum refineries and natural gas processing plants. Using the Hydrodesulfurization Catalyst, the hydrotreating process removes excess sulfur from the petroleum refining by-products.
Report Attribute |
Details |
Estimated Base Year Value (2021) |
US$ 2.76 Billion |
Expected Market Value (2022) |
US$ 2.89 Billion |
Anticipated Forecast Value (2032) |
US$ 4.71 Billion |
Projected Growth Rate (2022-2032) |
5% CAGR |
Traditionally, the market is driven by growing regulatory norms pertaining to the application of low sulfur fuels in the major regions of the world. Furthermore, there has been a major shift in the market demand for desulphurization catalysts owing to a positive move towards ultra-low sulfur (ULS) marine fuels, heating oils, and jet fuels.
Germany is considered to be a highly lucrative market for Hydrodesulfurization Catalyst, driven primarily by huge investments made by the refiners in order to upgrade and expand their units with advanced equipment and technologies. Furthermore, German manufacturers are focusing on producing cleaner automotive fuels while meeting the new sulfur emission regulations, such as Euro 4, Euro 5, and Euro 6 specifications and IMO 2020 mandate.
Catalysts used for the removal of sulfur are hydrodesulfurization catalysts. Ruthenium disulfide (RuS2) appears to be the single most active catalyst, but binary combinations of cobalt and molybdenum are also highly active. In practice, most HDS units in petroleum refineries use catalysts based on cobalt-modified molybdenum disulfide (MoS2) together with smaller amounts of other metals.
Let us know your requirement to get
100% FREE customization
Which are Some Prominent Drivers Spearheading Hydrodesulfurization Catalyst Market Growth?
Hydrodesulfurization Catalyst is of critical importance in the catalysis dependent process of hydrodesulfurization. Hydrodesulfurization Catalyst helps carry out the process of hydrodesulfurization effectively, thus helping meet regulatory specifications and environmental norms applicable to the refined petroleum products.
The removal of sulfur enabled by the Hydrodesulfurization Catalyst also prevents poisoning of the catalysts used in refinery processes further down the line after hydrodesulfurization. The market for Hydrodesulfurization Catalyst will witness growing demand in direct proportion to the increasing need of hydrodesulfurization (HDS) process for the production of low sulfur petroleum fuel and other refined products, in view of existing and impending regulatory mandates.
Governments and regulatory bodies, such as the European Union and the International Maritime Organization (IMO), have laid down stringent low sulfur content regulations for petroleum fuels, especially those used in the marine industry.
The IMO sulfur content cap to be applicable from January 2020 onwards has accelerated the need for sulfur removal capacity in refineries, thereby creating new opportunities for the Hydrodesulfurization Catalyst market. Thus, the market for Hydrodesulfurization Catalyst will continue to be driven primarily by demand from the refinery industries.
What are the Challenges Faced by the Hydrodesulfurization Catalyst Industry?
With the unprecedented outbreak of COVID-19, most of the manufacturing sites and factories had to shut down. This led to a significant decline in the demand for oil. Furthermore, a number of plants started running at reduced rates, hindering the market demand for hydrodesulfurization catalyst. This is the case with major economies of the world, especially in the U.S., China, Italy, France, Germany, the U.K., and India, which are some of the worst-hit economies.
In addition to this, the plunge in the demand for oil along with the dropping oil prices and investments in the sector are likely to leave the industry position crucial. The aforementioned pointers, in turn, will severely impact the market growth.
Find your sweet spots for generating winning opportunities in this market.
Talk to AnalystWhy is Asia-Pacific Emerging as an Opportunistic Hydrodesulfurization Catalyst Market?
The recent implementation of the International Maritime Organization (IMO) 2020 mandate worldwide aiming to reduce sulfur emissions from ocean vessels by 80% is expected to create significant growth opportunities for the market in Asia Pacific. Asia Pacific is projected to be a significant market for Hydrodesulfurization Catalyst and the trend is expected to continue into the forecast period owing to rapid demand in this region. The growing demand for refined petroleum products from the fast growing economies of the region will be a key driver of demand for the Hydrodesulfurization Catalyst market in Asia Pacific. According to the Oxford Institute for Energy Studies, China is expected to produce over 18 million tons of very-low-sulfur fuel oil (VLSFO) by 2020 and increase it to 30 million tons by 2023.
How is North America Contributing to Growth of the Hydrodesulfurization Catalyst Market?
According to Future Market Insights, North America is the largest regional market for hydrodesulfurization catalysts, accounting for a revenue share of 32%. The market is driven by the stringent regulations and restrictions related to the harmful effects of sulfur dioxide on human health and the environment. According to the norms laid by the U.S. EPA, ultra-low sulfur diesel with a maximum of 15 ppm sulfur content is mandatory for all locomotives and marine vessels in the U.S. In addition to this, the refineries operating in the US are projected to further boost the sales of hydrodesulfurization catalysts in the North American market.

An unified Market Research Subscription Platform, built for today’s disparate research needs.
Market Competition
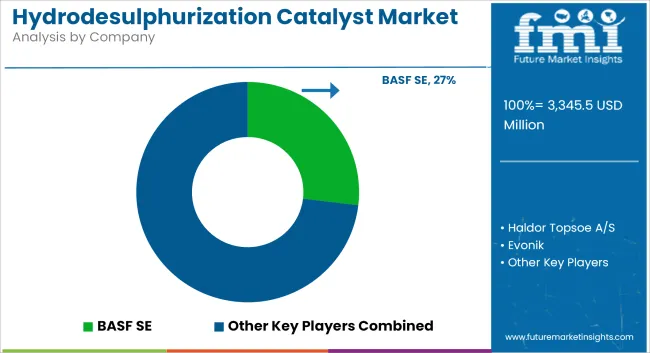
Some of the key participants present in the global Hydrodesulfurization Catalyst market include Albemarle Corporation; Advanced Refining Technologies; Sinopec Corp.; Haldor Topsoe A/S; Royal Dutch Shell PLC; PetroChina Company Limited (CNPC); Axens SA; JGC C&C; Honeywell International Inc.; and Johnson Matthey Plc among others. Attributed to the presence of such a high number of participants, the market is highly competitive.
Report Scope
Report Attribute |
Details |
Growth Rate |
CAGR of 5% from 2022 to 2032 |
Market Value in 2022 |
US$ 2.89 Billion |
Market Value in 2032 |
US$ 4.71 Billion |
Base Year for Estimation |
2021 |
Historical Data |
2017-2021 |
Forecast Period |
2022-2032 |
Quantitative Units |
Revenue in USD Million, Volume in Kilotons and CAGR from 2022-2032 |
Report Coverage |
Revenue Forecast, Volume Forecast, Company Ranking, Competitive Landscape, Growth Factors, Trends and Pricing Analysis |
Segments Covered |
|
Regions Covered |
|
Key Countries Profiled |
|
Key Companies Profiled |
|
Customization |
Available Upon Request |
Key Segments Profiled in the Hydrodesulfurization Catalyst Industry Survey
Hydrodesulfurization Catalyst Market by Type:
- Cobalt-Molybdenum Hydrodesulfurization Catalyst
- Nickel Based Hydrodesulfurization Catalyst
- Other Hydrodesulfurization Catalysts
Hydrodesulfurization Catalyst Market by Feedstock:
- Natural Gas-based Hydrodesulfurization Catalysts
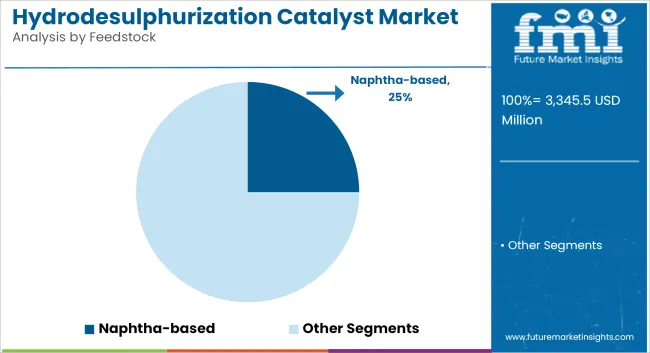
- Naphtha-based Hydrodesulfurization Catalysts
- Heavy Oil-based Hydrodesulfurization Catalysts
- Diesel Oil-based Hydrodesulfurization Catalysts
- Kerosene-based Hydrodesulfurization Catalysts
Hydrodesulfurization Catalyst Market by End Use Industry:
- Hydrodesulfurization Catalysts for Petrochemicals
- Hydrodesulfurization Catalysts for Natural Gas Processing
Hydrodesulfurization Catalyst Market by Region:
- North America Hydrodesulfurization Catalyst Market
- Latin America Hydrodesulfurization Catalyst Market
- Europe Hydrodesulfurization Catalyst Market
- Asia Pacific Hydrodesulfurization Catalyst Market
- Middle East and Africa Hydrodesulfurization Catalyst
Frequently Asked Questions
FMI projects the global Hydrodesulfurization Catalyst market to expand at a 5% value CAGR by 2032
North America is expected to be the most opportunistic Hydrodesulfurization Catalyst market, accounting for a market share of 32%.
JGC C&C; Honeywell International Inc.; and Johnson Matthey Plc are some prominent Hydrodesulfurization Catalyst manufacturers.
1. Executive Summary
1.1. Global Market Outlook
1.2. Demand-side Trends
1.3. Supply-side Trends
1.4. Technology Roadmap Analysis
1.5. Analysis and Recommendations
2. Market Overview
2.1. Market Coverage / Taxonomy
2.2. Market Definition / Scope / Limitations
3. Market Background
3.1. Market Dynamics
3.1.1. Drivers
3.1.2. Restraints
3.1.3. Opportunity
3.1.4. Trends
3.2. Scenario Forecast
3.2.1. Demand in Optimistic Scenario
3.2.2. Demand in Likely Scenario
3.2.3. Demand in Conservative Scenario
3.3. Opportunity Map Analysis
3.4. Product Life Cycle Analysis
3.5. Supply Chain Analysis
3.5.1. Supply Side Participants and their Roles
3.5.1.1. Producers
3.5.1.2. Mid-Level Participants (Traders/ Agents/ Brokers)
3.5.1.3. Wholesalers and Distributors
3.5.2. Value Added and Value Created at Node in the Supply Chain
3.5.3. List of Raw Material Suppliers
3.5.4. List of Existing and Potential Buyer’s
3.6. Investment Feasibility Matrix
3.7. Value Chain Analysis
3.7.1. Profit Margin Analysis
3.7.2. Wholesalers and Distributors
3.7.3. Retailers
3.8. PESTLE and Porter’s Analysis
3.9. Regulatory Landscape
3.9.1. By Key Regions
3.9.2. By Key Countries
3.10. Regional Parent Market Outlook
3.11. Production and Consumption Statistics
3.12. Import and Export Statistics
4. Global Hydrodesulfurization Catalyst Market Analysis 2017-2021 and Forecast, 2022-2032
4.1. Historical Market Size Value (US$ Mn) & Volume (Tons) Analysis, 2017-2021
4.2. Current and Future Market Size Value (US$ Mn) & Volume (Tons) Projections, 2022-2032
4.2.1. Y-o-Y Growth Trend Analysis
4.2.2. Absolute $ Opportunity Analysis
5. Global Hydrodesulfurization Catalyst Market Analysis 2017-2021 and Forecast 2022-2032, By Type
5.1. Introduction / Key Findings
5.2. Historical Market Size Value (US$ Mn) & Volume (Tons) Analysis By Type, 2017-2021
5.3. Current and Future Market Size Value (US$ Mn) & Volume (Tons) Analysis and Forecast By Type, 2022-2032
5.3.1. Cobalt-Molybdenum Hydrodesulfurization Catalyst
5.3.2. Nickel Based Hydrodesulfurization Catalyst
5.3.3. Others
5.4. Y-o-Y Growth Trend Analysis By Type, 2017-2021
5.5. Absolute $ Opportunity Analysis By Type, 2022-2032
6. Global Hydrodesulfurization Catalyst Market Analysis 2017-2021 and Forecast 2022-2032, By Feedstock
6.1. Introduction / Key Findings
6.2. Historical Market Size Value (US$ Mn) & Volume (Tons) Analysis By Feedstock, 2017-2021
6.3. Current and Future Market Size Value (US$ Mn) & Volume (Tons) Analysis and Forecast By Feedstock, 2022-2032
6.3.1. Natural Gas
6.3.2. Naphtha
6.3.3. Heavy Oil
6.3.4. Diesel Oil
6.3.5. Kerosene
6.4. Y-o-Y Growth Trend Analysis By Feedstock, 2017-2021
6.5. Absolute $ Opportunity Analysis By Feedstock, 2022-2032
7. Global Hydrodesulfurization Catalyst Market Analysis 2017-2021 and Forecast 2022-2032, By End Use Industry
7.1. Introduction / Key Findings
7.2. Historical Market Size Value (US$ Mn) & Volume (Tons) Analysis By End Use Industry, 2017-2021
7.3. Current and Future Market Size Value (US$ Mn) & Volume (Tons) Analysis and Forecast By End Use Industry, 2022-2032
7.3.1. Petrochemicals
7.3.2. Natural Gas Processing
7.4. Y-o-Y Growth Trend Analysis By End Use Industry, 2017-2021
7.5. Absolute $ Opportunity Analysis By End Use Industry, 2022-2032
8. Global Hydrodesulfurization Catalyst Market Analysis 2017-2021 and Forecast 2022-2032, By Region
8.1. Introduction
8.2. Historical Market Size Value (US$ Mn) & Volume (Tons) Analysis By Region, 2017-2021
8.3. Current Market Size Value (US$ Mn) & Volume (Tons) Analysis and Forecast By Region, 2022-2032
8.3.1. North America
8.3.2. Latin America
8.3.3. Europe
8.3.4. Asia Pacific
8.3.5. Middle East and Africa
8.4. Market Attractiveness Analysis By Region
9. North America Hydrodesulfurization Catalyst Market Analysis 2017-2021 and Forecast 2022-2032, By Country
9.1. Historical Market Size Value (US$ Mn) & Volume (Tons) Trend Analysis By Market Taxonomy, 2017-2021
9.2. Market Size Value (US$ Mn) & Volume (Tons) Forecast By Market Taxonomy, 2022-2032
9.2.1. By Country
9.2.1.1. U.S.
9.2.1.2. Canada
9.2.2. By Type
9.2.3. By Feedstock
9.2.4. By End Use Industry
9.3. Market Attractiveness Analysis
9.3.1. By Country
9.3.2. By Type
9.3.3. By Feedstock
9.3.4. By End Use Industry
9.4. Key Takeaways
10. Latin America Hydrodesulfurization Catalyst Market Analysis 2017-2021 and Forecast 2022-2032, By Country
10.1. Historical Market Size Value (US$ Mn) & Volume (Tons) Trend Analysis By Market Taxonomy, 2017-2021
10.2. Market Size Value (US$ Mn) & Volume (Tons) Forecast By Market Taxonomy, 2022-2032
10.2.1. By Country
10.2.1.1. Brazil
10.2.1.2. Mexico
10.2.1.3. Argentina
10.2.1.4. Chile
10.2.1.5. Peru
10.2.1.6. Rest of Latin America
10.2.2. By Type
10.2.3. By Feedstock
10.2.4. By End Use Industry
10.3. Market Attractiveness Analysis
10.3.1. By Country
10.3.2. By Type
10.3.3. By Feedstock
10.3.4. By End Use Industry
10.4. Key Takeaways
11. Europe Hydrodesulfurization Catalyst Market Analysis 2017-2021 and Forecast 2022-2032, By Country
11.1. Historical Market Size Value (US$ Mn) & Volume (Tons) Trend Analysis By Market Taxonomy, 2017-2021
11.2. Market Size Value (US$ Mn) & Volume (Tons) Forecast By Market Taxonomy, 2022-2032
11.2.1. By Country
11.2.1.1. Germany
11.2.1.2. Italy
11.2.1.3. France
11.2.1.4. U.K.
11.2.1.5. Spain
11.2.1.6. Russia
11.2.1.7. BENELUX
11.2.1.8. Rest of Europe
11.2.2. By Type
11.2.3. By Feedstock
11.2.4. By End Use Industry
11.3. Market Attractiveness Analysis
11.3.1. By Country
11.3.2. By Type
11.3.3. By Feedstock
11.3.4. By End Use Industry
11.4. Key Takeaways
12. Asia Pacific Hydrodesulfurization Catalyst Market Analysis 2017-2021 and Forecast 2022-2032, By Country
12.1. Historical Market Size Value (US$ Mn) & Volume (Tons) Trend Analysis By Market Taxonomy, 2017-2021
12.2. Market Size Value (US$ Mn) & Volume (Tons) Forecast By Market Taxonomy, 2022-2032
12.2.1. By Country
12.2.1.1. China
12.2.1.2. Japan
12.2.1.3. South Korea
12.2.1.4. Rest of Asia Pacific
12.2.2. By Type
12.2.3. By Feedstock
12.2.4. By End Use Industry
12.3. Market Attractiveness Analysis
12.3.1. By Country
12.3.2. By Type
12.3.3. By Feedstock
12.3.4. By End Use Industry
12.4. Key Takeaways
13. Middle East and Africa Hydrodesulfurization Catalyst Market Analysis 2017-2021 and Forecast 2022-2032, By Country
13.1. Historical Market Size Value (US$ Mn) & Volume (Tons) Trend Analysis By Market Taxonomy, 2017-2021
13.2. Market Size Value (US$ Mn) & Volume (Tons) Forecast By Market Taxonomy, 2022-2032
13.2.1. By Country
13.2.1.1. GCC Countries
13.2.1.2. South Africa
13.2.1.3. Turkey
13.2.1.4. Rest of Middle East and Africa
13.2.2. By Type
13.2.3. By Feedstock
13.2.4. By End Use Industry
13.3. Market Attractiveness Analysis
13.3.1. By Country
13.3.2. By Type
13.3.3. By Feedstock
13.3.4. By End Use Industry
13.4. Key Takeaways
14. Key Countries Hydrodesulfurization Catalyst Market Analysis
14.1. U.S.
14.1.1. Pricing Analysis
14.1.2. Market Share Analysis, 2021
14.1.2.1. By Type
14.1.2.2. By Feedstock
14.1.2.3. By End Use Industry
14.2. Canada
14.2.1. Pricing Analysis
14.2.2. Market Share Analysis, 2021
14.2.2.1. By Type
14.2.2.2. By Feedstock
14.2.2.3. By End Use Industry
14.3. Brazil
14.3.1. Pricing Analysis
14.3.2. Market Share Analysis, 2021
14.3.2.1. By Type
14.3.2.2. By Feedstock
14.3.2.3. By End Use Industry
14.4. Mexico
14.4.1. Pricing Analysis
14.4.2. Market Share Analysis, 2021
14.4.2.1. By Type
14.4.2.2. By Feedstock
14.4.2.3. By End Use Industry
14.5. Argentina
14.5.1. Pricing Analysis
14.5.2. Market Share Analysis, 2021
14.5.2.1. By Type
14.5.2.2. By Feedstock
14.5.2.3. By End Use Industry
14.6. Chile
14.6.1. Pricing Analysis
14.6.2. Market Share Analysis, 2021
14.6.2.1. By Type
14.6.2.2. By Feedstock
14.6.2.3. By End Use Industry
14.7. Peru
14.7.1. Pricing Analysis
14.7.2. Market Share Analysis, 2021
14.7.2.1. By Type
14.7.2.2. By Feedstock
14.7.2.3. By End Use Industry
14.8. Germany
14.8.1. Pricing Analysis
14.8.2. Market Share Analysis, 2021
14.8.2.1. By Type
14.8.2.2. By Feedstock
14.8.2.3. By End Use Industry
14.9. Italy
14.9.1. Pricing Analysis
14.9.2. Market Share Analysis, 2021
14.9.2.1. By Type
14.9.2.2. By Feedstock
14.9.2.3. By End Use Industry
14.10. France
14.10.1. Pricing Analysis
14.10.2. Market Share Analysis, 2021
14.10.2.1. By Type
14.10.2.2. By Feedstock
14.10.2.3. By End Use Industry
14.11. U.K.
14.11.1. Pricing Analysis
14.11.2. Market Share Analysis, 2021
14.11.2.1. By Type
14.11.2.2. By Feedstock
14.11.2.3. By End Use Industry
14.12. Spain
14.12.1. Pricing Analysis
14.12.2. Market Share Analysis, 2021
14.12.2.1. By Type
14.12.2.2. By Feedstock
14.12.2.3. By End Use Industry
14.13. Russia
14.13.1. Pricing Analysis
14.13.2. Market Share Analysis, 2021
14.13.2.1. By Type
14.13.2.2. By Feedstock
14.13.2.3. By End Use Industry
14.14. BENELUX
14.14.1. Pricing Analysis
14.14.2. Market Share Analysis, 2021
14.14.2.1. By Type
14.14.2.2. By Feedstock
14.14.2.3. By End Use Industry
14.15. China
14.15.1. Pricing Analysis
14.15.2. Market Share Analysis, 2021
14.15.2.1. By Type
14.15.2.2. By Feedstock
14.15.2.3. By End Use Industry
14.16. Japan
14.16.1. Pricing Analysis
14.16.2. Market Share Analysis, 2021
14.16.2.1. By Type
14.16.2.2. By Feedstock
14.16.2.3. By End Use Industry
14.17. South Korea
14.17.1. Pricing Analysis
14.17.2. Market Share Analysis, 2021
14.17.2.1. By Type
14.17.2.2. By Feedstock
14.17.2.3. By End Use Industry
14.18. GCC Countries
14.18.1. Pricing Analysis
14.18.2. Market Share Analysis, 2021
14.18.2.1. By Type
14.18.2.2. By Feedstock
14.18.2.3. By End Use Industry
14.19. South Africa
14.19.1. Pricing Analysis
14.19.2. Market Share Analysis, 2021
14.19.2.1. By Type
14.19.2.2. By Feedstock
14.19.2.3. By End Use Industry
14.20. Turkey
14.20.1. Pricing Analysis
14.20.2. Market Share Analysis, 2021
14.20.2.1. By Type
14.20.2.2. By Feedstock
14.20.2.3. By End Use Industry
15. Market Structure Analysis
15.1. Competition Dashboard
15.2. Competition Benchmarking
15.3. Market Share Analysis of Top Players
15.3.1. By Regional
15.3.2. By Type
15.3.3. By Feedstock
15.3.4. By End Use Industry
16. Competition Analysis
16.1. Competition Deep Dive
16.1.1. Haldor Topsoe A/S
16.1.1.1. Overview
16.1.1.2. Product Portfolio
16.1.1.3. Profitability by Market Segments
16.1.1.4. Sales Footprint
16.1.1.5. Strategy Overview
16.1.1.5.1. Marketing Strategy
16.1.1.5.2. Product Strategy
16.1.1.5.3. Channel Strategy
16.1.2. Honeywell UOP
16.1.2.1. Overview
16.1.2.2. Product Portfolio
16.1.2.3. Profitability by Market Segments
16.1.2.4. Sales Footprint
16.1.2.5. Strategy Overview
16.1.2.5.1. Marketing Strategy
16.1.2.5.2. Product Strategy
16.1.2.5.3. Channel Strategy
16.1.3. W.R. Grace and Company
16.1.3.1. Overview
16.1.3.2. Product Portfolio
16.1.3.3. Profitability by Market Segments
16.1.3.4. Sales Footprint
16.1.3.5. Strategy Overview
16.1.3.5.1. Marketing Strategy
16.1.3.5.2. Product Strategy
16.1.3.5.3. Channel Strategy
16.1.4. Albemarle Corporation
16.1.4.1. Overview
16.1.4.2. Product Portfolio
16.1.4.3. Profitability by Market Segments
16.1.4.4. Sales Footprint
16.1.4.5. Strategy Overview
16.1.4.5.1. Marketing Strategy
16.1.4.5.2. Product Strategy
16.1.4.5.3. Channel Strategy
16.1.5. Johnson Matthey PLC
16.1.5.1. Overview
16.1.5.2. Product Portfolio
16.1.5.3. Profitability by Market Segments
16.1.5.4. Sales Footprint
16.1.5.5. Strategy Overview
16.1.5.5.1. Marketing Strategy
16.1.5.5.2. Product Strategy
16.1.5.5.3. Channel Strategy
16.1.6. Axens S.A
16.1.6.1. Overview
16.1.6.2. Product Portfolio
16.1.6.3. Profitability by Market Segments
16.1.6.4. Sales Footprint
16.1.6.5. Strategy Overview
16.1.6.5.1. Marketing Strategy
16.1.6.5.2. Product Strategy
16.1.6.5.3. Channel Strategy
16.1.7. Redkino Catalyst Company
16.1.7.1. Overview
16.1.7.2. Product Portfolio
16.1.7.3. Profitability by Market Segments
16.1.7.4. Sales Footprint
16.1.7.5. Strategy Overview
16.1.7.5.1. Marketing Strategy
16.1.7.5.2. Product Strategy
16.1.7.5.3. Channel Strategy
16.1.8. Criterion Catalysts & Technologies
16.1.8.1. Overview
16.1.8.2. Product Portfolio
16.1.8.3. Profitability by Market Segments
16.1.8.4. Sales Footprint
16.1.8.5. Strategy Overview
16.1.8.5.1. Marketing Strategy
16.1.8.5.2. Product Strategy
16.1.8.5.3. Channel Strategy
17. Assumptions & Acronyms Used
18. Research Methodolog
Let us know your requirement to get
100% FREE customization
Table 1: Global Hydrodesulfurization Catalyst Market Value (US$ Mn) Forecast by Region, 2017-2032
Table 2: Global Hydrodesulfurization Catalyst Market Volume (Tons) Forecast by Region, 2017-2032
Table 3: Global Hydrodesulfurization Catalyst Market Value (US$ Mn) Forecast by Type, 2017-2032
Table 4: Global Hydrodesulfurization Catalyst Market Volume (Tons) Forecast by Type, 2017-2032
Table 5: Global Hydrodesulfurization Catalyst Market Value (US$ Mn) Forecast by Feedstock, 2017-2032
Table 6: Global Hydrodesulfurization Catalyst Market Volume (Tons) Forecast by Feedstock, 2017-2032
Table 7: Global Hydrodesulfurization Catalyst Market Value (US$ Mn) Forecast by End Use Industry, 2017-2032
Table 8: Global Hydrodesulfurization Catalyst Market Volume (Tons) Forecast by End Use Industry, 2017-2032
Table 9: North America Hydrodesulfurization Catalyst Market Value (US$ Mn) Forecast by Country, 2017-2032
Table 10: North America Hydrodesulfurization Catalyst Market Volume (Tons) Forecast by Country, 2017-2032
Table 11: North America Hydrodesulfurization Catalyst Market Value (US$ Mn) Forecast by Type, 2017-2032
Table 12: North America Hydrodesulfurization Catalyst Market Volume (Tons) Forecast by Type, 2017-2032
Table 13: North America Hydrodesulfurization Catalyst Market Value (US$ Mn) Forecast by Feedstock, 2017-2032
Table 14: North America Hydrodesulfurization Catalyst Market Volume (Tons) Forecast by Feedstock, 2017-2032
Table 15: North America Hydrodesulfurization Catalyst Market Value (US$ Mn) Forecast by End Use Industry, 2017-2032
Table 16: North America Hydrodesulfurization Catalyst Market Volume (Tons) Forecast by End Use Industry, 2017-2032
Table 17: Latin America Hydrodesulfurization Catalyst Market Value (US$ Mn) Forecast by Country, 2017-2032
Table 18: Latin America Hydrodesulfurization Catalyst Market Volume (Tons) Forecast by Country, 2017-2032
Table 19: Latin America Hydrodesulfurization Catalyst Market Value (US$ Mn) Forecast by Type, 2017-2032
Table 20: Latin America Hydrodesulfurization Catalyst Market Volume (Tons) Forecast by Type, 2017-2032
Table 21: Latin America Hydrodesulfurization Catalyst Market Value (US$ Mn) Forecast by Feedstock, 2017-2032
Table 22: Latin America Hydrodesulfurization Catalyst Market Volume (Tons) Forecast by Feedstock, 2017-2032
Table 23: Latin America Hydrodesulfurization Catalyst Market Value (US$ Mn) Forecast by End Use Industry, 2017-2032
Table 24: Latin America Hydrodesulfurization Catalyst Market Volume (Tons) Forecast by End Use Industry, 2017-2032
Table 25: Europe Hydrodesulfurization Catalyst Market Value (US$ Mn) Forecast by Country, 2017-2032
Table 26: Europe Hydrodesulfurization Catalyst Market Volume (Tons) Forecast by Country, 2017-2032
Table 27: Europe Hydrodesulfurization Catalyst Market Value (US$ Mn) Forecast by Type, 2017-2032
Table 28: Europe Hydrodesulfurization Catalyst Market Volume (Tons) Forecast by Type, 2017-2032
Table 29: Europe Hydrodesulfurization Catalyst Market Value (US$ Mn) Forecast by Feedstock, 2017-2032
Table 30: Europe Hydrodesulfurization Catalyst Market Volume (Tons) Forecast by Feedstock, 2017-2032
Table 31: Europe Hydrodesulfurization Catalyst Market Value (US$ Mn) Forecast by End Use Industry, 2017-2032
Table 32: Europe Hydrodesulfurization Catalyst Market Volume (Tons) Forecast by End Use Industry, 2017-2032
Table 33: Asia Pacific Hydrodesulfurization Catalyst Market Value (US$ Mn) Forecast by Country, 2017-2032
Table 34: Asia Pacific Hydrodesulfurization Catalyst Market Volume (Tons) Forecast by Country, 2017-2032
Table 35: Asia Pacific Hydrodesulfurization Catalyst Market Value (US$ Mn) Forecast by Type, 2017-2032
Table 36: Asia Pacific Hydrodesulfurization Catalyst Market Volume (Tons) Forecast by Type, 2017-2032
Table 37: Asia Pacific Hydrodesulfurization Catalyst Market Value (US$ Mn) Forecast by Feedstock, 2017-2032
Table 38: Asia Pacific Hydrodesulfurization Catalyst Market Volume (Tons) Forecast by Feedstock, 2017-2032
Table 39: Asia Pacific Hydrodesulfurization Catalyst Market Value (US$ Mn) Forecast by End Use Industry, 2017-2032
Table 40: Asia Pacific Hydrodesulfurization Catalyst Market Volume (Tons) Forecast by End Use Industry, 2017-2032
Table 41: Middle East and Africa Hydrodesulfurization Catalyst Market Value (US$ Mn) Forecast by Country, 2017-2032
Table 42: Middle East and Africa Hydrodesulfurization Catalyst Market Volume (Tons) Forecast by Country, 2017-2032
Table 43: Middle East and Africa Hydrodesulfurization Catalyst Market Value (US$ Mn) Forecast by Type, 2017-2032
Table 44: Middle East and Africa Hydrodesulfurization Catalyst Market Volume (Tons) Forecast by Type, 2017-2032
Table 45: Middle East and Africa Hydrodesulfurization Catalyst Market Value (US$ Mn) Forecast by Feedstock, 2017-2032
Table 46: Middle East and Africa Hydrodesulfurization Catalyst Market Volume (Tons) Forecast by Feedstock, 2017-2032
Table 47: Middle East and Africa Hydrodesulfurization Catalyst Market Value (US$ Mn) Forecast by End Use Industry, 2017-2032
Table 48: Middle East and Africa Hydrodesulfurization Catalyst Market Volume (Tons) Forecast by End Use Industry, 2017-2032
Find your sweet spots for generating winning opportunities in this market.
Talk to AnalystFigure 1: Global Hydrodesulfurization Catalyst Market Value (US$ Mn) by Type, 2022-2032
Figure 2: Global Hydrodesulfurization Catalyst Market Value (US$ Mn) by Feedstock, 2022-2032
Figure 3: Global Hydrodesulfurization Catalyst Market Value (US$ Mn) by End Use Industry, 2022-2032
Figure 4: Global Hydrodesulfurization Catalyst Market Value (US$ Mn) by Region, 2022-2032
Figure 5: Global Hydrodesulfurization Catalyst Market Value (US$ Mn) Analysis by Region, 2017-2032
Figure 6: Global Hydrodesulfurization Catalyst Market Volume (Tons) Analysis by Region, 2017-2032
Figure 7: Global Hydrodesulfurization Catalyst Market Value Share (%) and BPS Analysis by Region, 2022-2032
Figure 8: Global Hydrodesulfurization Catalyst Market Y-o-Y Growth (%) Projections by Region, 2022-2032
Figure 9: Global Hydrodesulfurization Catalyst Market Value (US$ Mn) Analysis by Type, 2017-2032
Figure 10: Global Hydrodesulfurization Catalyst Market Volume (Tons) Analysis by Type, 2017-2032
Figure 11: Global Hydrodesulfurization Catalyst Market Value Share (%) and BPS Analysis by Type, 2022-2032
Figure 12: Global Hydrodesulfurization Catalyst Market Y-o-Y Growth (%) Projections by Type, 2022-2032
Figure 13: Global Hydrodesulfurization Catalyst Market Value (US$ Mn) Analysis by Feedstock, 2017-2032
Figure 14: Global Hydrodesulfurization Catalyst Market Volume (Tons) Analysis by Feedstock, 2017-2032
Figure 15: Global Hydrodesulfurization Catalyst Market Value Share (%) and BPS Analysis by Feedstock, 2022-2032
Figure 16: Global Hydrodesulfurization Catalyst Market Y-o-Y Growth (%) Projections by Feedstock, 2022-2032
Figure 17: Global Hydrodesulfurization Catalyst Market Value (US$ Mn) Analysis by End Use Industry, 2017-2032
Figure 18: Global Hydrodesulfurization Catalyst Market Volume (Tons) Analysis by End Use Industry, 2017-2032
Figure 19: Global Hydrodesulfurization Catalyst Market Value Share (%) and BPS Analysis by End Use Industry, 2022-2032
Figure 20: Global Hydrodesulfurization Catalyst Market Y-o-Y Growth (%) Projections by End Use Industry, 2022-2032
Figure 21: Global Hydrodesulfurization Catalyst Market Attractiveness by Type, 2022-2032
Figure 22: Global Hydrodesulfurization Catalyst Market Attractiveness by Feedstock, 2022-2032
Figure 23: Global Hydrodesulfurization Catalyst Market Attractiveness by End Use Industry, 2022-2032
Figure 24: Global Hydrodesulfurization Catalyst Market Attractiveness by Region, 2022-2032
Figure 25: North America Hydrodesulfurization Catalyst Market Value (US$ Mn) by Type, 2022-2032
Figure 26: North America Hydrodesulfurization Catalyst Market Value (US$ Mn) by Feedstock, 2022-2032
Figure 27: North America Hydrodesulfurization Catalyst Market Value (US$ Mn) by End Use Industry, 2022-2032
Figure 28: North America Hydrodesulfurization Catalyst Market Value (US$ Mn) by Country, 2022-2032
Figure 29: North America Hydrodesulfurization Catalyst Market Value (US$ Mn) Analysis by Country, 2017-2032
Figure 30: North America Hydrodesulfurization Catalyst Market Volume (Tons) Analysis by Country, 2017-2032
Figure 31: North America Hydrodesulfurization Catalyst Market Value Share (%) and BPS Analysis by Country, 2022-2032
Figure 32: North America Hydrodesulfurization Catalyst Market Y-o-Y Growth (%) Projections by Country, 2022-2032
Figure 33: North America Hydrodesulfurization Catalyst Market Value (US$ Mn) Analysis by Type, 2017-2032
Figure 34: North America Hydrodesulfurization Catalyst Market Volume (Tons) Analysis by Type, 2017-2032
Figure 35: North America Hydrodesulfurization Catalyst Market Value Share (%) and BPS Analysis by Type, 2022-2032
Figure 36: North America Hydrodesulfurization Catalyst Market Y-o-Y Growth (%) Projections by Type, 2022-2032
Figure 37: North America Hydrodesulfurization Catalyst Market Value (US$ Mn) Analysis by Feedstock, 2017-2032
Figure 38: North America Hydrodesulfurization Catalyst Market Volume (Tons) Analysis by Feedstock, 2017-2032
Figure 39: North America Hydrodesulfurization Catalyst Market Value Share (%) and BPS Analysis by Feedstock, 2022-2032
Figure 40: North America Hydrodesulfurization Catalyst Market Y-o-Y Growth (%) Projections by Feedstock, 2022-2032
Figure 41: North America Hydrodesulfurization Catalyst Market Value (US$ Mn) Analysis by End Use Industry, 2017-2032
Figure 42: North America Hydrodesulfurization Catalyst Market Volume (Tons) Analysis by End Use Industry, 2017-2032
Figure 43: North America Hydrodesulfurization Catalyst Market Value Share (%) and BPS Analysis by End Use Industry, 2022-2032
Figure 44: North America Hydrodesulfurization Catalyst Market Y-o-Y Growth (%) Projections by End Use Industry, 2022-2032
Figure 45: North America Hydrodesulfurization Catalyst Market Attractiveness by Type, 2022-2032
Figure 46: North America Hydrodesulfurization Catalyst Market Attractiveness by Feedstock, 2022-2032
Figure 47: North America Hydrodesulfurization Catalyst Market Attractiveness by End Use Industry, 2022-2032
Figure 48: North America Hydrodesulfurization Catalyst Market Attractiveness by Country, 2022-2032
Figure 49: Latin America Hydrodesulfurization Catalyst Market Value (US$ Mn) by Type, 2022-2032
Figure 50: Latin America Hydrodesulfurization Catalyst Market Value (US$ Mn) by Feedstock, 2022-2032
Figure 51: Latin America Hydrodesulfurization Catalyst Market Value (US$ Mn) by End Use Industry, 2022-2032
Figure 52: Latin America Hydrodesulfurization Catalyst Market Value (US$ Mn) by Country, 2022-2032
Figure 53: Latin America Hydrodesulfurization Catalyst Market Value (US$ Mn) Analysis by Country, 2017-2032
Figure 54: Latin America Hydrodesulfurization Catalyst Market Volume (Tons) Analysis by Country, 2017-2032
Figure 55: Latin America Hydrodesulfurization Catalyst Market Value Share (%) and BPS Analysis by Country, 2022-2032
Figure 56: Latin America Hydrodesulfurization Catalyst Market Y-o-Y Growth (%) Projections by Country, 2022-2032
Figure 57: Latin America Hydrodesulfurization Catalyst Market Value (US$ Mn) Analysis by Type, 2017-2032
Figure 58: Latin America Hydrodesulfurization Catalyst Market Volume (Tons) Analysis by Type, 2017-2032
Figure 59: Latin America Hydrodesulfurization Catalyst Market Value Share (%) and BPS Analysis by Type, 2022-2032
Figure 60: Latin America Hydrodesulfurization Catalyst Market Y-o-Y Growth (%) Projections by Type, 2022-2032
Figure 61: Latin America Hydrodesulfurization Catalyst Market Value (US$ Mn) Analysis by Feedstock, 2017-2032
Figure 62: Latin America Hydrodesulfurization Catalyst Market Volume (Tons) Analysis by Feedstock, 2017-2032
Figure 63: Latin America Hydrodesulfurization Catalyst Market Value Share (%) and BPS Analysis by Feedstock, 2022-2032
Figure 64: Latin America Hydrodesulfurization Catalyst Market Y-o-Y Growth (%) Projections by Feedstock, 2022-2032
Figure 65: Latin America Hydrodesulfurization Catalyst Market Value (US$ Mn) Analysis by End Use Industry, 2017-2032
Figure 66: Latin America Hydrodesulfurization Catalyst Market Volume (Tons) Analysis by End Use Industry, 2017-2032
Figure 67: Latin America Hydrodesulfurization Catalyst Market Value Share (%) and BPS Analysis by End Use Industry, 2022-2032
Figure 68: Latin America Hydrodesulfurization Catalyst Market Y-o-Y Growth (%) Projections by End Use Industry, 2022-2032
Figure 69: Latin America Hydrodesulfurization Catalyst Market Attractiveness by Type, 2022-2032
Figure 70: Latin America Hydrodesulfurization Catalyst Market Attractiveness by Feedstock, 2022-2032
Figure 71: Latin America Hydrodesulfurization Catalyst Market Attractiveness by End Use Industry, 2022-2032
Figure 72: Latin America Hydrodesulfurization Catalyst Market Attractiveness by Country, 2022-2032
Figure 73: Europe Hydrodesulfurization Catalyst Market Value (US$ Mn) by Type, 2022-2032
Figure 74: Europe Hydrodesulfurization Catalyst Market Value (US$ Mn) by Feedstock, 2022-2032
Figure 75: Europe Hydrodesulfurization Catalyst Market Value (US$ Mn) by End Use Industry, 2022-2032
Figure 76: Europe Hydrodesulfurization Catalyst Market Value (US$ Mn) by Country, 2022-2032
Figure 77: Europe Hydrodesulfurization Catalyst Market Value (US$ Mn) Analysis by Country, 2017-2032
Figure 78: Europe Hydrodesulfurization Catalyst Market Volume (Tons) Analysis by Country, 2017-2032
Figure 79: Europe Hydrodesulfurization Catalyst Market Value Share (%) and BPS Analysis by Country, 2022-2032
Figure 80: Europe Hydrodesulfurization Catalyst Market Y-o-Y Growth (%) Projections by Country, 2022-2032
Figure 81: Europe Hydrodesulfurization Catalyst Market Value (US$ Mn) Analysis by Type, 2017-2032
Figure 82: Europe Hydrodesulfurization Catalyst Market Volume (Tons) Analysis by Type, 2017-2032
Figure 83: Europe Hydrodesulfurization Catalyst Market Value Share (%) and BPS Analysis by Type, 2022-2032
Figure 84: Europe Hydrodesulfurization Catalyst Market Y-o-Y Growth (%) Projections by Type, 2022-2032
Figure 85: Europe Hydrodesulfurization Catalyst Market Value (US$ Mn) Analysis by Feedstock, 2017-2032
Figure 86: Europe Hydrodesulfurization Catalyst Market Volume (Tons) Analysis by Feedstock, 2017-2032
Figure 87: Europe Hydrodesulfurization Catalyst Market Value Share (%) and BPS Analysis by Feedstock, 2022-2032
Figure 88: Europe Hydrodesulfurization Catalyst Market Y-o-Y Growth (%) Projections by Feedstock, 2022-2032
Figure 89: Europe Hydrodesulfurization Catalyst Market Value (US$ Mn) Analysis by End Use Industry, 2017-2032
Figure 90: Europe Hydrodesulfurization Catalyst Market Volume (Tons) Analysis by End Use Industry, 2017-2032
Figure 91: Europe Hydrodesulfurization Catalyst Market Value Share (%) and BPS Analysis by End Use Industry, 2022-2032
Figure 92: Europe Hydrodesulfurization Catalyst Market Y-o-Y Growth (%) Projections by End Use Industry, 2022-2032
Figure 93: Europe Hydrodesulfurization Catalyst Market Attractiveness by Type, 2022-2032
Figure 94: Europe Hydrodesulfurization Catalyst Market Attractiveness by Feedstock, 2022-2032
Figure 95: Europe Hydrodesulfurization Catalyst Market Attractiveness by End Use Industry, 2022-2032
Figure 96: Europe Hydrodesulfurization Catalyst Market Attractiveness by Country, 2022-2032
Figure 97: Asia Pacific Hydrodesulfurization Catalyst Market Value (US$ Mn) by Type, 2022-2032
Figure 98: Asia Pacific Hydrodesulfurization Catalyst Market Value (US$ Mn) by Feedstock, 2022-2032
Figure 99: Asia Pacific Hydrodesulfurization Catalyst Market Value (US$ Mn) by End Use Industry, 2022-2032
Figure 100: Asia Pacific Hydrodesulfurization Catalyst Market Value (US$ Mn) by Country, 2022-2032
Figure 101: Asia Pacific Hydrodesulfurization Catalyst Market Value (US$ Mn) Analysis by Country, 2017-2032
Figure 102: Asia Pacific Hydrodesulfurization Catalyst Market Volume (Tons) Analysis by Country, 2017-2032
Figure 103: Asia Pacific Hydrodesulfurization Catalyst Market Value Share (%) and BPS Analysis by Country, 2022-2032
Figure 104: Asia Pacific Hydrodesulfurization Catalyst Market Y-o-Y Growth (%) Projections by Country, 2022-2032
Figure 105: Asia Pacific Hydrodesulfurization Catalyst Market Value (US$ Mn) Analysis by Type, 2017-2032
Figure 106: Asia Pacific Hydrodesulfurization Catalyst Market Volume (Tons) Analysis by Type, 2017-2032
Figure 107: Asia Pacific Hydrodesulfurization Catalyst Market Value Share (%) and BPS Analysis by Type, 2022-2032
Figure 108: Asia Pacific Hydrodesulfurization Catalyst Market Y-o-Y Growth (%) Projections by Type, 2022-2032
Figure 109: Asia Pacific Hydrodesulfurization Catalyst Market Value (US$ Mn) Analysis by Feedstock, 2017-2032
Figure 110: Asia Pacific Hydrodesulfurization Catalyst Market Volume (Tons) Analysis by Feedstock, 2017-2032
Figure 111: Asia Pacific Hydrodesulfurization Catalyst Market Value Share (%) and BPS Analysis by Feedstock, 2022-2032
Figure 112: Asia Pacific Hydrodesulfurization Catalyst Market Y-o-Y Growth (%) Projections by Feedstock, 2022-2032
Figure 113: Asia Pacific Hydrodesulfurization Catalyst Market Value (US$ Mn) Analysis by End Use Industry, 2017-2032
Figure 114: Asia Pacific Hydrodesulfurization Catalyst Market Volume (Tons) Analysis by End Use Industry, 2017-2032
Figure 115: Asia Pacific Hydrodesulfurization Catalyst Market Value Share (%) and BPS Analysis by End Use Industry, 2022-2032
Figure 116: Asia Pacific Hydrodesulfurization Catalyst Market Y-o-Y Growth (%) Projections by End Use Industry, 2022-2032
Figure 117: Asia Pacific Hydrodesulfurization Catalyst Market Attractiveness by Type, 2022-2032
Figure 118: Asia Pacific Hydrodesulfurization Catalyst Market Attractiveness by Feedstock, 2022-2032
Figure 119: Asia Pacific Hydrodesulfurization Catalyst Market Attractiveness by End Use Industry, 2022-2032
Figure 120: Asia Pacific Hydrodesulfurization Catalyst Market Attractiveness by Country, 2022-2032
Figure 121: Middle East and Africa Hydrodesulfurization Catalyst Market Value (US$ Mn) by Type, 2022-2032
Figure 122: Middle East and Africa Hydrodesulfurization Catalyst Market Value (US$ Mn) by Feedstock, 2022-2032
Figure 123: Middle East and Africa Hydrodesulfurization Catalyst Market Value (US$ Mn) by End Use Industry, 2022-2032
Figure 124: Middle East and Africa Hydrodesulfurization Catalyst Market Value (US$ Mn) by Country, 2022-2032
Figure 125: Middle East and Africa Hydrodesulfurization Catalyst Market Value (US$ Mn) Analysis by Country, 2017-2032
Figure 126: Middle East and Africa Hydrodesulfurization Catalyst Market Volume (Tons) Analysis by Country, 2017-2032
Figure 127: Middle East and Africa Hydrodesulfurization Catalyst Market Value Share (%) and BPS Analysis by Country, 2022-2032
Figure 128: Middle East and Africa Hydrodesulfurization Catalyst Market Y-o-Y Growth (%) Projections by Country, 2022-2032
Figure 129: Middle East and Africa Hydrodesulfurization Catalyst Market Value (US$ Mn) Analysis by Type, 2017-2032
Figure 130: Middle East and Africa Hydrodesulfurization Catalyst Market Volume (Tons) Analysis by Type, 2017-2032
Figure 131: Middle East and Africa Hydrodesulfurization Catalyst Market Value Share (%) and BPS Analysis by Type, 2022-2032
Figure 132: Middle East and Africa Hydrodesulfurization Catalyst Market Y-o-Y Growth (%) Projections by Type, 2022-2032
Figure 133: Middle East and Africa Hydrodesulfurization Catalyst Market Value (US$ Mn) Analysis by Feedstock, 2017-2032
Figure 134: Middle East and Africa Hydrodesulfurization Catalyst Market Volume (Tons) Analysis by Feedstock, 2017-2032
Figure 135: Middle East and Africa Hydrodesulfurization Catalyst Market Value Share (%) and BPS Analysis by Feedstock, 2022-2032
Figure 136: Middle East and Africa Hydrodesulfurization Catalyst Market Y-o-Y Growth (%) Projections by Feedstock, 2022-2032
Figure 137: Middle East and Africa Hydrodesulfurization Catalyst Market Value (US$ Mn) Analysis by End Use Industry, 2017-2032
Figure 138: Middle East and Africa Hydrodesulfurization Catalyst Market Volume (Tons) Analysis by End Use Industry, 2017-2032
Figure 139: Middle East and Africa Hydrodesulfurization Catalyst Market Value Share (%) and BPS Analysis by End Use Industry, 2022-2032
Figure 140: Middle East and Africa Hydrodesulfurization Catalyst Market Y-o-Y Growth (%) Projections by End Use Industry, 2022-2032
Figure 141: Middle East and Africa Hydrodesulfurization Catalyst Market Attractiveness by Type, 2022-2032
Figure 142: Middle East and Africa Hydrodesulfurization Catalyst Market Attractiveness by Feedstock, 2022-2032
Figure 143: Middle East and Africa Hydrodesulfurization Catalyst Market Attractiveness by End Use Industry, 2022-2032
Figure 144: Middle East and Africa Hydrodesulfurization Catalyst Market Attractiveness by Country, 2022-2032
Need specific information?
Request CustomizationExplore Chemicals & Materials Insights
View Reports