

- Market Size (2026)
- USD 520.6 Mn
- Forecast (2036)
- USD 914.9 Mn
- CAGR (2026 to 2036)
- 5.8%
How big is the hysteresis brake units market size?
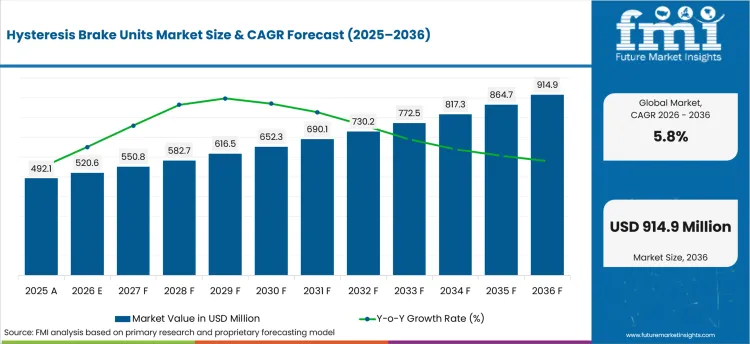
USD 520.6 million in 2026 and USD 914.9 million by 2036 at a 5.8% CAGR.
Sales in hysteresis brake units are projected to grow at 5.8% CAGR through 2036, driving valuation to USD 914.9 million by 2036 from USD 520.6 million in 2026. Buyers are anticipated to qualify brake units for repeatable torque loading and documented equipment uptime across automated machinery programs. Federal Reserve Board reported in its June 15, 2026 release stating total industrial production in the United States stood 1.7% above its year-earlier level in May 2026, giving motion-component suppliers a clear signal for replacement and automation-linked projects.
India and China account reviews are forecast to favor local service depth and faster replacement access. Germany and Japan qualification teams are expected to weigh torque documentation and supplier continuity before new approvals. Magtrol listed WB 32 High-Speed Eddy-Current Dynamometers and DES 410 Series Power Supply for Dynamometer Brakes manuals revised in December 2025, reflecting how documentation updates support brake-system review.
| Metric | Value |
|---|---|
| 2025 Market Size | USD 492.1 million |
| 2026 Market Size | USD 520.6 million |
| 2036 Market Size | USD 914.9 million |
| Forecast CAGR (2026-2036) | 5.8% |
| Torque Range Focus | Medium Torque |
| Medium Torque Share (2026) | 43.0% |
| Sales Channel Focus | Direct OEM supply |
| Direct OEM supply Share (2026) | 41.4% |
| Application Focus | Tension Control |
| Tension Control Share (2026) | 39.0% |
Summary of the Hysteresis Brake Units Market
| Market Signal | Commercial Impact |
|---|---|
| Demand and Growth Drivers | Demand for hysteresis brake units rise as machine builders connect torque control with test repeatability and equipment uptime. Account decisions are expected to reflect brake evidence and service response across repeat orders.
|
| Product and Segment View | Segment demand is led by medium torque and tension control requiring documented brake performance. Specification work is anticipated to concentrate on supplier-controlled brake programs designed to reduce qualification gaps without weakening equipment reliability.
|
| Geography and Growth Outlook | Country demand is stronger across markets with automation investment and documented supplier review. Supplier gains are likely to reflect local service activity and proof-led account approval.
|
| Competitive Landscape | Competition is likely to focus on brake design and field support. Account profits are expected to favor suppliers with clear testing records and dependable replenishment.
|
| Analyst Perspective | Hysteresis brake units are developing into a specification-led motion-control segment linked to torque precision and equipment reliability. Supplier progress is projected to improve through technical evidence and field support aligned with machine-builder requirements.
|
Source: Future Market Insights analysis, 2026.
How is the hysteresis brake units market segmented?
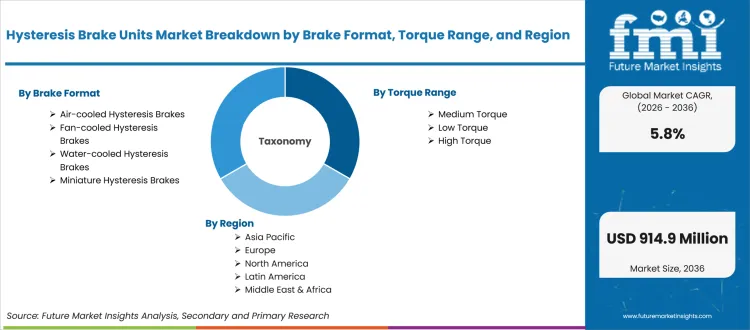
The hysteresis brake units industry is segmented by torque range, sales channel, application, brake format, end use, and region.
The hysteresis brake units market is segmented by torque range, sales channel, application, brake format, end use, and region. Torque range coverage includes Low Torque, Medium Torque, High Torque, Ultra-low Torque, and High-heat Duty. Sales channel coverage includes Direct OEM supply, industrial distributors, system integrators, online component platforms, and service-led supply. Application coverage includes Tension Control, Dynamometer Testing, Cable / Wire Processing, Motor Testing, and Torque Simulation. Brake format coverage includes Air-cooled Hysteresis Brakes, Fan-cooled Hysteresis Brakes, Water-cooled Hysteresis Brakes, Miniature Hysteresis Brakes, and Base-mounted Hysteresis Brakes. End use coverage includes Textile & Wire Machinery, Test Benches, Packaging Machinery, Medical / Dental Tool Testing, and Automotive / Aerospace Labs. Regional coverage includes North America, Latin America, Europe, East Asia, South Asia and Pacific, and Middle East and Africa.
How is medium torque positioned within torque range demand?
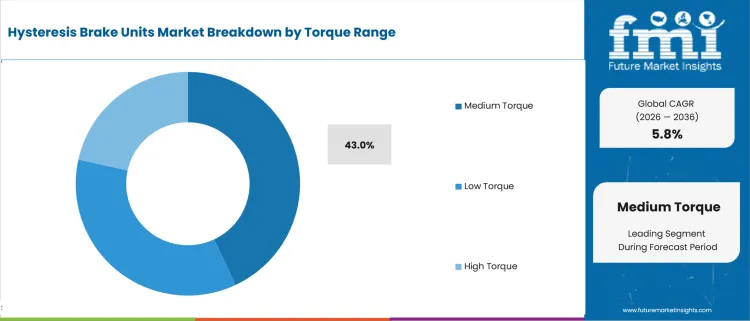
Medium torque is estimated to support hysteresis brake units demand as many machine programs need torque capacity balancing compact equipment design and stable load response. Buyers use medium-torque brake units for test benches and tension-control systems requiring predictable resistance during repeated cycles. AMT reported in its February 9, 2026 release stating December 2025 USA manufacturing technology orders grew 86.7% over November 2025, reflecting machine-tool and test-equipment programs requiring stable torque loading.
- Medium torque is projected to hold 43.0% share in 2026, led by recurring use across machinery programs requiring dependable torque without oversized cooling or mounting needs.
- Low torque and high torque support different load profiles across compact devices and heavy-duty test systems. Medium torque gains preference as account teams compare torque response and service support before supplier approval.
How does direct OEM supply support sales channel demand?
Direct OEM supply is anticipated to support account-specific engineering as machine builders need brake units matched to winding systems and automated machinery programs. OEM teams prefer supplier contact shortening specification review and improves responsibility clarity during installation. VDMA reported in its 2026 figures and charts stating machinery and equipment orders from euro partner countries rose 7% in 2025, reinforcing direct supplier review as OEMs manage specification continuity across export-linked machinery projects.
- Direct OEM supply is expected to account for 41.4% share in 2026, aided by account teams needing closer configuration support and technical file control.
- Industrial distributors and system integrators remain useful for replacement orders and local access. Direct OEM supply gains preference once machine builders need coordinated design review and recurring brake-unit control.
How does tension control guide application demand?
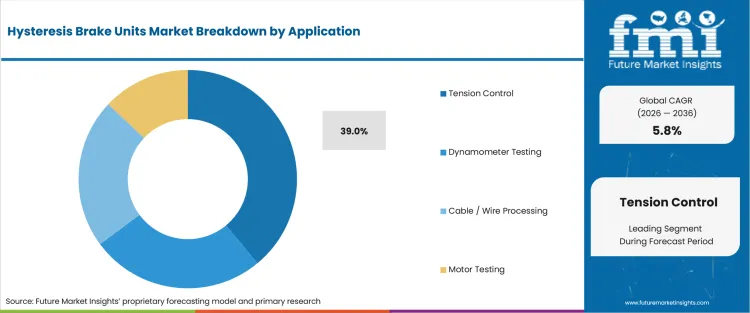
Tension control is estimated to shape application demand as wire and narrow-web equipment need steady resistance during winding and unwinding. Buyers assess hysteresis brake units by smooth torque response and adjustment consistency before moving from trial units to approved supply. National Safety Council reported in its 2026 contact-incidents review stating contact with objects and equipment caused 756 worker deaths in 2024, keeping controlled machine movement and braking evidence close to safety-led equipment reviews.
- Tension control is forecast to capture 39.0% share in 2026, backed by production lines requiring controlled material feed and repeatable brake response.
- Dynamometer testing and motor testing support different account needs across validation and laboratory environments. Tension control attracts attention as buyers compare reduced variation against installation cost and downtime exposure.
How do air-cooled hysteresis brakes shape brake format purchasing?
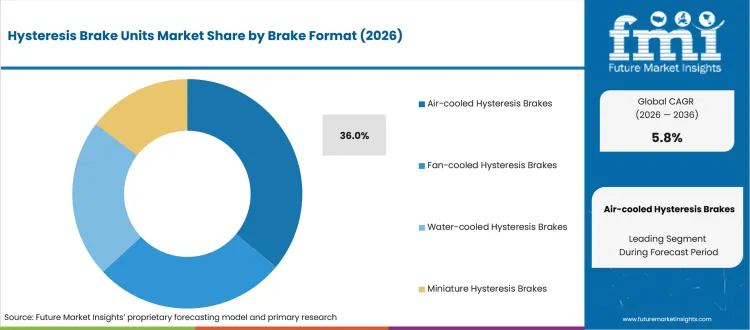
Air-cooled hysteresis brakes are anticipated to provide practical brake-system selection for machinery programs requiring steady operation and simpler integration. Buyers use air-cooled formats to reduce cooling complexity and support repeatable torque performance across moderate-duty applications. International Energy Agency reported in Global Energy Review 2025 stating global electricity demand increased 4.3% in 2024, reinforcing buyer interest in brake designs limiting auxiliary cooling needs during industrial equipment operation.
- Air-cooled hysteresis brakes are expected to hold 36.0% share in 2026, helped by easier installation and lower auxiliary cooling requirements across common equipment programs.
- Fan-cooled and water-cooled formats serve higher heat-duty applications with different service needs. Air-cooled formats gain attention once buyers compare operating simplicity with dependable torque response.
How does textile and wire machinery support end use selection?
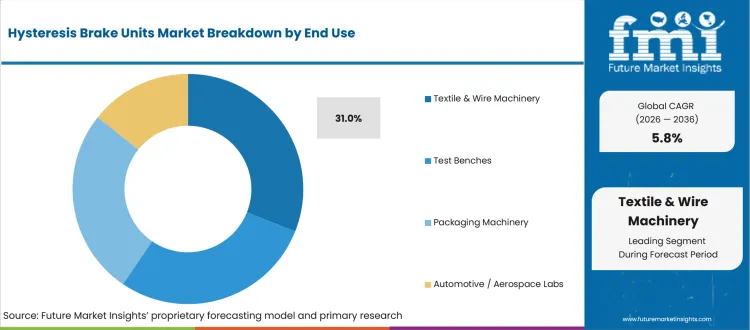
Textile & wire machinery is projected to influence end use demand as controlled braking supports winding and tension accuracy. Equipment builders evaluate brake units through application suitability and repeatable adjustment during production cycles. International Textile Manufacturers Federation reported in its June 20, 2025 shipment statistics stating shipped shuttle-less looms grew 32% in 2024, supporting tension-control equipment review across weaving and material-handling lines.
- Textile & wire machinery is anticipated to account for 31.0% share in 2026, reflected by recurring use in fiber and textile handling equipment.
- Test Benches and packaging machinery create additional demand across validation and production settings. Textile & wire machinery gains supplier attention once brake response affects product consistency and line stability.
For complete segment share split and segment-level forecast, reach out to us.
What are the drivers, restraints, and opportunities in the hysteresis brake units market?
Near-term purchases are shaped by qualification control and application-specific brake evidence outlined below.
- Driver: Machine builders are replacing inconsistent torque-loading methods with hysteresis brake units designed for smooth tension control and repeatable motor-test response.
- Restraint: Adoption slows if buyers lack controller compatibility records or field-service ownership before trial approval.
- Opportunity: Suppliers offering brake units with application notes and clear interface documentation improve approval strength across automated equipment accounts.
Demand is supported by production automation requiring controlled braking inside repeat equipment programs. EtherCAT Technology Group stated in its April 20, 2026 press update stating 16.9 million new EtherCAT nodes were added in 2025, reinforcing automation-device density raising need for matched motion-control and brake-unit specification work.
Restraints center on machine safety and acceptance evidence before buyer sign-off. USA Bureau of Labor Statistics reported in February 2026 claiming 5,070 fatal work injuries were recorded in 2024, making brake documentation and maintenance responsibility harder to separate from purchasing approval.
Opportunity expands as robot installations keep machine builders focused on precise load simulation and compact braking assemblies. International Federation of Robotics reported on September 25, 2025 announcing global operational robot stock to have reached 4,664,000 units in 2024, helping suppliers position hysteresis brake units around serviceable automation and test-system continuity.
What country CAGRs are profiled in the hysteresis brake units market?
.webp "Top Country Growth Comparison Hysteresis Brake Units Market Cagr (2026 2036)")
| Country | CAGR |
|---|---|
| India | 7.5% |
| China | 6.8% |
| South Korea | 5.6% |
| United Kingdom | 5.2% |
| United States | 4.9% |
| Germany | 4.6% |
| Japan | 4.3% |
Source: Future Market Insights proprietary forecasting model and primary research, 2026.
How do country-level CAGRs compare in the hysteresis brake units market?
Country demand is expected to follow automation depth and approval discipline. India and China are anticipated to lead country growth among profiled markets. South Korea and United Kingdom demand is expected to advance through automation density and controlled manufacturing recovery. United States, Germany, and Japan are forecast to move through longer specification reviews linked to machine safety and documentation needs.
- India is projected to expand at 7.5% CAGR through 2036, influenced by factory automation and local production equipment upgrades. Press Information Bureau reported in its January 28, 2026 release, India’s industrial production index rose 7.8% in December 2025 as capital equipment reviews increased brake-unit screening across tension-control assemblies. Local suppliers are anticipated to gain review strength through quick replacement access and application support.
- China account reviews are expected to reflect industrial machinery output and domestic automation supplier depth. National Bureau of Statistics of China reported in its January 20, 2026 release, manufacturing value added increased 6.4% in 2025 amid stronger machine tool and test equipment production. Sales in China are anticipated to advance at 6.8% CAGR from 2026 to 2036, supported through shorter response cycles and fuller torque documentation.
- South Korea purchasing teams are expected to focus on compact automation and tension-control reliability. South Korea is set to rise at 5.6% CAGR through 2036, strengthened by dense automation environments and precise brake-unit selection. USA International Trade Administration reported in its August 28, 2024 release, Korea had 1,012 installed robots per 10,000 manufacturing workers for production systems requiring stable braking response.
- United Kingdom is expected to post 5.2% CAGR through 2036, guided by production recovery and cautious equipment qualification. Office for National Statistics reported in its February 12, 2026 release, annual production output increased 0.2% in 2025 after plant reliability reviews lifted replacement brake assembly interest. Supplier approval is projected to favor clear installation notes and dependable distributor access.
- United States buyers are expected to screen brake units through safety records and domestic manufacturing order signals. USA Census Bureau stated in its June 25, 2026 release, new orders for manufactured durable goods excluding transportation increased 1.3% in May 2026 alongside machinery programs needing documented torque response. Market demand in the United States is likely to grow at 4.9% CAGR over the assessment period, propelled by field troubleshooting needs and acceptance documentation.
- Germany account teams are expected to compare suppliers through certification files and local service response. Germany is estimated to expand at 4.6% CAGR between 2026 and 2036, reinforced by engineering review discipline and automated test-bench activity. Federal Statistical Office of Germany stated in its February 5, 2026 release, manufacturing orders rose 7.8% month on month in December 2025 under machinery-order momentum linked to industrial brake qualification.
- Japan account reviews are projected to reflect precision testing and compact machine design. Cabinet Office of Japan reported in its February 19, 2026 release, machinery orders increased 23.8% in December 2025 across motor-evaluation programs requiring controlled braking. Hysteresis brake units in Japan are expected to post 4.3% CAGR through 2036, shaped by repeatable torque evidence and application support stability.
Who are the notable companies in the hysteresis brake units market?
Magtrol, Placid Industries, Warner Electric, Kendrion, REDEX Group / Merobel, Dover Flexo Electronics, Magnetic Technologies, Nexen Group, Electroid Company, and SINFONIA Technology are the notable companies shaping demand.
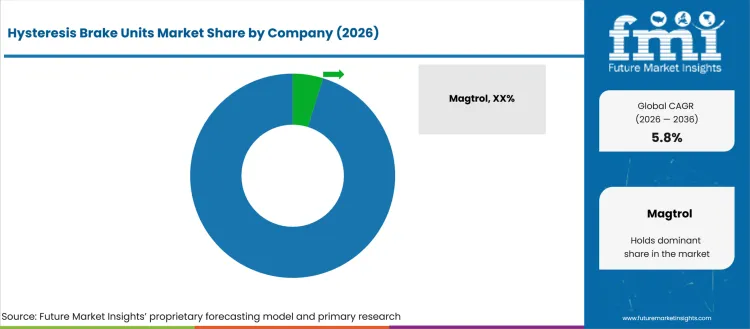
Competition is moderately fragmented across motion component suppliers and application-support providers. Concentration is controlled by product qualification history and access to buyer-facing engineering teams. Multinational suppliers hold wider portfolios and documentation systems. Focused specialists compete in narrow applications led by customization and service proximity.
- Motion component and equipment suppliers such as Magtrol, Placid Industries, Warner Electric, and Kendrion need more than price. Service proximity and field support shape repeat-account consideration.
- Precision engineering and accessory specialists such as REDEX Group / Merobel, Dover Flexo Electronics, and Magnetic Technologies gain account strength from application understanding and tension-control familiarity.
- Distribution and application support partners such as Nexen Group, Electroid Company, and SINFONIA Technology are expected to support replacement demand through local access and technical guidance.
- Application data and local support help vendors stay in repeat-account reviews. Account teams favor groups reducing handoffs between product selection and field support.
Competitive Benchmarking: Hysteresis Brake Units Market
| Company | Portfolio Depth | Brake Format Match | Application Support | Service Reach |
|---|---|---|---|---|
| Magtrol | High | High | High | Global |
| Placid Industries | High | High | High | Global |
| Warner Electric | High | Medium | High | Global |
| Kendrion | High | Medium | High | Global |
| REDEX Group / Merobel | Medium | High | High | Global |
| Dover Flexo Electronics | Medium | High | High | Regional/Global |
| Magnetic Technologies | Medium | Medium | High | Regional |
| Nexen Group | Medium | Medium | Medium | Regional |
| Electroid Company | Medium | Medium | Medium | Regional |
| SINFONIA Technology | Medium | Medium | Medium | Regional/Global |
Source: Future Market Insights competitive analysis, 2026.
Key Developments in the Hysteresis Brake Units Market
- In August 2025, Kendrion agreed to sell its China business and retained ownership of its Permanent Magnet Brake technology. Kendrion stated on August 27, 2025 stating related intellectual property would be licensed to the China entity under a royalty arrangement, keeping brake-technology control important for OEMs reviewing continuity and regional supply exposure.
- In December 2025, Magtrol updated support documentation for dynamometer brake systems and related control equipment. Magtrol’s motor test equipment manuals page listed DES 410 Series Power Supply for Dynamometer Brakes revised in 12/2025 and DSP7010 Dynamometer Controller revised in 11/2025, improving documentation depth for buyers validating test benches and brake-controlled motor evaluation systems.
- In April 2026, Kendrion launched Slim PM Line for servo motors with low to medium torques. Kendrion stated on April 21, 2026 stating Slim PM and High Torque Line shared mechanical and electrical interface, improving brake-family continuity for automation and robotics accounts needing fewer design changes.
Key Players in the Hysteresis Brake Units Market
Motion component and equipment suppliers
- Magtrol
- Placid Industries
- Warner Electric
- Kendrion
Precision engineering and accessory specialists
- REDEX Group / Merobel
- Dover Flexo Electronics
- Magnetic Technologies
Distribution and application support partners
- Nexen Group
- Electroid Company
- SINFONIA Technology
Hysteresis Brake Units Market - Report Scope
| Coverage field | Report scope |
|---|---|
| Market breakdown | Hysteresis Brake Units Market breakdown by torque range, sales channel, application, brake format, end use, and region |
| Market Definition | Hysteresis brake units are magnetic torque-control components designed to create smooth, repeatable braking force for material processing, motor testing, tension control, and automation equipment without friction-contact torque generation. |
| Regions Covered | North America, Latin America, Europe, East Asia, South Asia and Pacific, and Middle East and Africa |
| Countries Covered | United States, China, Germany, Japan, India, United Kingdom, South Korea, and 25+ countries |
| Key Companies Profiled | Magtrol, Placid Industries, Warner Electric, Kendrion, REDEX Group / Merobel, Dover Flexo Electronics, Magnetic Technologies, Nexen Group, Electroid Company, and SINFONIA Technology |
| Forecast Period | 2026 to 2036 |
| Approach | Hybrid bottom-up and top-down methodology using machine tool output, automation component demand, OEM design cycles, retrofit activity, distributor coverage, and country-level industrial equipment indicators. |
Source: Future Market Insights analysis, 2026.
Hysteresis Brake Units Market - Research Methodology
| Method | Approach |
|---|---|
| Primary Research | FMI analysts reviewed inputs from machine builders, automation OEMs, maintenance teams, component distributors, and precision equipment manufacturers. Interviews focused on demand triggers, application match, approval barriers, service ownership, replacement behavior, and practical limits of changing suppliers. |
| Desk Research | Desk research covered company product pages, association references, standards-body sources, and industry statistics. Product alignment was checked against automation uptime, machine accuracy, retrofit compatibility, drive protection, and shorter equipment commissioning cycles. |
| Market Sizing and Forecasting | Market sizing used a hybrid top-down and bottom-up model. Inputs included the 2025 backcast, 2026 base value, 2036 forecast value, segment-share mix, country CAGRs, channel route. |
| Data Validation | Forecasts were checked against source-pool consistency, company portfolio reviews, segment-share alignment, and country-level demand signals. |
Source: Future Market Insights analysis, 2026.
Hysteresis Brake Units Market by Segments
Hysteresis Brake Units Market segmented by Torque Range:
- Low Torque
- Medium Torque
- High Torque
- Ultra-low Torque
- High-heat Duty
Hysteresis Brake Units Market segmented by Sales Channel:
- Direct OEM supply
- Industrial distributors
- System integrators
- Online component platforms
- Service-led supply
Hysteresis Brake Units Market segmented by Application:
- Tension Control
- Dynamometer Testing
- Cable / Wire Processing
- Motor Testing
- Torque Simulation
Hysteresis Brake Units Market segmented by Brake Format:
- Air-cooled Hysteresis Brakes
- Fan-cooled Hysteresis Brakes
- Water-cooled Hysteresis Brakes
- Miniature Hysteresis Brakes
- Base-mounted Hysteresis Brakes
Hysteresis Brake Units Market segmented by End Use:
- Textile & Wire Machinery
- Test Benches
- Packaging Machinery
- Medical / Dental Tool Testing
- Automotive / Aerospace Labs
Hysteresis Brake Units Market by Region
- North America
- United States
- Canada
- Latin America
- Brazil
- Mexico
- Argentina
- Europe
- Germany
- United Kingdom
- France
- Italy
- Spain
- East Asia
- China
- Japan
- South Korea
- South Asia and Pacific
- India
- ASEAN
- Australia and New Zealand
- Middle East and Africa
- GCC countries
- South Africa
- Türkiye
Research Sources and Bibliography
- AMT - The Association For Manufacturing Technology. (2026, February 9). Manufacturing technology orders set record in December 2025.
- Board of Governors of the Federal Reserve System. (2026, June 15). Industrial production and capacity utilization.
- Cabinet Office, Government of Japan. (2026, February 19). Machinery orders in December 2025 and forecast for January-March 2026.
- EtherCAT Technology Group. (2026, April 20). EtherCAT surpasses the 100 million node mark.
- Federal Statistical Office of Germany. (2026, February 5). New orders in manufacturing in December 2025: +7.8% on the previous month.
- International Energy Agency. (2025). Global Energy Review 2025.
- International Federation of Robotics. (2025, September 25). World Robotics 2025 report: Industrial robots.
- International Textile Manufacturers Federation. (2025, June 20). Global textile machinery shipments show mixed performance in 2024.
- Kendrion. (2025, August 27). Kendrion to complete its strategic repositioning as a pure-play industrial company with sale of China business.
- Kendrion. (2026, April 21). New Slim PM Line: Two brakes, one technology - the perfect duo.
- Magtrol. (2024, November 1). ATK-25 Alignment Tool Kit.
- Magtrol. (2024, November 1). FOURAX-700 Multi-Axis Positioner.
- Magtrol. (2025, December). Motor test equipment manuals.
- National Bureau of Statistics of China. (2026, January 20). Industrial production operation in December 2025.
- National Safety Council. (2026). Contact with objects and equipment.
- Office for National Statistics. (2026, February 12). Index of Production, UK: December 2025.
- Press Information Bureau. (2026, January 28). India’s Index of Industrial Production records growth of 7.8 percent in December 2025.
- USA Bureau of Labor Statistics. (2026, February). National Census of Fatal Occupational Injuries in 2024.
- USA Census Bureau. (2026, June 25). Monthly advance report on durable goods manufacturers’ shipments, inventories, and orders: May 2026.
- USA International Trade Administration. (2024, August 28). South Korea robotics industry.
- VDMA. (2026). Mechanical and plant engineering in figures and charts.
- Magtrol. (2025, December). Motor test equipment manuals.
This bibliography is provided for reader reference and is not exhaustive. The full report contains the complete reference list and detailed citations.
This Report Answers
- What value is forecast for the hysteresis brake units market in 2026 and by 2036?
- What CAGR is forecast for the hysteresis brake units market from 2026 to 2036?
- What segments shape demand across torque range, sales channel, application, brake format, and end use?
- How do country CAGRs differ across profiled markets?
- What companies compete through brake-unit depth and application service?
- How does FMI validate forecasts using a hybrid bottom-up and top-down approach?
- What factors should account teams address before account expansion?
- How do torque files and qualification records affect supplier selection?
- What limits return on investment for account teams adding hysteresis brake units to machine programs?
- What supplier capabilities improve long-term account confidence?
Frequently Asked Questions
What is supporting demand in the hysteresis brake units market?
Demand is likely to be supported by machine builders needing repeatable torque control across automated equipment and test benches. Account teams are expected to prefer brake units combining stable resistance and field support.
Who are the key companies in the hysteresis brake units market?
Key companies are anticipated to include Magtrol, Placid Industries, Warner Electric, Kendrion, REDEX Group / Merobel, Dover Flexo Electronics, Magnetic Technologies, Nexen Group, Electroid Company, and SINFONIA Technology. Competition is likely to be based on brake-unit portfolios and regional service coverage.
What is a restraint in the hysteresis brake units market?
Qualification uncertainty remains a practical restraint for account teams reviewing hysteresis brake units across test benches and controlled motion equipment. Accounts slow adoption if torque curves or service responsibilities are not clear before approval.
Why should executives track the hysteresis brake units market?
Executives are expected to track the market as brake selection affects machine uptime and test reliability. Factors such as installation risk and repeat purchase confidence shape buyer reviews.
What business problem does the hysteresis brake units market address?
Market demand addresses a practical motion-control gap for machine builders and material-handling teams needing controlled resistance during repeated equipment cycles. Machine builders and test-bench operators need brake units supporting repeatable torque loading during automated equipment use.
What should account teams evaluate before selecting suppliers?
Account teams are likely to evaluate torque response and technical-file depth before supplier approval. Service access and installation guidance are expected to guide final supplier review.
What limits return on investment for purchasing teams?
Return on investment weakens if brake performance or account acceptance is not proven before installation. Rework and replacement orders reduce expected equipment gains.
How do suppliers build long-term account confidence?
Suppliers build account confidence by providing repeatable torque evidence and responsive application support. Clear documentation and local service access are expected to influence recurring purchase trust.
Preview the report firsthand - request a free sample
Get SampleGet the brochure for pricing and purchase details.
Get PDFTable of Content
- Key Takeaways
- Market Size and CAGR
- Top Growth Driver
- Fastest Growing Segment
- Leading Region
- Key Companies
- Emerging Opportunities
- Executive Summary
- Global Market Outlook
- Demand-side Trends
- Supply-side Trends
- Technology Roadmap Analysis
- Analysis and Recommendations
- Analyst Perspective (What is happening? Why now? What should investors know?)
- Key Questions Answered
- How large is the market?
- What is the CAGR?
- What are key trends?
- Which region dominates?
- Who are the leaders?
- Market Overview
- Market Coverage / Taxonomy
- Market Definition / Scope / Limitations
- Research Methodology
- Chapter Orientation
- Analytical Lens and Working Hypotheses
- Market Structure, Signals, and Trend Drivers
- Benchmarking and Cross-market Comparability
- Market Sizing, Forecasting, and Opportunity Mapping
- Research Design and Evidence Framework
- Desk Research Programme (Secondary Evidence)
- Expert Input and Fieldwork (Primary Evidence)
- Tooling, Models, and Reference Databases
- Data Engineering and Model Build
- Quality Assurance and Audit Trail
- Market Background
- Market Dynamics (Drivers, Restraints, Opportunity, Trends)
- Scenario Forecast (Optimistic, Likely, Conservative)
- Impact Analysis
- AI Impact
- Sustainability Impact
- Regulatory Impact
- Technology Impact
- Consumer / Buyer Analysis
- Purchase Drivers
- Adoption Barriers
- Buyer Journey
- Opportunity Map Analysis
- Product Life Cycle Analysis
- Supply Chain Analysis
- Investment Feasibility Matrix
- Value Chain Analysis
- PESTLE and Porter's Analysis
- Regulatory Landscape
- Regional Parent Market Outlook
- Production and Consumption Statistics
- Import and Export Statistics
- Global Market Analysis and Forecast, 2021 to 2036
- Historical Market Size Value (USD Million) & Volume (Unit) Analysis, 2021 to 2025
- Current and Future Market Size Value (USD Million) & Volume (Unit) Projections, 2026 to 2036
- Y-o-Y Growth Trend Analysis
- Absolute $ Opportunity Analysis
- Global Market Pricing Analysis, 2021 to 2036
- Global Market Analysis and Forecast, By Brake Format, 2021 to 2036
- Introduction / Key Findings
- Historical Market Size Value (USD Million) & Volume (Unit) Analysis By Brake Format, 2021 to 2025
- Current and Future Market Size Value (USD Million) & Volume (Unit) Analysis and Forecast By Brake Format, 2026 to 2036
- Air-cooled Hysteresis Brakes
- Fan-cooled Hysteresis Brakes
- Water-cooled Hysteresis Brakes
- Miniature Hysteresis Brakes
- Air-cooled Hysteresis Brakes
- Y-o-Y Growth Trend Analysis By Brake Format, 2021 to 2025
- Absolute $ Opportunity Analysis By Brake Format, 2026 to 2036
- Global Market Analysis and Forecast, By Torque Range, 2021 to 2036
- Introduction / Key Findings
- Historical Market Size Value (USD Million) & Volume (Unit) Analysis By Torque Range, 2021 to 2025
- Current and Future Market Size Value (USD Million) & Volume (Unit) Analysis and Forecast By Torque Range, 2026 to 2036
- Medium Torque
- Low Torque
- High Torque
- Medium Torque
- Y-o-Y Growth Trend Analysis By Torque Range, 2021 to 2025
- Absolute $ Opportunity Analysis By Torque Range, 2026 to 2036
- Global Market Analysis and Forecast, By Application, 2021 to 2036
- Introduction / Key Findings
- Historical Market Size Value (USD Million) & Volume (Unit) Analysis By Application, 2021 to 2025
- Current and Future Market Size Value (USD Million) & Volume (Unit) Analysis and Forecast By Application, 2026 to 2036
- Tension Control
- Dynamometer Testing
- Cable / Wire Processing
- Motor Testing
- Tension Control
- Y-o-Y Growth Trend Analysis By Application, 2021 to 2025
- Absolute $ Opportunity Analysis By Application, 2026 to 2036
- Global Market Analysis and Forecast, By End Use, 2021 to 2036
- Introduction / Key Findings
- Historical Market Size Value (USD Million) & Volume (Unit) Analysis By End Use, 2021 to 2025
- Current and Future Market Size Value (USD Million) & Volume (Unit) Analysis and Forecast By End Use, 2026 to 2036
- Textile & Wire Machinery
- Test Benches
- Packaging Machinery
- Automotive / Aerospace Labs
- Textile & Wire Machinery
- Y-o-Y Growth Trend Analysis By End Use, 2021 to 2025
- Absolute $ Opportunity Analysis By End Use, 2026 to 2036
- Global Market Analysis and Forecast, By Region, 2021 to 2036
- Introduction
- Historical Market Size Value (USD Million) & Volume (Unit) Analysis By Region, 2021 to 2025
- Current Market Size Value (USD Million) & Volume (Unit) Analysis and Forecast By Region, 2026 to 2036
- North America
- Latin America
- Western Europe
- Eastern Europe
- East Asia
- South Asia and Pacific
- Middle East & Africa
- Market Attractiveness Analysis By Region
- North America Market Analysis and Forecast, By Country, 2021 to 2036
- Historical Market Size Value (USD Million) & Volume (Unit) Trend Analysis By Market Taxonomy, 2021 to 2025
- Market Size Value (USD Million) & Volume (Unit) Forecast By Market Taxonomy, 2026 to 2036
- By Country
- USA
- Canada
- By Brake Format
- By Torque Range
- By Application
- By End Use
- By Country
- Market Attractiveness Analysis
- By Country
- By Brake Format
- By Torque Range
- By Application
- By End Use
- Key Takeaways
- Latin America Market Analysis and Forecast, By Country
- Historical Market Size Value (USD Million) & Volume (Unit) Trend Analysis By Market Taxonomy, 2021 to 2025
- Market Size Value (USD Million) & Volume (Unit) Forecast By Market Taxonomy, 2026 to 2036
- By Country
- Brazil
- Mexico
- Chile
- Rest of Latin America
- By Brake Format
- By Torque Range
- By Application
- By End Use
- By Country
- Market Attractiveness Analysis
- By Country
- By Brake Format
- By Torque Range
- By Application
- By End Use
- Key Takeaways
- Western Europe Market Analysis and Forecast, By Country
- Historical Market Size Value (USD Million) & Volume (Unit) Trend Analysis By Market Taxonomy, 2021 to 2025
- Market Size Value (USD Million) & Volume (Unit) Forecast By Market Taxonomy, 2026 to 2036
- By Country
- Germany
- UK
- Italy
- Spain
- France
- Nordic
- BENELUX
- Rest of Western Europe
- By Brake Format
- By Torque Range
- By Application
- By End Use
- By Country
- Market Attractiveness Analysis
- By Country
- By Brake Format
- By Torque Range
- By Application
- By End Use
- Key Takeaways
- Eastern Europe Market Analysis and Forecast, By Country
- Historical Market Size Value (USD Million) & Volume (Unit) Trend Analysis By Market Taxonomy, 2021 to 2025
- Market Size Value (USD Million) & Volume (Unit) Forecast By Market Taxonomy, 2026 to 2036
- By Country
- Russia
- Poland
- Hungary
- Balkan & Baltic
- Rest of Eastern Europe
- By Brake Format
- By Torque Range
- By Application
- By End Use
- By Country
- Market Attractiveness Analysis
- By Country
- By Brake Format
- By Torque Range
- By Application
- By End Use
- Key Takeaways
- East Asia Market Analysis and Forecast, By Country
- Historical Market Size Value (USD Million) & Volume (Unit) Trend Analysis By Market Taxonomy, 2021 to 2025
- Market Size Value (USD Million) & Volume (Unit) Forecast By Market Taxonomy, 2026 to 2036
- By Country
- China
- Japan
- South Korea
- By Brake Format
- By Torque Range
- By Application
- By End Use
- By Country
- Market Attractiveness Analysis
- By Country
- By Brake Format
- By Torque Range
- By Application
- By End Use
- Key Takeaways
- South Asia and Pacific Market Analysis and Forecast, By Country
- Historical Market Size Value (USD Million) & Volume (Unit) Trend Analysis By Market Taxonomy, 2021 to 2025
- Market Size Value (USD Million) & Volume (Unit) Forecast By Market Taxonomy, 2026 to 2036
- By Country
- India
- ASEAN
- Australia & New Zealand
- Rest of South Asia and Pacific
- By Brake Format
- By Torque Range
- By Application
- By End Use
- By Country
- Market Attractiveness Analysis
- By Country
- By Brake Format
- By Torque Range
- By Application
- By End Use
- Key Takeaways
- Middle East & Africa Market Analysis and Forecast, By Country
- Historical Market Size Value (USD Million) & Volume (Unit) Trend Analysis By Market Taxonomy, 2021 to 2025
- Market Size Value (USD Million) & Volume (Unit) Forecast By Market Taxonomy, 2026 to 2036
- By Country
- Kingdom of Saudi Arabia
- Other GCC Countries
- Türkiye
- South Africa
- Other African Union
- Rest of Middle East & Africa
- By Brake Format
- By Torque Range
- By Application
- By End Use
- By Country
- Market Attractiveness Analysis
- By Country
- By Brake Format
- By Torque Range
- By Application
- By End Use
- Key Takeaways
- Key Countries Market Analysis
- USA
- Pricing Analysis
- Market Share Analysis, 2025
- By Brake Format
- By Torque Range
- By Application
- By End Use
- Canada
- Pricing Analysis
- Market Share Analysis, 2025
- By Brake Format
- By Torque Range
- By Application
- By End Use
- Mexico
- Pricing Analysis
- Market Share Analysis, 2025
- By Brake Format
- By Torque Range
- By Application
- By End Use
- Brazil
- Pricing Analysis
- Market Share Analysis, 2025
- By Brake Format
- By Torque Range
- By Application
- By End Use
- Chile
- Pricing Analysis
- Market Share Analysis, 2025
- By Brake Format
- By Torque Range
- By Application
- By End Use
- Germany
- Pricing Analysis
- Market Share Analysis, 2025
- By Brake Format
- By Torque Range
- By Application
- By End Use
- UK
- Pricing Analysis
- Market Share Analysis, 2025
- By Brake Format
- By Torque Range
- By Application
- By End Use
- Italy
- Pricing Analysis
- Market Share Analysis, 2025
- By Brake Format
- By Torque Range
- By Application
- By End Use
- Spain
- Pricing Analysis
- Market Share Analysis, 2025
- By Brake Format
- By Torque Range
- By Application
- By End Use
- France
- Pricing Analysis
- Market Share Analysis, 2025
- By Brake Format
- By Torque Range
- By Application
- By End Use
- India
- Pricing Analysis
- Market Share Analysis, 2025
- By Brake Format
- By Torque Range
- By Application
- By End Use
- ASEAN
- Pricing Analysis
- Market Share Analysis, 2025
- By Brake Format
- By Torque Range
- By Application
- By End Use
- Australia & New Zealand
- Pricing Analysis
- Market Share Analysis, 2025
- By Brake Format
- By Torque Range
- By Application
- By End Use
- China
- Pricing Analysis
- Market Share Analysis, 2025
- By Brake Format
- By Torque Range
- By Application
- By End Use
- Japan
- Pricing Analysis
- Market Share Analysis, 2025
- By Brake Format
- By Torque Range
- By Application
- By End Use
- South Korea
- Pricing Analysis
- Market Share Analysis, 2025
- By Brake Format
- By Torque Range
- By Application
- By End Use
- Russia
- Pricing Analysis
- Market Share Analysis, 2025
- By Brake Format
- By Torque Range
- By Application
- By End Use
- Poland
- Pricing Analysis
- Market Share Analysis, 2025
- By Brake Format
- By Torque Range
- By Application
- By End Use
- Hungary
- Pricing Analysis
- Market Share Analysis, 2025
- By Brake Format
- By Torque Range
- By Application
- By End Use
- Kingdom of Saudi Arabia
- Pricing Analysis
- Market Share Analysis, 2025
- By Brake Format
- By Torque Range
- By Application
- By End Use
- Türkiye
- Pricing Analysis
- Market Share Analysis, 2025
- By Brake Format
- By Torque Range
- By Application
- By End Use
- South Africa
- Pricing Analysis
- Market Share Analysis, 2025
- By Brake Format
- By Torque Range
- By Application
- By End Use
- USA
- Market Structure Analysis
- Competition Dashboard
- Competition Benchmarking
- Market Share Analysis of Top Players
- By Regional
- By Brake Format
- By Torque Range
- By Application
- By End Use
- Emerging Startups
- Innovation Benchmarking
- Competition Analysis
- Competition Deep Dive
- Magtrol
- Overview
- Product Portfolio
- Profitability by Market Segments (Product/Region/Sales Channel)
- Sales Footprint
- Strategy Overview
- Marketing Strategy
- Product Strategy
- Channel Strategy
- Placid Industries
- Warner Electric
- Kendrion
- Merobel
- Dover Flexo Electronics
- Magnetic Technologies
- Nexen Group
- Electroid
- SINFONIA Technology
- Magtrol
- Case Studies
- Success Stories
- Recent Developments
- Competition Deep Dive
- Assumptions & Acronyms Used


