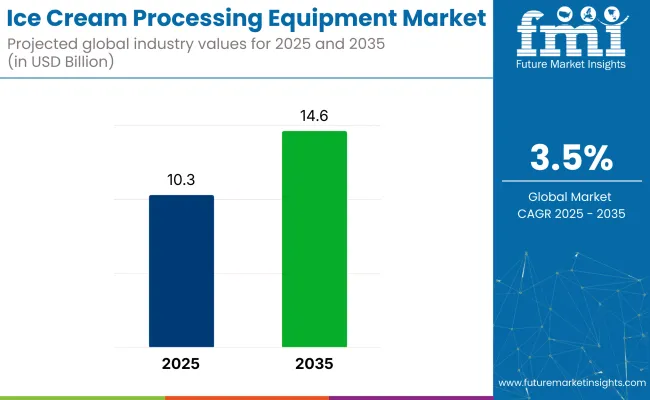
The ice cream processing equipment market is set to grow consistently, with an approximate market value of USD 10.3 billion in 2025 and estimated to reach about USD 14.6 billion by the year 2035, growing at a CAGR of 3.5%. It is driven by some of the factors such as increased demand from consumers and innovation in the production of frozen desserts.
One of the driving forces in the industry is increasing worldwide demand for specialty and premium ice creams such as low-fat, vegan, organic, and functional ones. Due to shifting customer preferences, companies are now investing in flexible machinery capable of blending ingredients and providing accurate temperature and texture controls.
The transformation of smart factories and automation technologies is beginning to change production lines. Today's ice cream processing equipment is computerized, has sensor installations, is operated by programmable logic controllers, and has automatic cleaning systems to make the processes more efficient, to reduce labor costs, and to ensure hygienic conditions for seamless continuous production processes.
Food safety and regulation compliance are also pushing demand for newer technology. Hygiene conditions must be strict, especially in processing dairy products, so companies are embracing stainless steel systems, CIP technologies, and traceability increasingly.
Industry barriers are the high cost of initial capital outlay and maintenance, especially for small to medium-scale producers. However, the long-term benefits in energy savings, production scalability, and product innovation are driving uptake, notably in developing countries where food processing capacity is growing.
Aside from industrial producers, craft and local brands are increasingly popular, necessitating compact, semi-automated machines for small-batch, specialty production. Niche industries driven by popularity in local flavors and personalized ice cream choices also play into this demand.
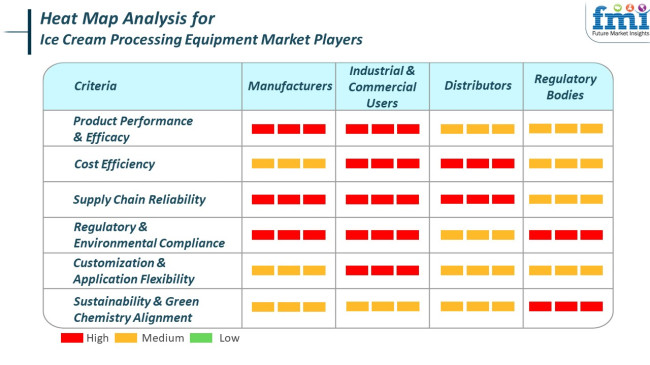
The industry for ice cream processing equipment is growing dramatically as demand accelerates across diverse industries like food and beverages, dairy, and ice cream products. The growth is fueled by factors including the growing demand for effective and automated manufacturing systems, strict government policies, and increased applications in developing industries.
Industrial andcommercial users, like food and beverage, dairy, and frozen desserts industries, appreciate cost-effective and reliable ice cream processing equipment solutions that will ensure the best performance in wide-ranging applications. They seek high-efficiency products, comply with environmental needs, and can be customized to individual operating needs.
Regulatory authorities impose adherence to environmental and safety standards, catalyzing demand for green and sustainable ice cream processing equipment solutions. They catalyze industry development by enforcing regulations that lead to the incorporation of green technology and minimize environmental impact of manufacturing processes.
The ice cream processing machinery industry is marked by cooperation among industry actors in designing and implementing products that are compliant in performance, environmental, and in response to new industry requirements.
During 2020 to 2024, the industryslowly increased with the shift in customers' preferences and globalization of specialty and premium ice cream businesses. Firms were investing increasingly in semi-automatic machines as an effort to address diversifying product needs such as low-fat, lactose-free, and foreign-flavored products.
It was also driven by growing demand for sanitary process spaces and low-maintenance cleaning equipment, particularly following heightened post-pandemic health measures. Elevated energy consumption, maintenance expenses, and intermittent supply chain disruptions left some small makers lagging from building up processes. Growing economies provided opportunity, but slower technology adoption rates were a deterrent.
Looking to 2025 to 2035, the industry should embrace digitization and sustainability. Advanced automation, energy-efficient technologies, and AI-and-IoT-integrated predictive maintenance tools will define equipment development. Flexibility will become a mainstay feature of equipment design, with manufacturers focusing on flexible, modular machines capable of accommodating both conventional and plant-based recipes. As consumers become more demanding of healthier, clean-label ice creams and as environmental considerations gain importance, the drive towards green manufacturing and less waste production will be key to purchasing decisions.
Comparative Market Shift Analysis (2020 to 2024 vs. 2025 to 2035)
| 2020 to 2024 | 2025 to 2035 |
|---|---|
| Increase in artisan and high-end ice cream; emphasis on post-pandemic hygiene | Sustainability, digitalization, and pressure for plant-based formulation |
| Equipment semi-automation and hygiene aspects | AI, IoT integration, energy-efficient modular systems |
| Solid demand in North America and Europe; emerging economies register gradual uptake | Increased global penetration with a focus on Asia-Pacific and Latin America |
| Emphasis on food safety and regular hygiene procedures | Tighter environment and energy efficiency regulations |
| Demand for indulgent, varied flavors with healthy alternatives | Preference for sustainable, low-sugar, plant-based, and artisanal products |
The ice cream processing equipment industry is under the constant pressure of growth on the basis of growing global demand for frozen desserts, technological innovations, and development of the foodservice industry. However, there are different current and future threats that can impact its trajectory.
One of the challenges facing the current industry is maintaining and the cost of advanced ice cream processing machinery. Small and medium enterprises (SMEs) may lack the ability to purchase such machines due to insufficient capital, thus limiting industry access.
Over the next few years, the sector may be challenged by disruptive technological innovation threats and changing consumer attitudes. With every new, improved processing technology developed, current systems may be rendered obsolete, and hence ongoing investment in research and development would be necessary to remain competitive.
Besides, increasing emphasis on energy efficiency and environmental sustainability is compelling governments to push regulations tighter, pushing companies to innovate and overhaul their products to adapt to the new requirements. Non-compliance with these emerging standards might see companies lose industry share.
In addition, more use of Internet of Things (IoT) and intelligent technologies is causing cybersecurity threats since products connected to the Internet could become vulnerable to cyber-attacks, jeopardizing industrial activity.In summary, while the industry for ice cream processing equipment is teeming with unprecedented growth opportunity, players in this industry will have to wrestle with dangers such as large costs of implementation, supply risks, technology becoming obsolete, following regulatory requirements, and cyber risk threats. Foreboding defensive measures against the mentioned risks will be pivotal toward sustainable success within this high-demanding sector.
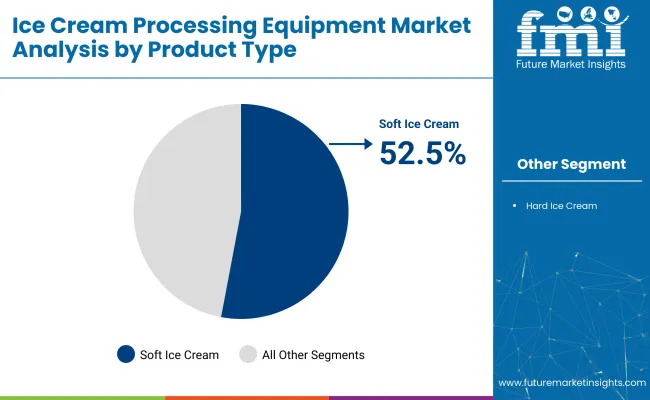
The global industry is segmented in 2025 into soft and hard ice cream processing equipment. Soft ice cream machines would hold the larger share of this at 52.5%, leaving hard ice cream equipment with the remaining 47.5% share.
Soft ice cream equipment sees demand from fast-food restaurants (QSRs), dessert parlors, and convenience stores. The equipment comes in handy for dispensing ice cream at the location, delivering prompt service with the flexibility of customization on flavor and toppings.
While brands like McDonald's and Dairy Queen utilize the soft serve machines at peak hours for a very short turnaround time and quality consistency, some regional chains like Cream Stone (India) and Yogurtland (USAA.) are in the process of purchasing soft serve equipment for their growing number of outlets. Manufacturing companies leading the industry in commercial soft serve production include Taylor Company and Stoelting, mainly known for energy-saving equipment that is easy to use.
However, hard ice cream processing equipment is mainly used for mass production relative to the retail and export industries. The machines were manufactured for batch processing, pasteurizing, homogenizing, and controlled freezing of hard ice cream manufacture to ensure consistency of product characteristics and shelf life with package flexibility.
For industrial-scale production, Unilever (brands Magnum and Cornetto) and General Mills (Häagen-Dazs) rely upon the hard ice cream machinery manufactured by Tetra Pak and Carpigiani. In addition, some small yet dedicated artisan brands like Van Leeuwen and Jeni's Splendid Ice Creams employ small-batch, large-hardened ice cream freezers to preserve handcrafted quality while increasing production.
Both categories will probably grow at a stable pace, with the soft serve equipment having a slight competitive edge due to ease of operation, the consumer demand for on-demand desserts, and global efforts by the QSR industry to ramp up the production and demand in soft serve industries.
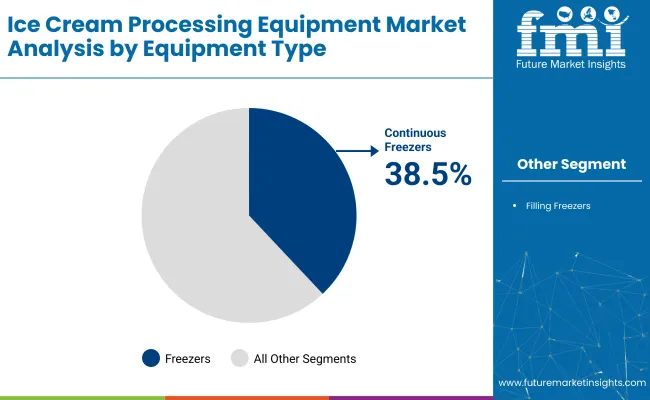
The two most important types of equipment in the industry in 2025 are continuous freezers and mixing equipment. Continuous freezers are expected to contribute a leading part of the industry share, that is, 38.5%, whereas Mixing Equipment will account for approximately 29.5%.
Continuous freezers are essential in the industrial production of ice cream because they introduce an uninterrupted stream of ice cream mix into a frost chamber, thus enabling steady texturing and the incorporation of air. High volumes of consistently high-quality ice cream are manufactured from them, which is why they are crucial to large manufacturers.
Nestlé (owned brands of Drumstick and Häagen-Dazs) and General Mills largely depend on continuous freezing systems in manufacturing ice cream because they streamline the output and produce at lower costs. Apart from companies like Tetra Pak, WCB Ice Cream (SPX FLOW), and Gram Equipment A/S, the leaders in this segment supply fully automated and high-capacity continuous freezers, which are optimized for good hygiene and performance.
The mixing equipment, with a 29.5% hold, is used primarily in the initial stages of ice cream formulation, blending the milk solids and sugars with stabilizers and emulsifiers and adding different flavors into a wholly comprised mix before pasteurization. The increased usage of mixers is due to innovation in flavor combinations and the development of functional ingredients such as high protein or plant-based additives.
Artisan producers like Amul (India), Blue Bell Creameries (USA), and Halo Top have quite a lot of industrial and semi-industrial equipment utilized to produce unique flavor deliveries. Companies such as GEA Group and Alfa Laval are well-known and major suppliers, and they are recognized for their reliable and sanitary designs created for food-grade applications.
Overall, although continuous freezers formulate the bulk of production, mixing equipment is the lifeblood of product innovation and formulation accuracy.
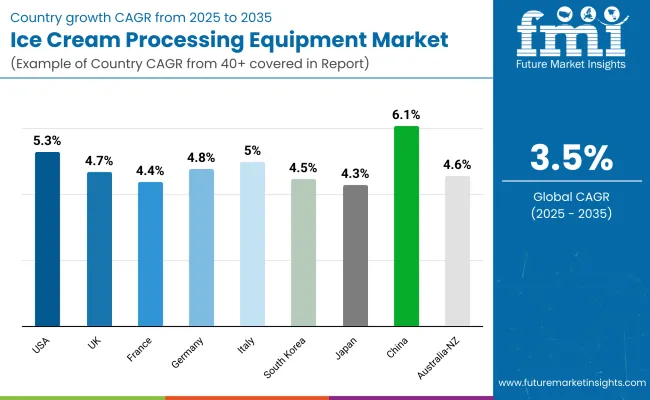
| Countries | CAGR (2025 to 2035) |
|---|---|
| USA | 5.3% |
| UK | 4.7% |
| France | 4.4% |
| Germany | 4.8% |
| Italy | 5 % |
| South Korea | 4.5% |
| Japan | 4.3% |
| China | 6.1% |
| Australia-NZ | 4.6% |
The industry in the USA is expected to grow at 5.3% CAGR over the forecast period. The demand for ice cream processing machinery is expanding in the USA due to the surging demand for artisanal and premium frozen sweets. Increased customer interest in fresh flavors, organic ingredients, and eco-friendly processes is prompting makers to upgrade production lines using advanced, energy-efficient machinery.
Technical innovations in continuous freezers, homogenizers, and pasteurizers are making more uniform product quality and operation efficiency possible. The USA has a mature but very dynamic frozen dessert industry, and large players spend in automation and robotics to be able to catch up with evolving customer demands.
Equipment with the ability to handle high-volume output as well as small-batch customization is playing the lead role. In addition, higher levels of energy efficiency and reduced water and material waste are encouraging manufacturers to launch next-generation technology.
Strategic investment by leading companies and growing demand for plant-based and lactose-free products have also risen for multiproduct processing capacity. Increased control through in-built smart sensors and IoT-based monitoring platforms further encourages control and proactive maintenance, making the American industry more inclined towards continuous growth.
The UKindustry is expected to grow at a 4.7% CAGR during the study period. The industry growth is spurred by changing consumer behavior and the increasing popularity of dairy-free, vegan, and low-sugar ice cream products. The trend is compelling manufacturers to adopt flexible and precise processing equipment.
The appearance of craft and boutique brands alongside traditional manufacturers is propelling demand for advanced mixing, freezing, and packaging technology that will take niche product lines. The UK's focus on food safety needs and sustainability goals is also shaping the investment climate in processing technology. This includes equipment with hygienic design, clean-in-place systems, and reduced environmental impact.
Moreover, automation and process control technologies enable better consistency and reduce labor costs across manufacturing plants. Whereas retail and food service channels seek differentiation through upscale dessert options, manufacturers turn to equipment modernization to deliver speed, quality, and compliance. With issues around trade logistics and availability of staffing, innovation in production methodology continues to underlie a positive trend for the UKindustry.
The French industry will grow at 4.4% CAGR throughout the research period. Gourmet and premium ice cream appreciation in the local industry is compelling manufacturers to invest in efficient and flexible processing solutions. Local flavor distinction and luxury dessert culture are encouraging small producers to expand while maintaining artisanal quality.
As such, there is a greater need for small but high-tech machinery with accurate temperature control and batch adaptability. Sustainability remains a major driver, and there is greater demand for machinery that minimizes waste, conserves energy, and employs recyclable materials for packaging.
Compliance with tough EU food quality and hygiene legislation also drives investment in automated CIP equipment and stainless-steel equipment. Additionally, France's export-oriented frozen dessert industry demands efficient and scalable manufacturing solutions.
With consumers in the region now increasingly preferring organic, lactose-free, and low-calorie alternatives, manufacturers are answering back with machines that enable formulation diversity without compromising on throughput. This balanced emphasis on quality, tradition, and innovation should continue to propel the French industry steadily upward through 2035.
The German industry is expected to register a 4.8% CAGR throughout the study period. The German industry for ice cream processing equipment is dominated by strong manufacturing capacity and a high focus on automation. Consumer requirements for consistent quality over high volumes and high production standards have led to the widespread adoption of advanced process control systems.
Continuous developments in energy-efficient equipment and hygienic design are becoming industry standards in the European industry. The trend towards functional and dietary-specific ice cream products is also impacting equipment requirements, with growing demand for flexible systems capable of handling alternative ingredients.
Equipment designed exclusively for low-temperature processing and fine-mixing functions is becoming of critical importance. In addition, Germany's engineering ethos allows continuing R&D to improve machine construction, resulting in a competitive advantage locally and for export.
Private-label brand expansion and frozen dessert availability on supermarket shelves are also dictating demand for multi-format, high-speed manufacturing lines. Machine builders and dairy product manufacturers will continue to focus on strengthening capabilities and innovation in products that underpin projected growth.
The Italian industry is projected to grow at 5% CAGR during the period under study. Italy's rich gelato culture is a significant driver of demand for tailor-made ice cream processing equipment. Upscale dessert chains and specialty manufacturers are making more investments in small, precision-based machinery in order to maintain traditional flavors and textures while still boosting production quantities.
The reality that world-class equipment manufacturers have facilities in Italy also aids access to technologically sophisticated systems. As consumers become more demanding in their request for low-fat, organic, and dairy-free gelato, processing lines need to be adaptable and compatible with future ingredients.
Modular construction and automation are especially coveted by mid-sized producers wanting to transform without changing product identity. Italy's export-driven dessert industry also emphasizes consistency, hygiene, and international compliance standards. Technological advancements in refrigeration and green systems are also becoming more in demand with sustainability regulations. The evolving food service landscape and requirement for on-premises production capacity within restaurants and specialty stores are driving consistent equipment demand throughout the region.
The South Korean industry is expected to grow at 4.5% CAGR during the study period. The ice cream industry in South Korea is undergoing dynamic change as the demand for novel flavor profiles, healthy products, and high-quality products continues to increase. With customers searching for novelty and international dessert trends, manufacturers are turning towards high-technology processing equipment that will enable them to attain customization and efficient small-batch production.
The industry is distinguished by texture and presentation innovation, which has inspired increased use of precision freezing and aeration technology. Equipment that can process plant-based and low-calorie forms is also growing in importance. Compactness and digital controls are favored due to limited space within city-based plants.
South Korean manufacturers are also applying smart factory technologies, coupling IoT and data analytics on machinery to achieve optimal performance with reduced downtime. Compliance with food safety and energy usage regulations is influencing machinery selection. As the popularity of dessert cafes and packaged ice cream continues to grow, demand for sanitary, automated, and scalable production equipment continues to rise across the region.
Japan's industry is estimated to register a 4.3% CAGR during the period of study. Seasonal influences, sophistication in flavoring tastes, and awareness of health impact the consumption of ice cream in Japan. This has encouraged manufacturers to introduce specialized processing machinery that allows precision in blending ingredients, texturization, and temperature control.
Demand for new frozen treats such as mochi ice cream, matcha gelato, and probiotic desserts has fueled demand for versatile and multi-functional equipment. Space efficiency and rapid automation are central to equipment design, particularly in city manufacturing settings. Concern with product looks and packaging standards also translates to the requirement for advanced filling and sealing machines.
An aging population and eating habits are fueling growth in sugar-free, low-lactose, and soft-texture ice cream industries, prompting manufacturers to invest in tailored processing systems. Moreover, Japan's sustainability push is fueling the growing use of energy-efficient technology and eco-friendly refrigerants. Ongoing collaborations between equipment vendors and food innovators will drive ongoing innovation in production processes to keep the industry dynamic and competitive.
The Chinese industry is projected to grow at 6.1% CAGR during the research period. Urbanization, middle-class growth, and exposure to Western food culture have fueled stunning growth in the ice cream industry. This has come in the form of rising demand for processing equipment with mass production capability, as well as variable formulation compatibility.
Domestic and international companies are investing in high-output, product-consistent, and rapid changeover machinery for different flavors and packaging types. The strength of China's manufacturing industry and the government's emphasis on food processing modernization are also driving the uptake of highly automated lines, with top-of-the-line freezing, homogenizing, and pasteurizing equipment.
Expansion in direct-to-consumer distribution and e-commerce online platforms has also driven expectations of innovation in shelf life stability and packaging, influencing machine choice. Trends towards value ingredients and health-led consumption, like plant-based products, are creating new expectations of equipment ability.
The nation's strategic focus on food hygiene standards and security ensures continued investments in clean and robust systems. With continued expansion of domestic production capacity and export industry opportunities, China is among the fastest-growing industries in this region.
The Australia-New Zealand industry is expected to grow at 4.6% CAGR during the study period. Growth in this industry is supported by increasing demand for health-oriented and artisanal frozen desserts, driven by increased disposable incomes and lifestyle changes. The two countries emphasize clean-label ingredients, prompting manufacturers to invest in equipment that can process organic, vegan, and allergen-free products with no risk of cross-contamination.
The need for locally made ice cream and specialty gelato items has increased the need for adaptable production units suitable for small to medium-scale production. In addition, big dairy firms are refurbishing existing plants with energy-efficient and automated equipment to remain competitive.
The rugged geography of the area encourages the use of rugged, low-maintenance equipment, offering long production cycles with minimal servicing requirements. Adherence to regulatory standards of food safety and environmental regulations also becomes a significant factor in influencing equipment specifications. Demand for temperature control packaging and high-end preservation technology is rising with the expansion of the export business, facilitating long-term industry growth.
The industry for ice cream processing equipment is driven by some leading manufacturers such as Tetra Pak Processing Equipment GmbH, CARPIGIANI Group, ALFA LAVAL, GEA Group Aktiengesellschaft, and Gram Equipment A/S in advancements related to technology and automation in ice cream production. Such manufacturers are extending their processing solutions to meet the increasing demand for premium, artisanal, and plant-based ice-creams.
Tetra Pak Processing Equipment GmbH improved its continuous freezer technology by incorporating AI-driven process control, which optimizes texture consistency while saving energy. CARPIGIANI Group, active in the gelato and soft-serve equipment, has enhanced its global distributor partnership through regional distributors in Asia and Latin America. It has also established an automated batch-freeze for large-volume production of gelato.
ALFA LAVAL is taking care of hygienic design improvements so as to fulfill gradually evolving standards of food safety. It also launched a new energy-efficient pasteurization heat exchanger that directly reduces operation costs for ice cream manufacturers on a large scale. GEA Group Aktiengesellschaft continues to invest in modular production lines so that manufacturers can scale their operations without incurring too much downtime.
Recent innovations consist of AI-driven freezing solutions from Gram Equipment A/S, ensuring precise temperature control to improve texture and shelf-life stability. Technogel SPA and Vojta SRO are developing next-gen extrusion and filling systems, catering to the rising demand for unique ice cream shapes and inclusions. Sustainability initiatives are also feeding competition, as TEKNOICE SRL and CATTA 27 SRL integrate water-saving mechanisms and low-emission refrigeration technologies into their equipment.
Market Share Analysis by Company
| Company Name | Market Share (%) |
|---|---|
| Tetra Pak Processing Equipment GmbH | 18-22% |
| CARPIGIANI Group | 14-18% |
| ALFA LAVAL | 12-16% |
| GEA Group Aktiengesellschaft | 10-14% |
| Gram Equipment A/S | 8-12% |
| Other Players | 24-30% |
| Company Name | Offerings & Activities |
|---|---|
| Tetra Pak Processing Equipment GmbH | Advancing AI-driven freezing technology and launching energy-efficient continuous freezers. |
| CARPIGIANI Group | Expanding gelato and soft-serve machinery portfolio with automated batch-freezing solutions. |
| ALFA LAVAL | Energy-efficient heat exchangers are being introduced for improved pasteurization efficiency. |
| GEA Group Aktiengesellschaft | Investing in modular production lines to allow manufacturers to scale operations efficiently. |
| Gram Equipment A/S | Deploying AI-driven freezing solutions for precise temperature control and product consistency. |
Key Company Insights
Tetra Pak Processing Equipment GmbH (18-22%)
Leading the industry with AI-integrated freezing technology, enhancing product consistency and energy efficiency.
CARPIGIANI Group (14-18%)
Expanding its soft-serve and gelato machinery portfolio while strengthening its distribution network in emerging industries.
ALFA LAVAL (12-16%)
Focusing on energy-efficient pasteurization solutions, aligning with the industry's push for sustainability.
GEA Group Aktiengesellschaft (10-14%)
Driving efficiency in ice cream manufacturing with modular production lines that support high-scale operations.
Gram Equipment A/S (8-12%)
Leveraging AI-driven freezing solutions for improved shelf-life stability and precision cooling.
Other Key Players
By product type, the industry is segmented into soft ice cream processing equipment and hard ice cream processing equipment.
By equipment type, the industry includes mixing equipment, continuous freezers, and filling freezers.
By operation, the industry is categorized by mode of operation into automatic and semi-automatic systems.
Geographically, the industry is segmented into North America, Latin America, Western Europe, Eastern Europe, South Asia and Pacific, East Asia, and Middle East and Africa.
The industry is projected to reach USD 10.3 billion in 2025.
By 2035, the industry is expected to grow to USD 14.6 billion, expanding at a CAGR of 3.5% from 2025 to 2035.
Leading industry players include Tetra Pak Processing Equipment GmbH, CARPIGIANI Group, ALFA LAVAL, GEA Group Aktiengesellschaft, Gram Equipment A/S, Technogel SPA, Vojta SRO, TEKNOICE SRL, CATTA 27 SRL, and Nanjing Puyuan Ice Cream Machinery Manufacturing Co. Ltd.
Growth is fueled by the rising popularity of premium and artisanal ice cream, technological advancements in automated processing systems, and increasing demand for hygienic and energy-efficient machinery.
Asia-Pacific leads with rapid expansion in food processing infrastructure and consumption of frozen treats.


Full Research Suite comprises of:
Market outlook & trends analysis
Interviews & case studies
Strategic recommendations
Vendor profiles & capabilities analysis
5-year forecasts
8 regions and 60+ country-level data splits
Market segment data splits
12 months of continuous data updates
DELIVERED AS:
PDF EXCEL ONLINE
ICE Start And Stop System Market Size and Share Forecast Outlook 2025 to 2035
Ice Boxes Market Size and Share Forecast Outlook 2025 to 2035
Analysis and Growth Projections for Iced Tea Business
Ice Detection System Market Trends, Growth & Forecast 2025 to 2035
Ice Cube Tray Market Trends & Growth Forecast 2024-2034
Ice Maker Machines Market
Ice Transport Buckets Market
Ice Cream Coating Market Size and Share Forecast Outlook 2025 to 2035
Ice-cream Premix and Stabilizers Market Size and Share Forecast Outlook 2025 to 2035
Analysis and Growth Projections for Ice Cream and Frozen Dessert Market from 2025 to 2035
Ice Cream Packaging Market - Outlook 2025 to 2035
Ice Cream Service Supplies Market - Premium Serving Essentials 2025 to 2035
Ice Cream Parlor Market Analysis by Type, Product Type, and Region Through 2035
Breaking Down Market Share in the Ice Cream Parlor Industry
Ice Cream Container Market Size & Trends Forecast 2024-2034
Ice-cream Maker Market
Ice Cream Equipment Market Size and Share Forecast Outlook 2025 to 2035
Rice Bran Fatty Alcohols Market Size and Share Forecast Outlook 2025 to 2035
Rice Water Skincare Market Forecast and Outlook 2025 to 2035
Rice Water Haircare Market Size and Share Forecast Outlook 2025 to 2035

Thank you!
You will receive an email from our Business Development Manager. Please be sure to check your SPAM/JUNK folder too.
Chat With
MaRIA