Instrument Calibration Services Market Size and Share Forecast Outlook 2025 to 2035

The Instrument Calibration Services Market is estimated to be valued at USD 1.8 billion in 2025 and is projected to reach USD 4.3 billion by 2035, registering a compound annual growth rate (CAGR) of 9.0% over the forecast period.
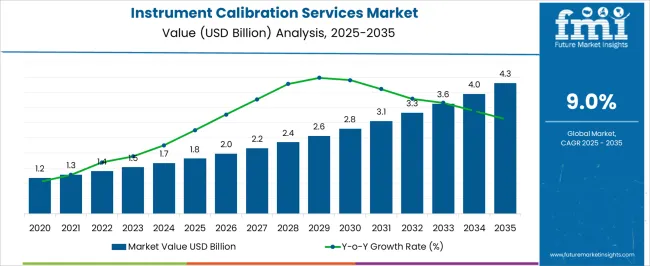
Quick Stats for Instrument Calibration Services Market

  • Instrument Calibration Services Market Value (2025): USD 1.8 billion
  • Instrument Calibration Services Market Forecast Value (2035): USD 4.3 billion
  • Instrument Calibration Services Market Forecast CAGR: 9.0%
  • Leading Segment in Instrument Calibration Services Market in 2025: Electrical Calibration Services (40.0%)
  • Key Growth Regions in Instrument Calibration Services Market: North America, Asia-Pacific, Europe
  • Top Key Players in Instrument Calibration Services Market: Fluke Corporation, Agilent Technologies, Tektronix, Siemens, Keysight Technologies, National Instruments, Rohde & Schwarz, Bosch
Instrument Calibration Services Market Market Value Analysis

Instrument Calibration Services Market Key Takeaways

Metric Value
Instrument Calibration Services Market Estimated Value in (2025 E) USD 1.8 billion
Instrument Calibration Services Market Forecast Value in (2035 F) USD 4.3 billion
Forecast CAGR (2025 to 2035) 9.0%

Why is the Instrument Calibration Services Market Growing?

The Instrument Calibration Services market is experiencing steady expansion, driven by increasing demand for accuracy, compliance, and reliability across various industries. The growing emphasis on safety, precision, and operational efficiency has led to a rise in calibration requirements, especially in sectors where measurement accuracy is critical. The current market is shaped by stricter regulatory frameworks, the adoption of advanced manufacturing processes, and the need for consistent equipment performance.

Calibration services are being utilized to ensure that instruments and measurement devices meet rigorous standards, minimizing errors and improving productivity. In the future, the market is expected to benefit from the integration of digital solutions, including automated calibration systems and cloud-based calibration records, which enhance traceability and reduce downtime.

Investments in aerospace, defense, and industrial automation further support the market’s expansion by increasing the requirement for regular calibration cycles As industries continue to focus on quality assurance and regulatory adherence, the demand for reliable and certified calibration services is expected to grow, presenting significant opportunities for service providers.

Segmental Analysis

The instrument calibration services market is segmented by services, end use, and geographic regions. By services, instrument calibration services market is divided into Electrical Calibration Services, Mass Standards Calibration Services, and Temperature Calibration Services. In terms of end use, instrument calibration services market is classified into Aerospace & Defense, Communication, Electronics, Industrial & Automotive, Pharmaceutical/Biomedical, and Others. Regionally, the instrument calibration services industry is classified into North America, Latin America, Western Europe, Eastern Europe, Balkan & Baltic Countries, Russia & Belarus, Central Asia, East Asia, South Asia & Pacific, and the Middle East & Africa.
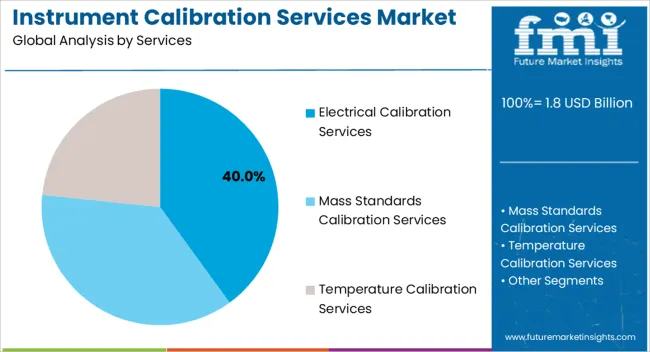
Insights into the Electrical Calibration Services Segment

Instrument Calibration Services Market Analysis By Services

The electrical calibration services segment is expected to account for 40.00% of the overall Instrument Calibration Services market revenue in 2025, establishing it as the leading segment. This prominence is being driven by the extensive use of electrical and electronic measurement instruments across industries requiring precise performance validation. The segment has gained traction due to the rising complexity of electrical systems, along with the need for accurate monitoring and control in sectors such as manufacturing, energy, and healthcare.

Regular calibration is being employed to ensure devices like multimeters, oscilloscopes, and power analyzers maintain optimal accuracy and comply with industry standards. The transition towards automation and smart grids has further reinforced the need for electrical calibration, as small deviations in measurement can lead to significant operational disruptions.

Additionally, strict adherence to safety protocols and compliance requirements has pushed industries to invest in certified electrical calibration services With increasing industrial reliance on energy-efficient and reliable systems, the demand for such services is projected to remain strong, offering sustained growth for service providers.
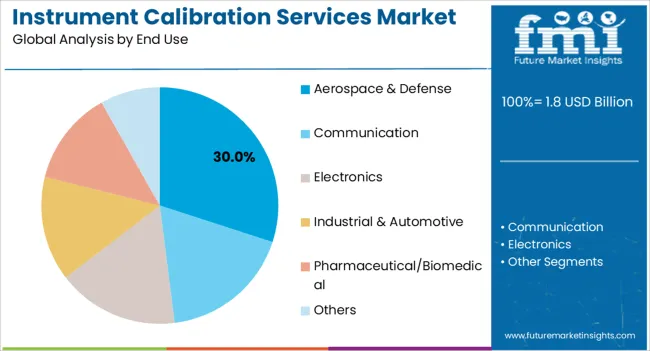
Insights into the Aerospace and Defense End Use Segment

Instrument Calibration Services Market Analysis By End Use

The aerospace and defense end use segment is expected to represent 30.00% of the overall Instrument Calibration Services market revenue in 2025, making it one of the top contributors to market growth. This segment’s importance has been attributed to the stringent performance, safety, and regulatory requirements associated with aerospace and defense equipment. High-precision instruments are widely employed in navigation, communication, propulsion, and defense systems, where even minor measurement inaccuracies can have significant consequences.

Calibration services are being increasingly relied upon to ensure that instruments function within the required tolerances and meet global compliance standards. The segment has been further supported by rising investments in aircraft modernization, advanced defense technologies, and research initiatives that require exact measurement capabilities.

The growing trend of using unmanned systems and complex avionics has also led to a surge in calibration needs As aerospace and defense sectors continue to prioritize reliability, safety, and mission readiness, the requirement for specialized calibration services is expected to strengthen, reinforcing the segment’s leadership in the market.

Market Overview

Instrument Calibration Services Market: Introduction

Instrument calibration is a process used to maintain the accuracy of an instrument. The services through which one can minimize or eliminate the factors that cause inaccurate measurements are known as instrument calibration services.

Specific services offered by the providers of instrument calibration services include on-site calibration, rapid turnaround, calibration documentation, pickup and delivery, online documentation and in-house contract lab service

s. While offering on-site instrument calibration services, suppliers send equipment or personnel for on-site calibration work, which reduces or eliminates the expense of shipping the instrument or taking it off line. In some cases, suppliers also offer pick-up and delivery services to minimize the time and cost associated with using in-house personnel.

While offering rapid turnaround services, suppliers offer quick turnaround on instrument calibration services, usually in a few days.

Instrument calibration services are often considered as an essential part of quality management system. They are undertaken to compare the standard measurement with that of the instrument’s measurement. All industries across the globe are increasingly adopting instrument calibration services at regular intervals in their production processes to identify any faults with instruments at the earliest opportunity.
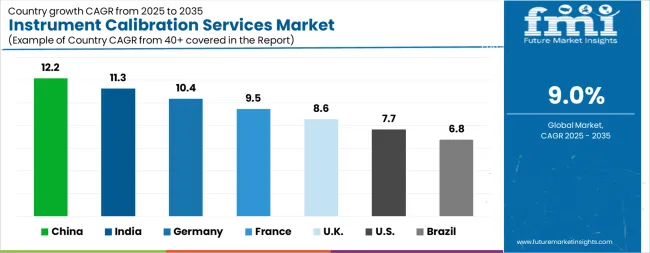
Analysis of Instrument Calibration Services Market By Key Countries

Instrument Calibration Services Market Cagr Analysis By Country
Country CAGR
China 12.2%
India 11.3%
Germany 10.4%
France 9.5%
UK 8.6%
USA 7.7%
Brazil 6.8%

Country-wise Analysis

The Instrument Calibration Services Market is expected to register a CAGR of 9.0% during the forecast period, exhibiting varied country level momentum. China leads with the highest CAGR of 12.2%, followed by India at 11.3%. Developed markets such as Germany, France, and the UK continue to expand steadily, while the USA is likely to grow at consistent rates. Brazil posts the lowest CAGR at 6.8%, yet still underscores a broadly positive trajectory for the global Instrument Calibration Services Market. In 2024, Germany held a dominant revenue in the Western Europe market and is expected to grow with a CAGR of 10.4%. The USA Instrument Calibration Services Market is estimated to be valued at USD 639.0 million in 2025 and is anticipated to reach a valuation of USD 1.3 billion by 2035. Sales are projected to rise at a CAGR of 7.7% over the forecast period between 2025 and 2035. While Japan and South Korea markets are estimated to be valued at USD 92.3 million and USD 60.3 million respectively in 2025.
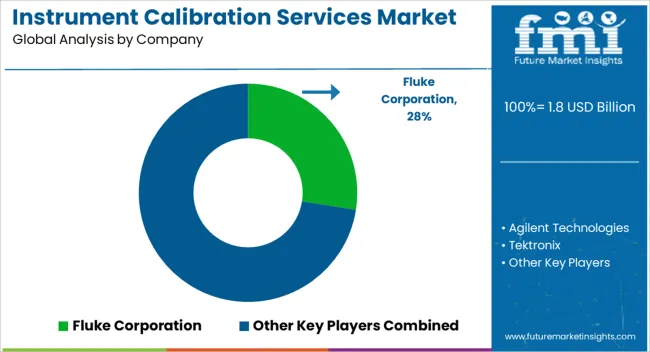
Key Players in the Instrument Calibration Services Market

Instrument Calibration Services Market Analysis By Company
  • Fluke Corporation
  • Agilent Technologies
  • Tektronix
  • Siemens
  • Keysight Technologies
  • National Instruments
  • Rohde & Schwarz
  • Bosch

Scope of the Report

Item Value
Quantitative Units USD 1.8 Billion
Services Electrical Calibration Services, Mass Standards Calibration Services, and Temperature Calibration Services
End Use Aerospace & Defense, Communication, Electronics, Industrial & Automotive, Pharmaceutical/Biomedical, and Others
Regions Covered North America, Europe, Asia-Pacific, Latin America, Middle East & Africa
Country Covered United States, Canada, Germany, France, United Kingdom, China, Japan, India, Brazil, South Africa
Key Companies Profiled Fluke Corporation, Agilent Technologies, Tektronix, Siemens, Keysight Technologies, National Instruments, Rohde & Schwarz, and Bosch

Instrument Calibration Services Market by Segments

Services:

  • Electrical Calibration Services
  • Mass Standards Calibration Services
  • Temperature Calibration Services

End Use:

  • Aerospace & Defense
  • Communication
  • Electronics
  • Industrial & Automotive
  • Pharmaceutical/Biomedical
  • Others

Region:

  • North America
    • USA
    • Canada
    • Mexico
  • Latin America
    • Brazil
    • Chile
    • Rest of Latin America
  • Western Europe
    • Germany
    • UK
    • Italy
    • Spain
    • France
    • Nordic
    • BENELUX
    • Rest of Western Europe
  • Eastern Europe
    • Russia
    • Poland
    • Hungary
    • Balkan & Baltic
    • Rest of Eastern Europe
  • East Asia
    • China
    • Japan
    • South Korea
  • South Asia and Pacific
    • India
    • ASEAN
    • Australia & New Zealand
    • Rest of South Asia and Pacific
  • Middle East & Africa
    • Kingdom of Saudi Arabia
    • Other GCC Countries
    • Turkiye
    • South Africa
    • Other African Union
    • Rest of Middle East & Africa

Table of Content

  1. Executive Summary
    • Global Market Outlook
    • Demand-side Trends
    • Supply-side Trends
    • Technology Roadmap Analysis
    • Analysis and Recommendations
  2. Market Overview
    • Market Coverage / Taxonomy
    • Market Definition / Scope / Limitations
  3. Market Background
    • Market Dynamics
      • Drivers
      • Restraints
      • Opportunity
      • Trends
    • Scenario Forecast
      • Demand in Optimistic Scenario
      • Demand in Likely Scenario
      • Demand in Conservative Scenario
    • Opportunity Map Analysis
    • Product Life Cycle Analysis
    • Supply Chain Analysis
    • Investment Feasibility Matrix
    • Value Chain Analysis
    • PESTLE and Porter’s Analysis
    • Regulatory Landscape
    • Regional Parent Market Outlook
    • Production and Consumption Statistics
    • Import and Export Statistics
  4. Global Market Analysis 2020 to 2024 and Forecast, 2025 to 2035
    • Historical Market Size Value (USD Million) Analysis, 2020 to 2024
    • Current and Future Market Size Value (USD Million) Projections, 2025 to 2035
      • Y-o-Y Growth Trend Analysis
      • Absolute $ Opportunity Analysis
  5. Global Market Pricing Analysis 2020 to 2024 and Forecast 2025 to 2035
  6. Global Market Analysis 2020 to 2024 and Forecast 2025 to 2035, By Services
    • Introduction / Key Findings
    • Historical Market Size Value (USD Million) Analysis By Services , 2020 to 2024
    • Current and Future Market Size Value (USD Million) Analysis and Forecast By Services , 2025 to 2035
      • Electrical Calibration Services
      • Mass Standards Calibration Services
      • Temperature Calibration Services
    • Y-o-Y Growth Trend Analysis By Services , 2020 to 2024
    • Absolute $ Opportunity Analysis By Services , 2025 to 2035
  7. Global Market Analysis 2020 to 2024 and Forecast 2025 to 2035, By End Use
    • Introduction / Key Findings
    • Historical Market Size Value (USD Million) Analysis By End Use, 2020 to 2024
    • Current and Future Market Size Value (USD Million) Analysis and Forecast By End Use, 2025 to 2035
      • Aerospace & Defense
      • Communication
      • Electronics
      • Industrial & Automotive
      • Pharmaceutical/Biomedical
      • Others
    • Y-o-Y Growth Trend Analysis By End Use, 2020 to 2024
    • Absolute $ Opportunity Analysis By End Use, 2025 to 2035
  8. Global Market Analysis 2020 to 2024 and Forecast 2025 to 2035, By Region
    • Introduction
    • Historical Market Size Value (USD Million) Analysis By Region, 2020 to 2024
    • Current Market Size Value (USD Million) Analysis and Forecast By Region, 2025 to 2035
      • North America
      • Latin America
      • Western Europe
      • Eastern Europe
      • East Asia
      • South Asia and Pacific
      • Middle East & Africa
    • Market Attractiveness Analysis By Region
  9. North America Market Analysis 2020 to 2024 and Forecast 2025 to 2035, By Country
    • Historical Market Size Value (USD Million) Trend Analysis By Market Taxonomy, 2020 to 2024
    • Market Size Value (USD Million) Forecast By Market Taxonomy, 2025 to 2035
      • By Country
        • USA
        • Canada
        • Mexico
      • By Services
      • By End Use
    • Market Attractiveness Analysis
      • By Country
      • By Services
      • By End Use
    • Key Takeaways
  10. Latin America Market Analysis 2020 to 2024 and Forecast 2025 to 2035, By Country
    • Historical Market Size Value (USD Million) Trend Analysis By Market Taxonomy, 2020 to 2024
    • Market Size Value (USD Million) Forecast By Market Taxonomy, 2025 to 2035
      • By Country
        • Brazil
        • Chile
        • Rest of Latin America
      • By Services
      • By End Use
    • Market Attractiveness Analysis
      • By Country
      • By Services
      • By End Use
    • Key Takeaways
  11. Western Europe Market Analysis 2020 to 2024 and Forecast 2025 to 2035, By Country
    • Historical Market Size Value (USD Million) Trend Analysis By Market Taxonomy, 2020 to 2024
    • Market Size Value (USD Million) Forecast By Market Taxonomy, 2025 to 2035
      • By Country
        • Germany
        • UK
        • Italy
        • Spain
        • France
        • Nordic
        • BENELUX
        • Rest of Western Europe
      • By Services
      • By End Use
    • Market Attractiveness Analysis
      • By Country
      • By Services
      • By End Use
    • Key Takeaways
  12. Eastern Europe Market Analysis 2020 to 2024 and Forecast 2025 to 2035, By Country
    • Historical Market Size Value (USD Million) Trend Analysis By Market Taxonomy, 2020 to 2024
    • Market Size Value (USD Million) Forecast By Market Taxonomy, 2025 to 2035
      • By Country
        • Russia
        • Poland
        • Hungary
        • Balkan & Baltic
        • Rest of Eastern Europe
      • By Services
      • By End Use
    • Market Attractiveness Analysis
      • By Country
      • By Services
      • By End Use
    • Key Takeaways
  13. East Asia Market Analysis 2020 to 2024 and Forecast 2025 to 2035, By Country
    • Historical Market Size Value (USD Million) Trend Analysis By Market Taxonomy, 2020 to 2024
    • Market Size Value (USD Million) Forecast By Market Taxonomy, 2025 to 2035
      • By Country
        • China
        • Japan
        • South Korea
      • By Services
      • By End Use
    • Market Attractiveness Analysis
      • By Country
      • By Services
      • By End Use
    • Key Takeaways
  14. South Asia and Pacific Market Analysis 2020 to 2024 and Forecast 2025 to 2035, By Country
    • Historical Market Size Value (USD Million) Trend Analysis By Market Taxonomy, 2020 to 2024
    • Market Size Value (USD Million) Forecast By Market Taxonomy, 2025 to 2035
      • By Country
        • India
        • ASEAN
        • Australia & New Zealand
        • Rest of South Asia and Pacific
      • By Services
      • By End Use
    • Market Attractiveness Analysis
      • By Country
      • By Services
      • By End Use
    • Key Takeaways
  15. Middle East & Africa Market Analysis 2020 to 2024 and Forecast 2025 to 2035, By Country
    • Historical Market Size Value (USD Million) Trend Analysis By Market Taxonomy, 2020 to 2024
    • Market Size Value (USD Million) Forecast By Market Taxonomy, 2025 to 2035
      • By Country
        • Kingdom of Saudi Arabia
        • Other GCC Countries
        • Turkiye
        • South Africa
        • Other African Union
        • Rest of Middle East & Africa
      • By Services
      • By End Use
    • Market Attractiveness Analysis
      • By Country
      • By Services
      • By End Use
    • Key Takeaways
  16. Key Countries Market Analysis
    • USA
      • Pricing Analysis
      • Market Share Analysis, 2024
        • By Services
        • By End Use
    • Canada
      • Pricing Analysis
      • Market Share Analysis, 2024
        • By Services
        • By End Use
    • Mexico
      • Pricing Analysis
      • Market Share Analysis, 2024
        • By Services
        • By End Use
    • Brazil
      • Pricing Analysis
      • Market Share Analysis, 2024
        • By Services
        • By End Use
    • Chile
      • Pricing Analysis
      • Market Share Analysis, 2024
        • By Services
        • By End Use
    • Germany
      • Pricing Analysis
      • Market Share Analysis, 2024
        • By Services
        • By End Use
    • UK
      • Pricing Analysis
      • Market Share Analysis, 2024
        • By Services
        • By End Use
    • Italy
      • Pricing Analysis
      • Market Share Analysis, 2024
        • By Services
        • By End Use
    • Spain
      • Pricing Analysis
      • Market Share Analysis, 2024
        • By Services
        • By End Use
    • France
      • Pricing Analysis
      • Market Share Analysis, 2024
        • By Services
        • By End Use
    • India
      • Pricing Analysis
      • Market Share Analysis, 2024
        • By Services
        • By End Use
    • ASEAN
      • Pricing Analysis
      • Market Share Analysis, 2024
        • By Services
        • By End Use
    • Australia & New Zealand
      • Pricing Analysis
      • Market Share Analysis, 2024
        • By Services
        • By End Use
    • China
      • Pricing Analysis
      • Market Share Analysis, 2024
        • By Services
        • By End Use
    • Japan
      • Pricing Analysis
      • Market Share Analysis, 2024
        • By Services
        • By End Use
    • South Korea
      • Pricing Analysis
      • Market Share Analysis, 2024
        • By Services
        • By End Use
    • Russia
      • Pricing Analysis
      • Market Share Analysis, 2024
        • By Services
        • By End Use
    • Poland
      • Pricing Analysis
      • Market Share Analysis, 2024
        • By Services
        • By End Use
    • Hungary
      • Pricing Analysis
      • Market Share Analysis, 2024
        • By Services
        • By End Use
    • Kingdom of Saudi Arabia
      • Pricing Analysis
      • Market Share Analysis, 2024
        • By Services
        • By End Use
    • Turkiye
      • Pricing Analysis
      • Market Share Analysis, 2024
        • By Services
        • By End Use
    • South Africa
      • Pricing Analysis
      • Market Share Analysis, 2024
        • By Services
        • By End Use
  17. Market Structure Analysis
    • Competition Dashboard
    • Competition Benchmarking
    • Market Share Analysis of Top Players
      • By Regional
      • By Services
      • By End Use
  18. Competition Analysis
    • Competition Deep Dive
      • Fluke Corporation
        • Overview
        • Product Portfolio
        • Profitability by Market Segments (Product/Age /Sales Channel/Region)
        • Sales Footprint
        • Strategy Overview
          • Marketing Strategy
          • Product Strategy
          • Channel Strategy
      • Agilent Technologies
      • Tektronix
      • Siemens
      • Keysight Technologies
      • National Instruments
      • Rohde & Schwarz
      • Bosch
  19. Assumptions & Acronyms Used
  20. Research Methodology

List of Tables

  • Table 1: Global Market Value (USD Million) Forecast by Region, 2020-2035
  • Table 2: Global Market Value (USD Million) Forecast by Services , 2020-2035
  • Table 3: Global Market Value (USD Million) Forecast by End Use, 2020-2035
  • Table 4: North America Market Value (USD Million) Forecast by Country, 2020-2035
  • Table 5: North America Market Value (USD Million) Forecast by Services , 2020-2035
  • Table 6: North America Market Value (USD Million) Forecast by End Use, 2020-2035
  • Table 7: Latin America Market Value (USD Million) Forecast by Country, 2020-2035
  • Table 8: Latin America Market Value (USD Million) Forecast by Services , 2020-2035
  • Table 9: Latin America Market Value (USD Million) Forecast by End Use, 2020-2035
  • Table 10: Western Europe Market Value (USD Million) Forecast by Country, 2020-2035
  • Table 11: Western Europe Market Value (USD Million) Forecast by Services , 2020-2035
  • Table 12: Western Europe Market Value (USD Million) Forecast by End Use, 2020-2035
  • Table 13: Eastern Europe Market Value (USD Million) Forecast by Country, 2020-2035
  • Table 14: Eastern Europe Market Value (USD Million) Forecast by Services , 2020-2035
  • Table 15: Eastern Europe Market Value (USD Million) Forecast by End Use, 2020-2035
  • Table 16: East Asia Market Value (USD Million) Forecast by Country, 2020-2035
  • Table 17: East Asia Market Value (USD Million) Forecast by Services , 2020-2035
  • Table 18: East Asia Market Value (USD Million) Forecast by End Use, 2020-2035
  • Table 19: South Asia and Pacific Market Value (USD Million) Forecast by Country, 2020-2035
  • Table 20: South Asia and Pacific Market Value (USD Million) Forecast by Services , 2020-2035
  • Table 21: South Asia and Pacific Market Value (USD Million) Forecast by End Use, 2020-2035
  • Table 22: Middle East & Africa Market Value (USD Million) Forecast by Country, 2020-2035
  • Table 23: Middle East & Africa Market Value (USD Million) Forecast by Services , 2020-2035
  • Table 24: Middle East & Africa Market Value (USD Million) Forecast by End Use, 2020-2035

List of Figures

  • Figure 1: Global Market Pricing Analysis
  • Figure 2: Global Market Value (USD Million) Forecast 2020-2035
  • Figure 3: Global Market Value Share and BPS Analysis by Services , 2025 and 2035
  • Figure 4: Global Market Y-o-Y Growth Comparison by Services , 2025-2035
  • Figure 5: Global Market Attractiveness Analysis by Services
  • Figure 6: Global Market Value Share and BPS Analysis by End Use, 2025 and 2035
  • Figure 7: Global Market Y-o-Y Growth Comparison by End Use, 2025-2035
  • Figure 8: Global Market Attractiveness Analysis by End Use
  • Figure 9: Global Market Value (USD Million) Share and BPS Analysis by Region, 2025 and 2035
  • Figure 10: Global Market Y-o-Y Growth Comparison by Region, 2025-2035
  • Figure 11: Global Market Attractiveness Analysis by Region
  • Figure 12: North America Market Incremental Dollar Opportunity, 2025-2035
  • Figure 13: Latin America Market Incremental Dollar Opportunity, 2025-2035
  • Figure 14: Western Europe Market Incremental Dollar Opportunity, 2025-2035
  • Figure 15: Eastern Europe Market Incremental Dollar Opportunity, 2025-2035
  • Figure 16: East Asia Market Incremental Dollar Opportunity, 2025-2035
  • Figure 17: South Asia and Pacific Market Incremental Dollar Opportunity, 2025-2035
  • Figure 18: Middle East & Africa Market Incremental Dollar Opportunity, 2025-2035
  • Figure 19: North America Market Value Share and BPS Analysis by Country, 2025 and 2035
  • Figure 20: North America Market Value Share and BPS Analysis by Services , 2025 and 2035
  • Figure 21: North America Market Y-o-Y Growth Comparison by Services , 2025-2035
  • Figure 22: North America Market Attractiveness Analysis by Services
  • Figure 23: North America Market Value Share and BPS Analysis by End Use, 2025 and 2035
  • Figure 24: North America Market Y-o-Y Growth Comparison by End Use, 2025-2035
  • Figure 25: North America Market Attractiveness Analysis by End Use
  • Figure 26: Latin America Market Value Share and BPS Analysis by Country, 2025 and 2035
  • Figure 27: Latin America Market Value Share and BPS Analysis by Services , 2025 and 2035
  • Figure 28: Latin America Market Y-o-Y Growth Comparison by Services , 2025-2035
  • Figure 29: Latin America Market Attractiveness Analysis by Services
  • Figure 30: Latin America Market Value Share and BPS Analysis by End Use, 2025 and 2035
  • Figure 31: Latin America Market Y-o-Y Growth Comparison by End Use, 2025-2035
  • Figure 32: Latin America Market Attractiveness Analysis by End Use
  • Figure 33: Western Europe Market Value Share and BPS Analysis by Country, 2025 and 2035
  • Figure 34: Western Europe Market Value Share and BPS Analysis by Services , 2025 and 2035
  • Figure 35: Western Europe Market Y-o-Y Growth Comparison by Services , 2025-2035
  • Figure 36: Western Europe Market Attractiveness Analysis by Services
  • Figure 37: Western Europe Market Value Share and BPS Analysis by End Use, 2025 and 2035
  • Figure 38: Western Europe Market Y-o-Y Growth Comparison by End Use, 2025-2035
  • Figure 39: Western Europe Market Attractiveness Analysis by End Use
  • Figure 40: Eastern Europe Market Value Share and BPS Analysis by Country, 2025 and 2035
  • Figure 41: Eastern Europe Market Value Share and BPS Analysis by Services , 2025 and 2035
  • Figure 42: Eastern Europe Market Y-o-Y Growth Comparison by Services , 2025-2035
  • Figure 43: Eastern Europe Market Attractiveness Analysis by Services
  • Figure 44: Eastern Europe Market Value Share and BPS Analysis by End Use, 2025 and 2035
  • Figure 45: Eastern Europe Market Y-o-Y Growth Comparison by End Use, 2025-2035
  • Figure 46: Eastern Europe Market Attractiveness Analysis by End Use
  • Figure 47: East Asia Market Value Share and BPS Analysis by Country, 2025 and 2035
  • Figure 48: East Asia Market Value Share and BPS Analysis by Services , 2025 and 2035
  • Figure 49: East Asia Market Y-o-Y Growth Comparison by Services , 2025-2035
  • Figure 50: East Asia Market Attractiveness Analysis by Services
  • Figure 51: East Asia Market Value Share and BPS Analysis by End Use, 2025 and 2035
  • Figure 52: East Asia Market Y-o-Y Growth Comparison by End Use, 2025-2035
  • Figure 53: East Asia Market Attractiveness Analysis by End Use
  • Figure 54: South Asia and Pacific Market Value Share and BPS Analysis by Country, 2025 and 2035
  • Figure 55: South Asia and Pacific Market Value Share and BPS Analysis by Services , 2025 and 2035
  • Figure 56: South Asia and Pacific Market Y-o-Y Growth Comparison by Services , 2025-2035
  • Figure 57: South Asia and Pacific Market Attractiveness Analysis by Services
  • Figure 58: South Asia and Pacific Market Value Share and BPS Analysis by End Use, 2025 and 2035
  • Figure 59: South Asia and Pacific Market Y-o-Y Growth Comparison by End Use, 2025-2035
  • Figure 60: South Asia and Pacific Market Attractiveness Analysis by End Use
  • Figure 61: Middle East & Africa Market Value Share and BPS Analysis by Country, 2025 and 2035
  • Figure 62: Middle East & Africa Market Value Share and BPS Analysis by Services , 2025 and 2035
  • Figure 63: Middle East & Africa Market Y-o-Y Growth Comparison by Services , 2025-2035
  • Figure 64: Middle East & Africa Market Attractiveness Analysis by Services
  • Figure 65: Middle East & Africa Market Value Share and BPS Analysis by End Use, 2025 and 2035
  • Figure 66: Middle East & Africa Market Y-o-Y Growth Comparison by End Use, 2025-2035
  • Figure 67: Middle East & Africa Market Attractiveness Analysis by End Use
  • Figure 68: Global Market - Tier Structure Analysis
  • Figure 69: Global Market - Company Share Analysis

Frequently Asked Questions

How big is the instrument calibration services market in 2025?

The global instrument calibration services market is estimated to be valued at USD 1.8 billion in 2025.

What will be the size of instrument calibration services market in 2035?

The market size for the instrument calibration services market is projected to reach USD 4.3 billion by 2035.

How much will be the instrument calibration services market growth between 2025 and 2035?

The instrument calibration services market is expected to grow at a 9.0% CAGR between 2025 and 2035.

What are the key product types in the instrument calibration services market?

The key product types in instrument calibration services market are electrical calibration services, mass standards calibration services and temperature calibration services.

Which end use segment to contribute significant share in the instrument calibration services market in 2025?

In terms of end use, aerospace & defense segment to command 30.0% share in the instrument calibration services market in 2025.

Explore Similar Insights

Future Market Insights

Instrument Calibration Services Market

Chat With MaRIA

Chat With

MaRIA

Hi There, I am MaRIA, Your Market Research Intelligence Assistant. How may I help you?