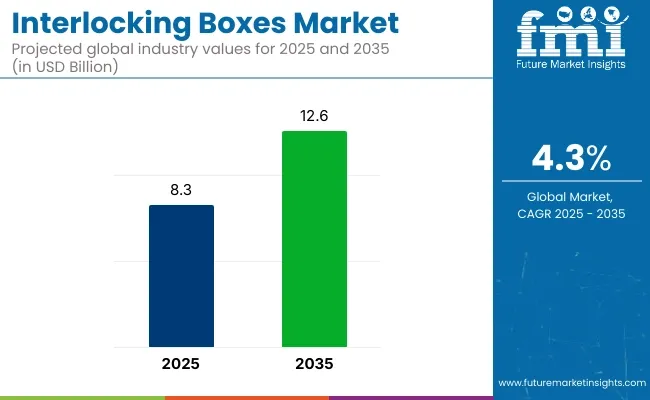
The interlocking boxes market is projected to grow from USD 8.3 billion in 2025 to USD 12.6 billion by 2035, registering a CAGR of 4.3% during the forecast period. Sales in 2024 reached USD 8.1 billion, reflecting a steady increase in demand across various industries.
This growth has been attributed to the rising need for durable and efficient packaging solutions in sectors such as e-commerce, retail, food and beverage, and pharmaceuticals. The increasing adoption of interlocking boxes for products like electronics, cosmetics, and consumer goods has further propelled the market's expansion. Additionally, the surge in online shopping and the demand for secure packaging have led to a higher utilization of advanced interlocking box technologies globally.
| Attributes | Description |
|---|---|
| Estimated Market Size (2025E) | USD 8.3 billion |
| Projected Market Value (2035F) | USD 12.6 billion |
| Value-based CAGR (2025 to 2035) | 4.3% |
BOX Partners, LLC a leading wholesaler of packaging, shipping, and industrial supplies, has announced its acquisition of The Packaging Wholesalers business, a fellow nationwide packaging distributor with more than 20-year track record of success. “TPW has enjoyed incredible growth and success over the years, but joining with BOX has been a long-term goal of mine.”
Said TPW President and CEO Mike Hrbacek. “I believe this partnership of TPW’s strategically located distribution centers and BOX’s wide product selection solidifies us as the leader in wholesale distribution nationwide. I look forward to creating a better business together.”
The shift towards sustainable and environmentally friendly solutions has significantly influenced the interlocking boxes market. Manufacturers have been focusing on developing boxes that are recyclable, biodegradable, and made from renewable resources. Innovations include the integration of biodegradable materials, modular designs, and the use of recycled components to reduce environmental impact.
These advancements align with global sustainability goals and regulatory requirements, making interlocking boxes an attractive option for environmentally conscious industries. Additionally, the development of automated manufacturing processes has enhanced efficiency and consistency in production, further driving market growth.
The interlocking boxes market is poised for significant growth, driven by increasing demand in e-commerce, retail, food and beverage, and pharmaceutical industries. Companies investing in sustainable materials, innovative designs, and eco-friendly production processes are expected to gain a competitive edge.
As global supply chains expand and environmental regulations become more stringent, the adoption of interlocking boxes is anticipated to rise, offering cost-effective and eco-friendly solutions for product packaging and transportation. Furthermore, the integration of smart technologies and automation in interlocking box applications is expected to enhance operational efficiency and meet the evolving needs of various industries.
The below table presents the expected CAGR for the global interlocking boxes market over several semi-annual periods spanning from 2025 to 2035. In the first half (H1) of the decade from 2024 to 2034, the business is predicted to surge at a CAGR of 4.2%, followed by a higher slight high growth rate of 4.4% in the second half (H2) of the same decade.
| Particular | Value CAGR |
|---|---|
| H1 (2024 to 2034) | 4.2% |
| H2 (2024 to 2034) | 4.4% |
| H1 (2025 to 2035) | 3.9% |
| H2 (2025 to 2035) | 4.7% |
Moving into the subsequent period, from H1 2024 to H2 2035, the CAGR is projected to decrease to 3.9% in the first half and increase to 4.7% in the second half. In the first half (H1) the market witnessed a decrease of 30 BPS while in the second half (H2), the market witnessed an increase of 30 BPS.
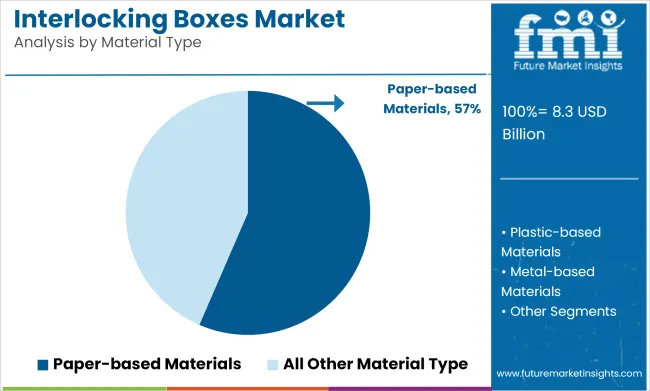
Paper-based interlocking boxes are projected to account for approximately 56.5% of the global interlocking boxes market by 2025, as their widespread use has been driven by environmental sustainability, ease of customization, and cost efficiency. Constructed from corrugated or kraft paperboard, these boxes have been preferred for their lightweight structure, recyclability, and strength-to-weight ratio suitable for diverse packaging applications.
Secure interlocking flaps have been incorporated to eliminate the need for adhesives or additional fasteners, supporting quick assembly and enhanced reusability. These boxes have been favored in both B2C and B2B logistics due to their compact storage, stack ability, and protection during handling and transit.
Recycled content and FSC-certified board materials have increasingly been adopted to meet brand sustainability goals, while print-friendly surfaces have been used for branding, barcoding, and customer engagement. Compatibility with digital printing and automation-friendly designs has further enhanced their integration into modern supply chains. As brands continue to align with eco-conscious consumers and reduce reliance on plastic packaging, paper-based interlocking boxes are expected to maintain dominance-supported by regulatory incentives, e-commerce growth, and circular packaging initiatives.
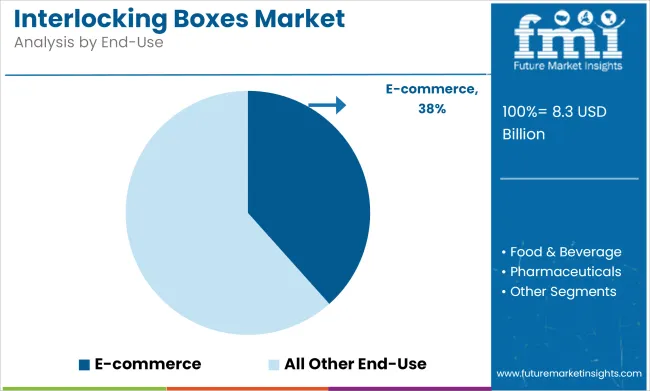
The e-commerce sector is expected to lead the interlocking boxes market by 2025, holding an estimated 38.4% market share, as these boxes have been extensively adopted to meet the packaging, protection, and branding requirements of direct-to-consumer shipping.
A surge in online retail across electronics, apparel, beauty, and lifestyle categories has led to increased reliance on easy-to-assemble, tamper-evident, and return-friendly packaging solutions. Interlocking boxes have been used to enhance structural integrity during last-mile delivery, reducing the risk of product damage while eliminating tape or glue application. Their fold-flat designs have enabled efficient warehousing and minimized shipping costs through dimensional weight optimization.
Branding through pre-printed surfaces and inside-the-box messaging has been supported by the clean lines and flat surfaces of interlocking boxes, allowing companies to elevate the unboxing experience. Product safety, returns processing, and automation compatibility have also been addressed through structural consistency and standardized box formats.
As e-commerce continues to expand globally with growing consumer expectations for sustainability, visual appeal, and hassle-free returns, the use of interlocking boxes in this segment is projected to remain dominant-backed by scalable manufacturing, design flexibility, and operational convenience.
E-commerce Growth Drives Demand for Durable, Secure Rigid Interlocking Boxes
Online retail in electronics, luxury goods, and top-of-the-line fashion has been one of the fastest-growing categories and therefore has greatly increased the demand for rigid interlocking boxes. These are fragile, high-value products and need heavy-duty packaging that can withstand long-distance shipments and handling prior to delivery. Rigid interlocking boxes are designed to be extremely durable, providing a firm barrier against damage in transit. Their strong strength means that fragile objects, like smart phones, laptops, jewelry, and designer apparel, reach the destination without sustaining any damage.
This is exactly what e-commerce sellers need to limit expensive returns and keep their customers satisfied. Another important aspect is that rigid interlocking boxes are highly secure with tamper evident properties, offering an extra security feature for the high-value consignments. As e-commerce thrives, packaging that is more reliable and does not suffer any damage, like rigid interlocking boxes, would be the concern of businesses about how to protect products.
Sustainability Push Drives Demand for Paper-Based Interlocking Boxes in Food
Increased awareness of the consumer regarding environment-friendly products is increasingly pushing demand for sustainability packaging within the food and beverage sector. As more importance is being given to sustainability by the consumers, this is making the companies operating in the sector make a dent in the environment a minimum. The recent hits of paper-based interlocking boxes reflect functional and ecologically friendly substitutes to the usual plastic packaging used before. Made of recyclable, biodegradable renewable resources, these boxes abide by the push of the industry that waste reduction as well as emissions reduction is well supported through paper-based interlocking food packaging boxes in respect of sustainability goals towards the safe transportation of food.
It reduces the cost of transportation by its lightness and raises the energy intake that is transported to reduce costs of fuel. Paper-based interlocking box is likely to be one of the viable options for food and beverage companies fitting into sustainability standards as far as increasing packaging waste regulations in the European and North American markets are concerned.
Consumer Shift Toward Sustainability Limits Plastic Packaging in Personal Care
There seems to be a general trend away from plastic packaging in personal care and cosmetics, primarily due to the increased interest of consumers in seeing that the alternatives are sustainable and eco-friendly. Increased awareness of the impacts on the environment caused by waste from plastics increasingly influences consumer decision-making and choices for purchases in biodegradable, recyclable, or renewable packaging material. This change in preference has, in turn, forced the brands to look for alternative packaging options such as paper-based, glass, or bioplastic that are perceived to be much more environmentally friendly.
In other words, the adoption of plastic-based rigid interlocking boxes is not pursued because it does not meet the expectations of an environmental conscious consumer for a sustainable way of living within the personal care industry. More and more brands want to move away from plastic packaging, which means they'll reduce their carbon footprint and have enhanced environmental credentials. Thus, influence is created in both aspects: packaging design and materials; the favorable preference now is a solution that's waste-minimized and encourages the circular economy.
Tier 1 company leaders are characterized by high production technology and a wide product portfolio. These market leaders are distinguished by their extensive expertise in manufacturing and reconditioning across multiple packaging formats and a broad geographical reach, underpinned by a robust consumer base.
They provide a wide range of series including reconditioning, recycling, and manufacturing utilizing the latest technology and meeting the regulatory standards providing the highest quality. Prominent companies within Tier 1 include DS Smith Packaging Limited, The Mondi Group Plc., International Paper Company, Smurfit Kappa Corporation Limited, WestRock Company, Amcor Ltd., Packaging Corporation of America (PCA), Oji Holdings Corporation.
Tier 2 companies are characterized by a strong presence overseas and strong market knowledge. These market players have good technology and ensure regulatory compliance but may not have advanced technology and wide global reach. Prominent companies in Tier 2 include All Packaging Company, Bell Incorporated, Hariwansh Packaging Pvt. Ltd., Pratt Industries, Inc., Georgia-Pacific LLC.
Tier 3 includes the majority of small-scale companies operating at the local presence and serving niche markets. These companies are notably oriented towards fulfilling local market demands and are consequently classified within the tier 3 share segment. They are small-scale players and have limited geographical reach. Tier 3, within this context, is recognized as an unorganized market, denoting a sector characterized by a lack of extensive structure and formalization when compared to organized competitors.
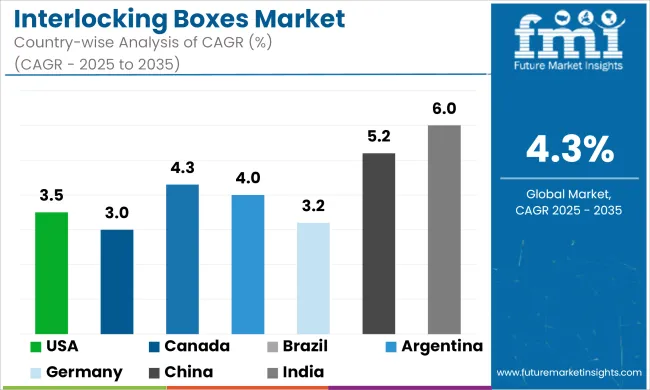
The section below covers the industry analysis for the interlocking boxes market for different countries. Market demand analysis on key countries in several regions of the globe, including North America, Asia Pacific, Europe, and others, is provided. USA is anticipated to remain at the forefront in North America, with a CAGR of 3.5% through 2035. In South Asia & Pacific, India is projected to witness a CAGR of 6.0% by 2035.
| Countries | Value CAGR (2025 to 2035) |
|---|---|
| USA | 3.5% |
| Canada | 3.0% |
| Brazil | 4.3% |
| Argentina | 4.0% |
| Germany | 3.2% |
| China | 5.2% |
| India | 6.0% |
E-commerce happens to be one of the primary industries fueling the interlocking boxes market in the USA, especially when packaging delicate and high-value products such as electronics, luxury goods, and beauty products. Companies in the e-commerce industry face tremendous pressure with the breakneck speed at which online retailing is growing and need to ensure that the product reaches the end user safely and securely. Rigid, paper-based, and interlocking boxes are preferred for superior protection during transit to prevent the damage of a product.
This is also crucial for highly-priced products such as consumer electronics: smartphones, laptops, or even televisions that require packaging in such a manner that it could absorb shocks while preventing scratches or breakage. The interlocking boxes make sure boxes fit right, with a restricted movement inside the box but ensuring a safe delivery. Demand for an aesthetic and branded packaging is complementary to that of safe packaging solutions enhancing the best customer experience possible. E-commerce companies in the United States warmly welcome such boxes as one of their favorites.
Interlocking boxes are the largest market driver in the food and beverage sector, particularly in packaging organic, premium, and eco-conscious products. As German consumers are very sensitive to sustainability and the demand for packaging solutions which do not harm the environment has grown, food brands have started to increasingly use paper-based interlocking boxes. These boxes, therefore, respond to the country's demand for secure and protective packaging, thus fitting well into the stringent environment regulation and what the consumers require from an ecological perspective.
The case of organic food brands or high-grade grocery products like handcrafted cheeses, chocolates, and soft drinks usually call for preservation that is both sensitive to freshness integrity without necessarily forsaking sustainability. Paper-based interlocking boxes are designed to be strong, safe in transport properties, fully recyclable, and biodegradable. With a continuous focus on the sustainability initiative in Germany, demand for the interlocking box within the food and beverage industry is expected to grow further because of regulatory as well as market pressure from its consumers toward green packaging.
Key players operating in the interlocking boxes market are investing in the development of innovative sustainable solutions and also entering into partnerships.
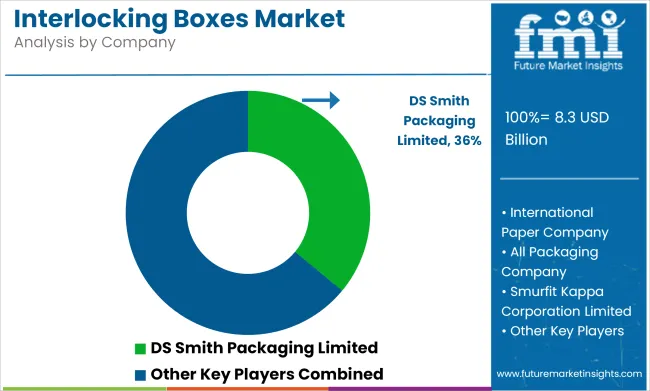
Key interlocking boxes providers have also been acquiring smaller players to grow their presence to further penetrate the interlocking boxes market across multiple regions.
In terms of material type, the industry is divided into below paper-based materials, plastic-based materials, metal-based materials, and wood-based materials.
In terms of box type, the industry is segregated into flat interlocking boxes, foldable interlocking boxes, and rigid interlocking boxes.
The market is classified by end use such as e-commerce, food & beverage, pharmaceuticals, personal care & cosmetics, automotive, industrial goods.
Key countries of North America, Latin America, East Asia, South Asia & Pacific, Western Europe, Eastern Europe, and the Middle East & Africa have been covered in the report.
The global interlocking boxes industry is projected to witness CAGR of 4.3% between 2025 and 2035.
The global interlocking boxes industry stood at USD 8.1 billion in 2024.
The global interlocking boxes industry is anticipated to reach USD 12.6 billion by 2035 end.
South Asia & Pacific region is set to record the highest CAGR of 5.6% in the assessment period.
The key players operating in the global interlocking boxes industry include DS Smith Packaging Limited, The Mondi Group Plc., International Paper Company, All Packaging Company, Smurfit Kappa Corporation Limited, WestRock Company, Bell Incorporated, and Amcor Ltd.


Full Research Suite comprises of:
Market outlook & trends analysis
Interviews & case studies
Strategic recommendations
Vendor profiles & capabilities analysis
5-year forecasts
8 regions and 60+ country-level data splits
Market segment data splits
12 months of continuous data updates
DELIVERED AS:
PDF EXCEL ONLINE
Leading Providers & Market Share in Interlocking Boxes
Ice Boxes Market Size and Share Forecast Outlook 2025 to 2035
Cryoboxes Market Size and Share Forecast Outlook 2025 to 2035
Wax Boxes Market Insights - Growth & Demand Forecast 2025 to 2035
Market Share Breakdown of Cryoboxes Manufacturers
Soap Boxes Market Analysis – Growth & Demand 2025 to 2035
Gift Boxes Market Trends - Size & Forecast 2025 to 2035
Cake Boxes Market from 2025 to 2035
Lunch Boxes & Lunch Bags Market
Mailer Boxes Market Analysis - Size, Share, and Forecast Outlook 2025 to 2035
Burger Boxes Market Size, Share & Forecast 2025 to 2035
Custom Boxes Market Trends – Growth & Forecast 2025-2035
Acrylic Boxes Market Size and Share Forecast Outlook 2025 to 2035
Cooling Boxes Market Size and Share Forecast Outlook 2025 to 2035
Plywood Boxes Market Size and Share Forecast Outlook 2025 to 2035
Packing Boxes Market Trends - Growth & Forecast 2025 to 2035
Printed Boxes Market Analysis – Trends, Demand & Forecast 2025 to 2035
Analyzing Acrylic Boxes Market Share & Industry Leaders
Wardrobe Boxes Market Size and Share Forecast Outlook 2025 to 2035
Membrane Boxes Market Size and Share Forecast Outlook 2025 to 2035

Thank you!
You will receive an email from our Business Development Manager. Please be sure to check your SPAM/JUNK folder too.
Chat With
MaRIA