Mailer Boxes Market Outlook 2025 to 2035

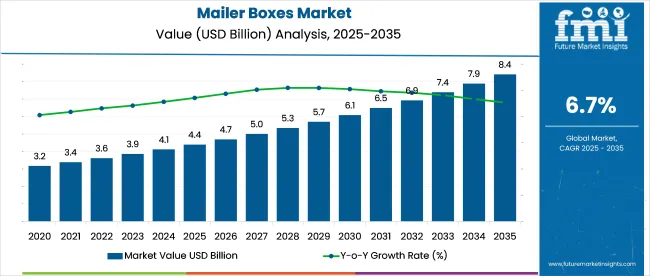
The mailer boxes market is expected to witness steady growth between 2025 and 2035, driven by rising e-commerce sales, increasing demand for sustainable packaging, and growing adoption of custom-branded packaging solutions.

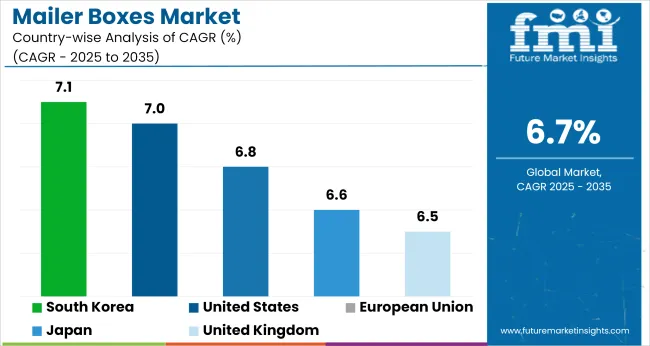
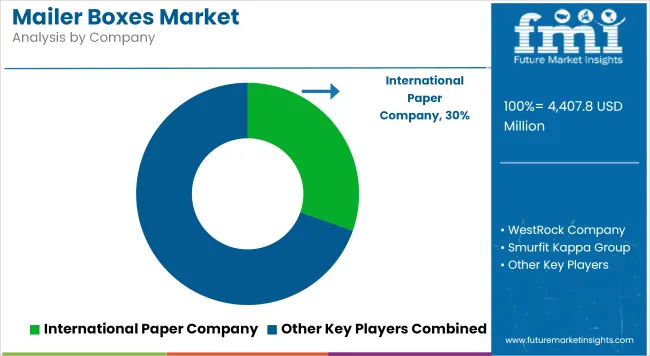
The market is projected to be valued at USD 4,407.8 million in 2025 and is anticipated to reach USD 8,430.8 million by 2035, reflecting a CAGR of 6.7% over the forecast period.

Mailer Box Market Projected Global Industry Values For 2025 2035

Mailer boxes, or folding carton boxes and corrugated mailers, are widely utilized across e-commerce, subscription box businesses and shipping as a result of the light weight, strength and affordability of this. The growth in the marketplace is being driven by the increasing demand for environmentally sustainable packaging, better print technologies, and the growing demand for tamper-proof shipping solutions.

However, the intense competition with flexible packaging and volatility of price and raw material availability can hinder the market growth during the near future.

Emerging technologies such as digital printing, smart packaging RFID boxes, and AI-powered supply chain management are enabling mailer box customization, traceability, and increased efficiency in the shipping process.

Regional Market Trends

North America

North America remains a leading market for mailer boxes, driven by strong e-commerce penetration, high demand for premium custom packaging, and increasing sustainability regulations.

The United States and Canada are witnessing rising adoption of branded and personalized mailer boxes in subscription services, luxury retail, and food delivery. Additionally, biodegradable packaging solutions and FSC-certified paperboard adoption are becoming key market trends.

Europe

Mailer box demand in North America stands at a significant level due to high e-commerce penetration and demand for premium custom packaging, along with evolving sustainability and environmentally friendly norms.

Branded and personalized mailer boxes in subscription services, luxury retail, and food delivery are seeing increased adoption in the United States and Canada. Moreover, these packaging solutions, along with the use of FSC-certified paperboard, are major market trends.

Asia-Pacific

Asia-Pacific will record the highest growth through 2035, on the back of accelerated digitalization, surging e-commerce growth, and increased investments in sustainable packaging solutions in China, Japan, India, and South Korea.

China is still the largest producer of cost-effective mailer boxes, and there is some rising demand for customized mailer boxes from small and medium-sized businesses (SMBs) in India. Advanced NFC-integrated mailer boxes are also getting hold in premium retail applications for smart packaging technologies.

Challenges and Opportunities

Challenges: Raw Material Costs and Recycling Limitations

Although mailer boxes facilitate durability and branding flexibility, factors like increasing paperboard prices, varied recycling practices, and the rising trend for flexible pouches will hinder the market growth statistics. Manufacturers are also highlighting supply chain disruptions and growing regulatory scrutiny of materials linked to deforestation as contributing factors that are encouraging them to look for alternative fiber-based packaging solutions.

Opportunities: Smart Packaging and Customization Trends

Smart tracking labels, interactive packaging (QR codes, NFC tags), and AI-powered demand forecasts are on the rise, creating fresh opportunities in personalized and tech-enabled mailer boxes. Furthermore, innovations in water-resistant coatings, soy-based inks, and methodologies for laser cutting mailer box designs are transforming the luxury and premium mailer box space. Functional and attractive packaging in the form of mailer boxes has been driven by the rise of direct-to-consumer brands and the unboxing experience promoted on social media.

Shifts in the Mailer Boxes Market from 2020 to 2024 and Future Trends 2025 to 2035

The mailer boxes market had a significant growth between 2020 and 2024 attributed to a massive growth in e-commerce coupled with a rising demand for sustainable packaging services and development in shipping materials that are lightweight as well as protective. The trend was toward custom-printed, eco-friendly, and corrugated mailer boxes where the brand directly printed the boxes, which became a trend, especially in retail, subscription services, and small business shipping.

New biodegradable coatings, robust mailer boxes, and AI-funded packaging design each improved durability and branding. Nevertheless, factors such as rising cost of raw material, supply chain disruptions and stringent government regulations regarding environmental protection towards packaging waste were hindering the growth of market.

In 2025 to 2035, the market will expand to include AI-enabled smart packaging, self-decomposing biodegradable mailer boxes, and tracking using blockchain technology for sustainable supply chains. Aspects such as energy-efficient manufacturing, AI-assisted packaging optimization, and recyclable nanomaterial coatings will promote efficiency and environmental compliance.

Milestones in the production of zero-waste mailer boxes, personalization through 3D-printed packaging and embedded smart labels for tracking/authentication will accelerate industry evolution. Furthermore, the emergence of carbon-neutral mailer box leakage production, artificial intelligence-assisted scrappy selection, and automated fulfillment centre packaging processes will revolutionise standards across the board, guaranteeing improved sustainability, sturdiness, and cost-effectiveness.

Market Shifts: A Comparative Analysis 2020 to 2024 vs. 2025 to 2035

Market Shift 2020 to 2024 Trends
Regulatory Landscape Compliance with FSC-certified materials, recyclable packaging regulations, and eco-labeling standards.
Material Innovation Use of corrugated cardboard, recycled kraft paper, and soy-based inks for branding.
Industry Adoption Growth in e-commerce, subscription box services, and small-business packaging solutions.
Smart & AI-Enabled Solutions Early adoption of automated cutting, sustainable printing methods, and ergonomic mailer box designs.
Market Competition Dominated by traditional packaging manufacturers, e-commerce packaging suppliers, and sustainability-focused startups.
Market Growth Drivers Demand fueled by rising online retail sales, sustainability-focused consumer preferences, and lightweight shipping requirements.
Sustainability and Environmental Impact Early adoption of recyclable corrugated mailers, compostable materials, and reduced ink printing processes.
Integration of AI & Digitalization Limited AI use in automated cutting, order tracking, and supply chain optimization.
Advancements in Manufacturing Use of die-cut corrugated mailer boxes, automated folding techniques, and minimal-waste printing.
Market Shift 2025 to 2035 Projections
Regulatory Landscape Stricter AI-driven sustainability tracking, blockchain-backed supply chain transparency, and carbon-neutral packaging mandates.
Material Innovation Adoption of biodegradable nanomaterials, AI-assisted material efficiency selection, and reusable modular mailer boxes.
Industry Adoption Expansion into AI-powered personalized branding on mailer boxes, smart-packaging-integrated boxes with real-time tracking, and reusable returnable mailer packaging.
Smart & AI-Enabled Solutions Large-scale deployment of AI-driven packaging optimization, self-sealing mailer boxes, and embedded RFID smart labels for security and tracking.
Market Competition Increased competition from AI-integrated packaging firms, zero-waste packaging developers, and blockchain-enabled eco-friendly logistics providers.
Market Growth Drivers Growth driven by AI-powered packaging automation, carbon-neutral mailer box production, and smart tracking-integrated packaging.
Sustainability and Environmental Impact Large-scale transition to zero-waste mailer box manufacturing, AI-optimized energy efficiency in production, and fully biodegradable smart-packaging solutions.
Integration of AI & Digitalization AI-powered real-time packaging waste reduction, blockchain-backed material traceability, and AI-driven demand forecasting for inventory management.
Advancements in Manufacturing Evolution of 3D-printed packaging solutions, self-repairing biodegradable mailer boxes, and next-gen recyclable coatings for enhanced protection.

Country-wise Outlook

United States

This growth is further fueled by the growing e-commerce industry, increasing focus on sustainable packaging solutions, as well as an increasing demand for custom and branded packaging. High graph, strong mailer box usage is rising up as the skills of the DTC or the subscription box companies develop.

Plastics, co-extruded film of many layers, are gaining attention; not to mention that with green materials such as recycled kraft paper as well as biodegradable coatings also based, giving technology a certain trend. Growth of the industry is complemented by the increasing utilization of automation in packaging and fulfillment centers.

Country CAGR (2025 to 2035)
United States 7.0%

United Kingdom

There is steady growth of the UK mailer boxes market owing to increases in online retail sales, a strong focus on sustainability and recyclable packaging, and a growing adoption of premium unboxing experience in the luxury and beauty sectors. Rapid growth in the food delivery and meal delivery service industry is also fueling demand for strong, insulated mailer boxes.

Furthermore, surging role of government regulations favoring plastic-free and environment-friendly packaging solutions is further shaping the market growth. In addition, the rise of personalized and custom printed mailer boxes for small businesses is changing the dynamics of the industry.

Country CAGR (2025 to 2035)
United Kingdom 6.5%

European Union

The EU mailer boxes market is dominated by France, Germany, and Italy owing to stringent sustainability regulations, rising demand for eco-friendly e-commerce packaging, and increasing adoption of lightweight but strong corrugated mailer boxes. The transition towards recyclable and compostable mailer box solutions is being accelerated by the EU's push towards implementing circular economy principles and reducing single-use plastic waste.

The growth of the industry is also propelled by the developments in water-based inks and digital printing for branding and marketing applications. The growing adoption of automation in packaging lines and logistics continues to drive efficiency in the market.

Country CAGR (2025 to 2035)
European Union 6.8%

Japan

The Japan mailer boxes market is driven by shrinking preference for elaborate product packaging, increased demand for protective, yet lightweight, packaging solutions, and strong capital investment in sustainable materials. The country’s expertise in precision packaging as well as advanced printing technologies is forging innovation in premium mailer box solutions.

The growing electronics and luxury goods market, which require protective and aesthetically appealing packaging, is also contributing to demand. Market trends are also continuing to be influenced by the emergence of compact, space-efficient packaging solution that are ideal for urban consumers.

Country CAGR (2025 to 2035)
Japan 6.6%

South Korea

The growing trend towards sustainable packaging, high e-commerce penetration, and increasing demand for aesthetically pleasing unboxing experience from consumers is driving the growth of mailer boxes market in South Korea. The country’s emphasis on smart packaging solutions, such as NFC-enabled and QR code-integrated mailer boxes, is propelling market advancement.

Progress on biodegradable and FSC-certified materials is also contributing to the shift to eco-friendly packaging. Industry adoption is further accelerated by the emergence of small businesses, social commerce platforms, which depend on customized and branded packaging.

Country CAGR (2025 to 2035)
South Korea 7.1%

Segmentation Outlook - Mailer Boxes Market

Product Type: C Flute and B Flute Dominate as Preferred Mailer Box Solutions

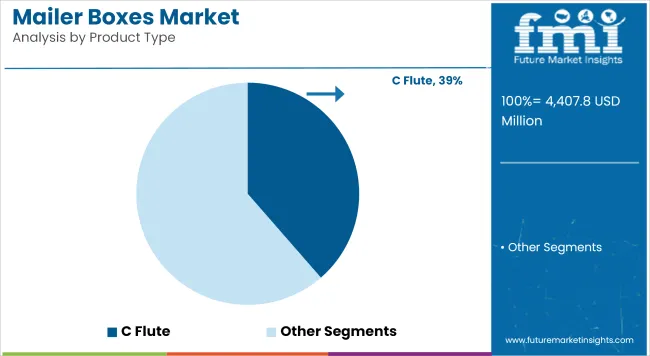
C Flute Leads Mailer Box Market as E-Commerce and Retail Packaging Demand Expands

The C Flute segment is also expected to hold the largest contribution towards the mailer box manufacturing as it provides versatile structural properties, delivers great cushioning effect, and offers a well-balanced combination of lightweight and toughness. Owing to this, C Flute offers higher stacking strength and crush resistance as compared to other flute types, which is why it is chosen for high-volume shipments.

Market adoption has been promoted by growing needs for custom-branded mailer boxes, doted by high-resolution print capabilities, die-cut precision, and foldable designs. According to research, about 60% or more e-commerce brands opt for C Flute mailer boxes because of their superior unboxing experience, thus creating substantial demand for this segment.

The growing demand for customized C Flute mailer boxes with inserts, eco-friendly coatings, and sustainable printing options railroad high market demand with greater brand involvement and consumer satisfaction.

The shift has been bolstered further by the integration of recyclable and biodegradable C Flute material options that utilize FSC-certified paper, soy-based inks, and compostable adhesives to comply with global sustainability regulations.

The C Flute mailer boxes evolution with reinforced structural support, water-resistant coatings, tamper-proof seals, dual-layered protection, is aiding the growth of the market, these boxes provide a more secure option for fragile and high-value shipments.

The C Flute segment is not without its complexities, despite its competitive advantages in stacking strength, sustainable material options, and premium branding appeal, as it is plagued by higher material costs, increasing production complexity, and constraints in ultra-thin packaging uses.

Yet new developments in lightweight C Flute composites, AI-enabled packaging automation, and improvements in digital printing automation are driving cost efficiency, scalability for production, and flexibility in packaging design, which would allow for continued growth of the C Flute-based mailer box segment.

B Flute Gains Popularity as Lightweight and Cost-Effective Mailer Box Solution

The market for smaller sized product shipment packaging is projected to see consistent growth, with the B Flute offering steady market growth as developers and logistics players search for compact, lightweight and affordable options. B Flute is a more refined flute than C Flute that provides improved printing surfaces along with greater strength in certain small box applications.

This growth has been driven by the rising use of B Flute mailer boxes for direct-to-consumer (DTC) brands, including subscription boxes, luxury goods packaging, and small electronics shipments. The increasing demand for B Flute-based lightweight packaging solutions in foldable flat-pack designs, modular inserts, and smart-lock closure mechanisms has driven the market, as they allow for improved convenience and shipping efficiency.

Progress has also enhanced adoption with water-resistant and grease-resistant B Flute coatings with bio-based laminations, environmentally friendly wax coatings and biodegradable moisture barriers, leading to improved packaging performance for food and retail applications.

The evolution of tamper-proof and security-based B Flute mailer boxes with QR code-enabled tracking, RFID-enabled authentication and smart packaging features has brought transparency and ensured more secure logistics and thus, optimizing growth in the temper-proof mailers market.

While where smaller flute type holds benefits with respect of compactness, light-weight construction, and good print quality, the B Flute phase is challenged by decrease stack strength than bigger flute types, and minimum impact absorbing capacity for delicate items and better personalization cost for Premium Ware.

Unfortunately, market segments growth across the global landscape is hindered by high per-unit costs associated with unique pack-unit formation, however, demanding innovations including microflute technology, Artificial Intelligence-based packaging designs & B Flute hybrid materials are paving the way with cost-effective, structural, and eco-friendly-friendly adaptability alongside continued B Flute mailers box market expansion across the globe.

Wall Type: Single Wall and Double Wall Strengthen Market Adoption

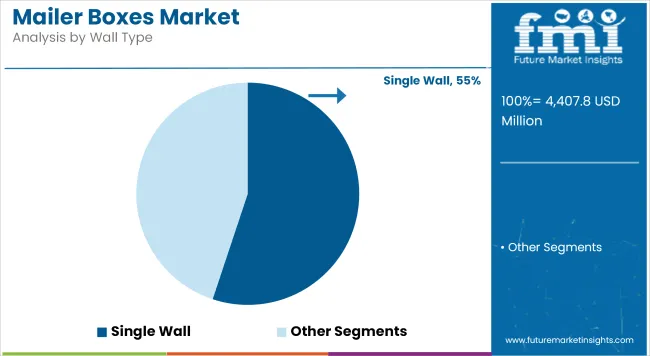
Single Wall Mailer Boxes Dominate Market as Cost-Effective and Lightweight Solution

This is attributed to the increasing requirement for economical, easy-to-handle, and eco-friendly packaging solutions, which has positioned Single Wall as the dominant mailer box wall type.

Moreover, the growing popularity of flat-pack mailer boxes, which require less material, are easy to assemble, and are more eco-friendly has propelled the growth of the market. More than 65% of e-commerce shipments are sent in Single Wall mailer boxes, according to studies, which suggests the strong adoption of this segment.

Growing availability of custom Single Wall mailer box with UV-printed branding, die-cut window inserts, and recyclable corrugated board also caters to consistent and progressive market demand, ensuring improved engagement with consumers and compliance with sustainability principles.

The increasing adoption of smart packaging technologies, including barcode-enabled returns management, NFC-enabled authentication and AI-based logistics tracking, has only further accelerated momentum by guaranteeing a higher degree of transparency and efficiency across e-commerce supply chains.

While having use advantages over cost-efficiency, being sustainable, and a lightweight structure, the Single Wall segment is still challenging owing to lower durability for bulk shipment, restricted attenuation against shocks, and moisture-induced damage.

Nevertheless, innovative developments in reinforced Single Wall corrugated materials, hybrid fibre board solutions, and AI-driven packaging strength optimization are enhancing structural integrity, shipping reliability, and material sustainability ensuring that Single Wall mailer boxes are poised to continue expanding their market globally.

Double Wall Mailer Boxes Expand as Durable and Secure Packaging Choice

Rapid adoption of premium and luxury packaging owing to the rigid construction design, dual-layer cushioning, and reinforced edge protection has led to an increase in the use Double Wall mailer boxes, which contributes to market growth. The increasing adoption of tamper-proof & security-enhanced Double Wall mailer boxes, designed with hidden seal enclosures, dual-layered RFID tracking, and AI-enabled damage prevention technologies, has also augmented market demand providing heightened consumer confidence and brand protection.

The incorporation of high strength sustainable packaging materials, such as recycled fiber board, biodegradable corrugate reinforcements, and water based adhesives have added to the volumes, This is taking place due to rising demand for better environmental responsibility in premium packaging applications.

Double Wall mailer boxes equipped with adaptive packaging intelligence, sensor-based package condition monitoring, impact-resistant structural modifications, and multi-depth flexibility have optimized market growth by ensuring better shipping protection and cost efficiency.

The double wall segment, despite its undeniable strengths in improved durability, enhanced structural reinforcement, and premium branding opportunities, is not devoid of constraints such as escalated raw material expenses, shipping costs associated with weight considerations, and lack of folding potential for optimizing flat-pack performance.

Nonetheless, the introduction of innovations in ultra-lightweight Double Wall composites, Artificial Intelligence (AI)-enabled nanomaterial optimization, and smart packaging solution enhancements have been making Double Wall mailer boxes more cost-effective, structurally flexible, and efficient with logistics, which will contribute to the continued expansion of the Double Wall mailer box industry on a global scale.

Competitive Outlook

Increasing demand for environmentally friendly packaging solutions, growing e-commerce industry, and development of lightweight and durable packaging materials are driving the growth of the mailer boxes market. The market is steadily growing as its applications expand in the fields of retail, subscription services, and industrial shipping. Some major trends influencing the industry include environment friendly packaging materials, personalized printing designs and automated manufacturing operations.

Market Share Analysis by Company

Company Name Estimated Market Share (%)
International Paper Company 12-16%
WestRock Company 10-14%
Smurfit Kappa Group 8-12%
DS Smith Plc 6-10%
Mondi Group 4-8%
Other Companies (combined) 45-55%

Key Company Offerings and Activities

Company Name Key Offerings/Activities
International Paper Company Develops sustainable and recyclable mailer boxes with advanced printing capabilities.
WestRock Company Specializes in lightweight, high-strength mailer boxes for e-commerce and retail applications.
Smurfit Kappa Group Offers customized mailer boxes with eco-friendly materials and digital printing options.
DS Smith Plc Focuses on circular economy solutions with biodegradable and FSC-certified mailer boxes.
Mondi Group Provides high-quality kraft and corrugated mailer boxes with enhanced protection for shipping.

Key Company Insights

International Paper Company (12-16%)

International Paper leads in sustainable mailer box production, integrating advanced printing and recyclable materials.

WestRock Company (10-14%)

WestRock specializes in durable yet lightweight mailer boxes, catering to the growing e-commerce sector.

Smurfit Kappa Group (8-12%)

Smurfit Kappa focuses on customizable and eco-friendly mailer box solutions, enhancing brand identity for businesses.

DS Smith Plc (6-10%)

DS Smith pioneers in biodegradable and FSC-certified mailer boxes, promoting circular economy packaging solutions.

Mondi Group (4-8%)

Mondi develops high-quality kraft mailer boxes, ensuring optimal protection and sustainability in packaging.

Other Key Players (45-55% Combined)

Several packaging manufacturers contribute to the expanding Mailer Boxes Market. These include:

  • Georgia-Pacific LLC (Develops high-strength corrugated mailer boxes with moisture-resistant coatings.)
  • Packlane (Manufactures custom-printed mailer boxes for branding and retail packaging.)
  • Uline, Inc. (Offers a variety of durable mailer boxes for industrial and e-commerce shipments.)
  • Vistaprint (Cimpress N.V.) (Provides personalized mailer boxes for small businesses and subscription services.)
  • Stora Enso (Focuses on sustainable fiber-based mailer box solutions for global markets.)

Key Segmentation

By Product Type:

  • C Flute
  • B Flute
  • E Flute
  • F Flute
  • Others (N Flute, A Flute)

By Wall Type:

  • Single Wall
  • Double Wall
  • Triple Wall

By End Use:

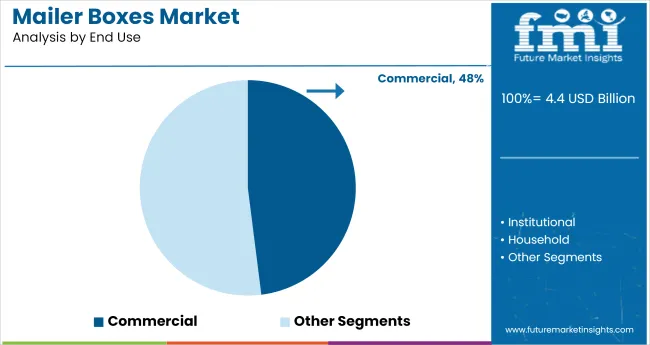
  • Commercial
  • Institutional
  • Household

By Region:

  • North America
  • Latin America
  • Western Europe
  • Eastern Europe
  • East Asia
  • South Asia Pacific
  • Middle East and Africa

Table of Content

  1. Executive Summary
  2. Industry Introduction, including Taxonomy and Market Definition
  3. Market Trends and Success Factors, including Macro-Economic Factors, Market Dynamics, and Recent Industry Developments
  4. Global Market Demand Analysis 2020 to 2024 and Forecast 2025 to 2035, including Historical Analysis and Future Projections
  5. Global Market Analysis 2020 to 2024 and Forecast 2025 to 2035
    • Product Type
    • Wall Type
    • End Use
  6. Global Market Analysis 2020 to 2024 and Forecast 2025 to 2035, By Product Type
    • C Flute
    • B Flute
    • E Flute
    • F Flute
    • Others (N Flute, A Flute)
  7. Global Market Analysis 2020 to 2024 and Forecast 2025 to 2035, By Wall Type
    • Single Wall
    • Double Wall
    • Triple Wall
  8. Global Market Analysis 2020 to 2024 and Forecast 2025 to 2035, By End Use
    • Commercial
    • Institutional
    • Household
  9. Global Market Analysis 2020 to 2024 and Forecast 2025 to 2035, By Region
    • North America
    • Latin America
    • Western Europe
    • Eastern Europe
    • East Asia
    • South Asia Pacific
    • Middle East and Africa
  10. North America Sales Analysis 2020 to 2024 and Forecast 2025 to 2035, by Key Segments and Countries
  11. Latin America Sales Analysis 2020 to 2024 and Forecast 2025 to 2035, by Key Segments and Countries
  12. Western Europe Sales Analysis 2020 to 2024 and Forecast 2025 to 2035, by Key Segments and Countries
  13. Eastern Europe Sales Analysis 2020 to 2024 and Forecast 2025 to 2035, by Key Segments and Countries
  14. East Asia Sales Analysis 2020 to 2024 and Forecast 2025 to 2035, by Key Segments and Countries
  15. South Asia Pacific Sales Analysis 2020 to 2024 and Forecast 2025 to 2035, by Key Segments and Countries
  16. Middle East and Africa Sales Analysis 2020 to 2024 and Forecast 2025 to 2035, by Key Segments and Countries
  17. Sales Forecast 2025 to 2035 by Product Type, Wall Type, and End Use for 30 Countries
  18. Competition Outlook, including Market Structure Analysis, Company Share Analysis by Key Players, and Competition Dashboard
  19. Company Profile
    • International Paper Company
    • WestRock Company
    • Smurfit Kappa Group
    • DS Smith Plc
    • Mondi Group
    • Georgia-Pacific LLC
    • Packlane
    • Uline, Inc.
    • Vistaprint (Cimpress N.V.)
    • Stora Enso

List of Tables

Table 1: Global Market Value (US$ Million) Forecast by Region, 2018 to 2033

Table 2: Global Market Volume (Units) Forecast by Region, 2018 to 2033

Table 3: Global Market Value (US$ Million) Forecast by Product Type, 2018 to 2033

Table 4: Global Market Volume (Units) Forecast by Product Type, 2018 to 2033

Table 5: Global Market Value (US$ Million) Forecast by Wall Type, 2018 to 2033

Table 6: Global Market Volume (Units) Forecast by Wall Type, 2018 to 2033

Table 7: Global Market Value (US$ Million) Forecast by End Use, 2018 to 2033

Table 8: Global Market Volume (Units) Forecast by End Use, 2018 to 2033

Table 9: North America Market Value (US$ Million) Forecast by Country, 2018 to 2033

Table 10: North America Market Volume (Units) Forecast by Country, 2018 to 2033

Table 11: North America Market Value (US$ Million) Forecast by Product Type, 2018 to 2033

Table 12: North America Market Volume (Units) Forecast by Product Type, 2018 to 2033

Table 13: North America Market Value (US$ Million) Forecast by Wall Type, 2018 to 2033

Table 14: North America Market Volume (Units) Forecast by Wall Type, 2018 to 2033

Table 15: North America Market Value (US$ Million) Forecast by End Use, 2018 to 2033

Table 16: North America Market Volume (Units) Forecast by End Use, 2018 to 2033

Table 17: Latin America Market Value (US$ Million) Forecast by Country, 2018 to 2033

Table 18: Latin America Market Volume (Units) Forecast by Country, 2018 to 2033

Table 19: Latin America Market Value (US$ Million) Forecast by Product Type, 2018 to 2033

Table 20: Latin America Market Volume (Units) Forecast by Product Type, 2018 to 2033

Table 21: Latin America Market Value (US$ Million) Forecast by Wall Type, 2018 to 2033

Table 22: Latin America Market Volume (Units) Forecast by Wall Type, 2018 to 2033

Table 23: Latin America Market Value (US$ Million) Forecast by End Use, 2018 to 2033

Table 24: Latin America Market Volume (Units) Forecast by End Use, 2018 to 2033

Table 25: Western Europe Market Value (US$ Million) Forecast by Country, 2018 to 2033

Table 26: Western Europe Market Volume (Units) Forecast by Country, 2018 to 2033

Table 27: Western Europe Market Value (US$ Million) Forecast by Product Type, 2018 to 2033

Table 28: Western Europe Market Volume (Units) Forecast by Product Type, 2018 to 2033

Table 29: Western Europe Market Value (US$ Million) Forecast by Wall Type, 2018 to 2033

Table 30: Western Europe Market Volume (Units) Forecast by Wall Type, 2018 to 2033

Table 31: Western Europe Market Value (US$ Million) Forecast by End Use, 2018 to 2033

Table 32: Western Europe Market Volume (Units) Forecast by End Use, 2018 to 2033

Table 33: Eastern Europe Market Value (US$ Million) Forecast by Country, 2018 to 2033

Table 34: Eastern Europe Market Volume (Units) Forecast by Country, 2018 to 2033

Table 35: Eastern Europe Market Value (US$ Million) Forecast by Product Type, 2018 to 2033

Table 36: Eastern Europe Market Volume (Units) Forecast by Product Type, 2018 to 2033

Table 37: Eastern Europe Market Value (US$ Million) Forecast by Wall Type, 2018 to 2033

Table 38: Eastern Europe Market Volume (Units) Forecast by Wall Type, 2018 to 2033

Table 39: Eastern Europe Market Value (US$ Million) Forecast by End Use, 2018 to 2033

Table 40: Eastern Europe Market Volume (Units) Forecast by End Use, 2018 to 2033

Table 41: South Asia and Pacific Market Value (US$ Million) Forecast by Country, 2018 to 2033

Table 42: South Asia and Pacific Market Volume (Units) Forecast by Country, 2018 to 2033

Table 43: South Asia and Pacific Market Value (US$ Million) Forecast by Product Type, 2018 to 2033

Table 44: South Asia and Pacific Market Volume (Units) Forecast by Product Type, 2018 to 2033

Table 45: South Asia and Pacific Market Value (US$ Million) Forecast by Wall Type, 2018 to 2033

Table 46: South Asia and Pacific Market Volume (Units) Forecast by Wall Type, 2018 to 2033

Table 47: South Asia and Pacific Market Value (US$ Million) Forecast by End Use, 2018 to 2033

Table 48: South Asia and Pacific Market Volume (Units) Forecast by End Use, 2018 to 2033

Table 49: East Asia Market Value (US$ Million) Forecast by Country, 2018 to 2033

Table 50: East Asia Market Volume (Units) Forecast by Country, 2018 to 2033

Table 51: East Asia Market Value (US$ Million) Forecast by Product Type, 2018 to 2033

Table 52: East Asia Market Volume (Units) Forecast by Product Type, 2018 to 2033

Table 53: East Asia Market Value (US$ Million) Forecast by Wall Type, 2018 to 2033

Table 54: East Asia Market Volume (Units) Forecast by Wall Type, 2018 to 2033

Table 55: East Asia Market Value (US$ Million) Forecast by End Use, 2018 to 2033

Table 56: East Asia Market Volume (Units) Forecast by End Use, 2018 to 2033

Table 57: Middle East and Africa Market Value (US$ Million) Forecast by Country, 2018 to 2033

Table 58: Middle East and Africa Market Volume (Units) Forecast by Country, 2018 to 2033

Table 59: Middle East and Africa Market Value (US$ Million) Forecast by Product Type, 2018 to 2033

Table 60: Middle East and Africa Market Volume (Units) Forecast by Product Type, 2018 to 2033

Table 61: Middle East and Africa Market Value (US$ Million) Forecast by Wall Type, 2018 to 2033

Table 62: Middle East and Africa Market Volume (Units) Forecast by Wall Type, 2018 to 2033

Table 63: Middle East and Africa Market Value (US$ Million) Forecast by End Use, 2018 to 2033

Table 64: Middle East and Africa Market Volume (Units) Forecast by End Use, 2018 to 2033

List of Figures

Figure 1: Global Market Value (US$ Million) by Product Type, 2023 to 2033

Figure 2: Global Market Value (US$ Million) by Wall Type, 2023 to 2033

Figure 3: Global Market Value (US$ Million) by End Use, 2023 to 2033

Figure 4: Global Market Value (US$ Million) by Region, 2023 to 2033

Figure 5: Global Market Value (US$ Million) Analysis by Region, 2018 to 2033

Figure 6: Global Market Volume (Units) Analysis by Region, 2018 to 2033

Figure 7: Global Market Value Share (%) and BPS Analysis by Region, 2023 to 2033

Figure 8: Global Market Y-o-Y Growth (%) Projections by Region, 2023 to 2033

Figure 9: Global Market Value (US$ Million) Analysis by Product Type, 2018 to 2033

Figure 10: Global Market Volume (Units) Analysis by Product Type, 2018 to 2033

Figure 11: Global Market Value Share (%) and BPS Analysis by Product Type, 2023 to 2033

Figure 12: Global Market Y-o-Y Growth (%) Projections by Product Type, 2023 to 2033

Figure 13: Global Market Value (US$ Million) Analysis by Wall Type, 2018 to 2033

Figure 14: Global Market Volume (Units) Analysis by Wall Type, 2018 to 2033

Figure 15: Global Market Value Share (%) and BPS Analysis by Wall Type, 2023 to 2033

Figure 16: Global Market Y-o-Y Growth (%) Projections by Wall Type, 2023 to 2033

Figure 17: Global Market Value (US$ Million) Analysis by End Use, 2018 to 2033

Figure 18: Global Market Volume (Units) Analysis by End Use, 2018 to 2033

Figure 19: Global Market Value Share (%) and BPS Analysis by End Use, 2023 to 2033

Figure 20: Global Market Y-o-Y Growth (%) Projections by End Use, 2023 to 2033

Figure 21: Global Market Attractiveness by Product Type, 2023 to 2033

Figure 22: Global Market Attractiveness by Wall Type, 2023 to 2033

Figure 23: Global Market Attractiveness by End Use, 2023 to 2033

Figure 24: Global Market Attractiveness by Region, 2023 to 2033

Figure 25: North America Market Value (US$ Million) by Product Type, 2023 to 2033

Figure 26: North America Market Value (US$ Million) by Wall Type, 2023 to 2033

Figure 27: North America Market Value (US$ Million) by End Use, 2023 to 2033

Figure 28: North America Market Value (US$ Million) by Country, 2023 to 2033

Figure 29: North America Market Value (US$ Million) Analysis by Country, 2018 to 2033

Figure 30: North America Market Volume (Units) Analysis by Country, 2018 to 2033

Figure 31: North America Market Value Share (%) and BPS Analysis by Country, 2023 to 2033

Figure 32: North America Market Y-o-Y Growth (%) Projections by Country, 2023 to 2033

Figure 33: North America Market Value (US$ Million) Analysis by Product Type, 2018 to 2033

Figure 34: North America Market Volume (Units) Analysis by Product Type, 2018 to 2033

Figure 35: North America Market Value Share (%) and BPS Analysis by Product Type, 2023 to 2033

Figure 36: North America Market Y-o-Y Growth (%) Projections by Product Type, 2023 to 2033

Figure 37: North America Market Value (US$ Million) Analysis by Wall Type, 2018 to 2033

Figure 38: North America Market Volume (Units) Analysis by Wall Type, 2018 to 2033

Figure 39: North America Market Value Share (%) and BPS Analysis by Wall Type, 2023 to 2033

Figure 40: North America Market Y-o-Y Growth (%) Projections by Wall Type, 2023 to 2033

Figure 41: North America Market Value (US$ Million) Analysis by End Use, 2018 to 2033

Figure 42: North America Market Volume (Units) Analysis by End Use, 2018 to 2033

Figure 43: North America Market Value Share (%) and BPS Analysis by End Use, 2023 to 2033

Figure 44: North America Market Y-o-Y Growth (%) Projections by End Use, 2023 to 2033

Figure 45: North America Market Attractiveness by Product Type, 2023 to 2033

Figure 46: North America Market Attractiveness by Wall Type, 2023 to 2033

Figure 47: North America Market Attractiveness by End Use, 2023 to 2033

Figure 48: North America Market Attractiveness by Country, 2023 to 2033

Figure 49: Latin America Market Value (US$ Million) by Product Type, 2023 to 2033

Figure 50: Latin America Market Value (US$ Million) by Wall Type, 2023 to 2033

Figure 51: Latin America Market Value (US$ Million) by End Use, 2023 to 2033

Figure 52: Latin America Market Value (US$ Million) by Country, 2023 to 2033

Figure 53: Latin America Market Value (US$ Million) Analysis by Country, 2018 to 2033

Figure 54: Latin America Market Volume (Units) Analysis by Country, 2018 to 2033

Figure 55: Latin America Market Value Share (%) and BPS Analysis by Country, 2023 to 2033

Figure 56: Latin America Market Y-o-Y Growth (%) Projections by Country, 2023 to 2033

Figure 57: Latin America Market Value (US$ Million) Analysis by Product Type, 2018 to 2033

Figure 58: Latin America Market Volume (Units) Analysis by Product Type, 2018 to 2033

Figure 59: Latin America Market Value Share (%) and BPS Analysis by Product Type, 2023 to 2033

Figure 60: Latin America Market Y-o-Y Growth (%) Projections by Product Type, 2023 to 2033

Figure 61: Latin America Market Value (US$ Million) Analysis by Wall Type, 2018 to 2033

Figure 62: Latin America Market Volume (Units) Analysis by Wall Type, 2018 to 2033

Figure 63: Latin America Market Value Share (%) and BPS Analysis by Wall Type, 2023 to 2033

Figure 64: Latin America Market Y-o-Y Growth (%) Projections by Wall Type, 2023 to 2033

Figure 65: Latin America Market Value (US$ Million) Analysis by End Use, 2018 to 2033

Figure 66: Latin America Market Volume (Units) Analysis by End Use, 2018 to 2033

Figure 67: Latin America Market Value Share (%) and BPS Analysis by End Use, 2023 to 2033

Figure 68: Latin America Market Y-o-Y Growth (%) Projections by End Use, 2023 to 2033

Figure 69: Latin America Market Attractiveness by Product Type, 2023 to 2033

Figure 70: Latin America Market Attractiveness by Wall Type, 2023 to 2033

Figure 71: Latin America Market Attractiveness by End Use, 2023 to 2033

Figure 72: Latin America Market Attractiveness by Country, 2023 to 2033

Figure 73: Western Europe Market Value (US$ Million) by Product Type, 2023 to 2033

Figure 74: Western Europe Market Value (US$ Million) by Wall Type, 2023 to 2033

Figure 75: Western Europe Market Value (US$ Million) by End Use, 2023 to 2033

Figure 76: Western Europe Market Value (US$ Million) by Country, 2023 to 2033

Figure 77: Western Europe Market Value (US$ Million) Analysis by Country, 2018 to 2033

Figure 78: Western Europe Market Volume (Units) Analysis by Country, 2018 to 2033

Figure 79: Western Europe Market Value Share (%) and BPS Analysis by Country, 2023 to 2033

Figure 80: Western Europe Market Y-o-Y Growth (%) Projections by Country, 2023 to 2033

Figure 81: Western Europe Market Value (US$ Million) Analysis by Product Type, 2018 to 2033

Figure 82: Western Europe Market Volume (Units) Analysis by Product Type, 2018 to 2033

Figure 83: Western Europe Market Value Share (%) and BPS Analysis by Product Type, 2023 to 2033

Figure 84: Western Europe Market Y-o-Y Growth (%) Projections by Product Type, 2023 to 2033

Figure 85: Western Europe Market Value (US$ Million) Analysis by Wall Type, 2018 to 2033

Figure 86: Western Europe Market Volume (Units) Analysis by Wall Type, 2018 to 2033

Figure 87: Western Europe Market Value Share (%) and BPS Analysis by Wall Type, 2023 to 2033

Figure 88: Western Europe Market Y-o-Y Growth (%) Projections by Wall Type, 2023 to 2033

Figure 89: Western Europe Market Value (US$ Million) Analysis by End Use, 2018 to 2033

Figure 90: Western Europe Market Volume (Units) Analysis by End Use, 2018 to 2033

Figure 91: Western Europe Market Value Share (%) and BPS Analysis by End Use, 2023 to 2033

Figure 92: Western Europe Market Y-o-Y Growth (%) Projections by End Use, 2023 to 2033

Figure 93: Western Europe Market Attractiveness by Product Type, 2023 to 2033

Figure 94: Western Europe Market Attractiveness by Wall Type, 2023 to 2033

Figure 95: Western Europe Market Attractiveness by End Use, 2023 to 2033

Figure 96: Western Europe Market Attractiveness by Country, 2023 to 2033

Figure 97: Eastern Europe Market Value (US$ Million) by Product Type, 2023 to 2033

Figure 98: Eastern Europe Market Value (US$ Million) by Wall Type, 2023 to 2033

Figure 99: Eastern Europe Market Value (US$ Million) by End Use, 2023 to 2033

Figure 100: Eastern Europe Market Value (US$ Million) by Country, 2023 to 2033

Figure 101: Eastern Europe Market Value (US$ Million) Analysis by Country, 2018 to 2033

Figure 102: Eastern Europe Market Volume (Units) Analysis by Country, 2018 to 2033

Figure 103: Eastern Europe Market Value Share (%) and BPS Analysis by Country, 2023 to 2033

Figure 104: Eastern Europe Market Y-o-Y Growth (%) Projections by Country, 2023 to 2033

Figure 105: Eastern Europe Market Value (US$ Million) Analysis by Product Type, 2018 to 2033

Figure 106: Eastern Europe Market Volume (Units) Analysis by Product Type, 2018 to 2033

Figure 107: Eastern Europe Market Value Share (%) and BPS Analysis by Product Type, 2023 to 2033

Figure 108: Eastern Europe Market Y-o-Y Growth (%) Projections by Product Type, 2023 to 2033

Figure 109: Eastern Europe Market Value (US$ Million) Analysis by Wall Type, 2018 to 2033

Figure 110: Eastern Europe Market Volume (Units) Analysis by Wall Type, 2018 to 2033

Figure 111: Eastern Europe Market Value Share (%) and BPS Analysis by Wall Type, 2023 to 2033

Figure 112: Eastern Europe Market Y-o-Y Growth (%) Projections by Wall Type, 2023 to 2033

Figure 113: Eastern Europe Market Value (US$ Million) Analysis by End Use, 2018 to 2033

Figure 114: Eastern Europe Market Volume (Units) Analysis by End Use, 2018 to 2033

Figure 115: Eastern Europe Market Value Share (%) and BPS Analysis by End Use, 2023 to 2033

Figure 116: Eastern Europe Market Y-o-Y Growth (%) Projections by End Use, 2023 to 2033

Figure 117: Eastern Europe Market Attractiveness by Product Type, 2023 to 2033

Figure 118: Eastern Europe Market Attractiveness by Wall Type, 2023 to 2033

Figure 119: Eastern Europe Market Attractiveness by End Use, 2023 to 2033

Figure 120: Eastern Europe Market Attractiveness by Country, 2023 to 2033

Figure 121: South Asia and Pacific Market Value (US$ Million) by Product Type, 2023 to 2033

Figure 122: South Asia and Pacific Market Value (US$ Million) by Wall Type, 2023 to 2033

Figure 123: South Asia and Pacific Market Value (US$ Million) by End Use, 2023 to 2033

Figure 124: South Asia and Pacific Market Value (US$ Million) by Country, 2023 to 2033

Figure 125: South Asia and Pacific Market Value (US$ Million) Analysis by Country, 2018 to 2033

Figure 126: South Asia and Pacific Market Volume (Units) Analysis by Country, 2018 to 2033

Figure 127: South Asia and Pacific Market Value Share (%) and BPS Analysis by Country, 2023 to 2033

Figure 128: South Asia and Pacific Market Y-o-Y Growth (%) Projections by Country, 2023 to 2033

Figure 129: South Asia and Pacific Market Value (US$ Million) Analysis by Product Type, 2018 to 2033

Figure 130: South Asia and Pacific Market Volume (Units) Analysis by Product Type, 2018 to 2033

Figure 131: South Asia and Pacific Market Value Share (%) and BPS Analysis by Product Type, 2023 to 2033

Figure 132: South Asia and Pacific Market Y-o-Y Growth (%) Projections by Product Type, 2023 to 2033

Figure 133: South Asia and Pacific Market Value (US$ Million) Analysis by Wall Type, 2018 to 2033

Figure 134: South Asia and Pacific Market Volume (Units) Analysis by Wall Type, 2018 to 2033

Figure 135: South Asia and Pacific Market Value Share (%) and BPS Analysis by Wall Type, 2023 to 2033

Figure 136: South Asia and Pacific Market Y-o-Y Growth (%) Projections by Wall Type, 2023 to 2033

Figure 137: South Asia and Pacific Market Value (US$ Million) Analysis by End Use, 2018 to 2033

Figure 138: South Asia and Pacific Market Volume (Units) Analysis by End Use, 2018 to 2033

Figure 139: South Asia and Pacific Market Value Share (%) and BPS Analysis by End Use, 2023 to 2033

Figure 140: South Asia and Pacific Market Y-o-Y Growth (%) Projections by End Use, 2023 to 2033

Figure 141: South Asia and Pacific Market Attractiveness by Product Type, 2023 to 2033

Figure 142: South Asia and Pacific Market Attractiveness by Wall Type, 2023 to 2033

Figure 143: South Asia and Pacific Market Attractiveness by End Use, 2023 to 2033

Figure 144: South Asia and Pacific Market Attractiveness by Country, 2023 to 2033

Figure 145: East Asia Market Value (US$ Million) by Product Type, 2023 to 2033

Figure 146: East Asia Market Value (US$ Million) by Wall Type, 2023 to 2033

Figure 147: East Asia Market Value (US$ Million) by End Use, 2023 to 2033

Figure 148: East Asia Market Value (US$ Million) by Country, 2023 to 2033

Figure 149: East Asia Market Value (US$ Million) Analysis by Country, 2018 to 2033

Figure 150: East Asia Market Volume (Units) Analysis by Country, 2018 to 2033

Figure 151: East Asia Market Value Share (%) and BPS Analysis by Country, 2023 to 2033

Figure 152: East Asia Market Y-o-Y Growth (%) Projections by Country, 2023 to 2033

Figure 153: East Asia Market Value (US$ Million) Analysis by Product Type, 2018 to 2033

Figure 154: East Asia Market Volume (Units) Analysis by Product Type, 2018 to 2033

Figure 155: East Asia Market Value Share (%) and BPS Analysis by Product Type, 2023 to 2033

Figure 156: East Asia Market Y-o-Y Growth (%) Projections by Product Type, 2023 to 2033

Figure 157: East Asia Market Value (US$ Million) Analysis by Wall Type, 2018 to 2033

Figure 158: East Asia Market Volume (Units) Analysis by Wall Type, 2018 to 2033

Figure 159: East Asia Market Value Share (%) and BPS Analysis by Wall Type, 2023 to 2033

Figure 160: East Asia Market Y-o-Y Growth (%) Projections by Wall Type, 2023 to 2033

Figure 161: East Asia Market Value (US$ Million) Analysis by End Use, 2018 to 2033

Figure 162: East Asia Market Volume (Units) Analysis by End Use, 2018 to 2033

Figure 163: East Asia Market Value Share (%) and BPS Analysis by End Use, 2023 to 2033

Figure 164: East Asia Market Y-o-Y Growth (%) Projections by End Use, 2023 to 2033

Figure 165: East Asia Market Attractiveness by Product Type, 2023 to 2033

Figure 166: East Asia Market Attractiveness by Wall Type, 2023 to 2033

Figure 167: East Asia Market Attractiveness by End Use, 2023 to 2033

Figure 168: East Asia Market Attractiveness by Country, 2023 to 2033

Figure 169: Middle East and Africa Market Value (US$ Million) by Product Type, 2023 to 2033

Figure 170: Middle East and Africa Market Value (US$ Million) by Wall Type, 2023 to 2033

Figure 171: Middle East and Africa Market Value (US$ Million) by End Use, 2023 to 2033

Figure 172: Middle East and Africa Market Value (US$ Million) by Country, 2023 to 2033

Figure 173: Middle East and Africa Market Value (US$ Million) Analysis by Country, 2018 to 2033

Figure 174: Middle East and Africa Market Volume (Units) Analysis by Country, 2018 to 2033

Figure 175: Middle East and Africa Market Value Share (%) and BPS Analysis by Country, 2023 to 2033

Figure 176: Middle East and Africa Market Y-o-Y Growth (%) Projections by Country, 2023 to 2033

Figure 177: Middle East and Africa Market Value (US$ Million) Analysis by Product Type, 2018 to 2033

Figure 178: Middle East and Africa Market Volume (Units) Analysis by Product Type, 2018 to 2033

Figure 179: Middle East and Africa Market Value Share (%) and BPS Analysis by Product Type, 2023 to 2033

Figure 180: Middle East and Africa Market Y-o-Y Growth (%) Projections by Product Type, 2023 to 2033

Figure 181: Middle East and Africa Market Value (US$ Million) Analysis by Wall Type, 2018 to 2033

Figure 182: Middle East and Africa Market Volume (Units) Analysis by Wall Type, 2018 to 2033

Figure 183: Middle East and Africa Market Value Share (%) and BPS Analysis by Wall Type, 2023 to 2033

Figure 184: Middle East and Africa Market Y-o-Y Growth (%) Projections by Wall Type, 2023 to 2033

Figure 185: Middle East and Africa Market Value (US$ Million) Analysis by End Use, 2018 to 2033

Figure 186: Middle East and Africa Market Volume (Units) Analysis by End Use, 2018 to 2033

Figure 187: Middle East and Africa Market Value Share (%) and BPS Analysis by End Use, 2023 to 2033

Figure 188: Middle East and Africa Market Y-o-Y Growth (%) Projections by End Use, 2023 to 2033

Figure 189: Middle East and Africa Market Attractiveness by Product Type, 2023 to 2033

Figure 190: Middle East and Africa Market Attractiveness by Wall Type, 2023 to 2033

Figure 191: Middle East and Africa Market Attractiveness by End Use, 2023 to 2033

Figure 192: Middle East and Africa Market Attractiveness by Country, 2023 to 2033

Frequently Asked Questions

What was the overall size of the mailer boxes market in 2025?

The overall market size for the mailer boxes market was USD 4,407.8 million in 2025.

How big is the mailer boxes market expected to be in 2035?

The mailer boxes market is expected to reach USD 8,430.8 million in 2035.

What will drive the demand for the mailer boxes market during the forecast period?

The demand for mailer boxes will be driven by increasing e-commerce and online retail sales, rising preference for sustainable and recyclable packaging solutions, growing adoption of custom and branded packaging, and advancements in lightweight and durable corrugated materials.

List the top 5 countries contributing to the mailer boxes market.

The top 5 countries driving the development of the mailer boxes market are the USA, China, Germany, India, and the UK.

Which segment in type is expected to lead in the mailer boxes market?

The Single Wall Mailer Boxes segment is expected to command a significant share over the assessment period.

Explore Similar Insights

Future Market Insights

Mailer Boxes Market