The global padded mailers market is valued at USD 3.8 billion in 2025 and is set to reach USD 7.4 billion by 2035, recording an absolute increase of USD 3.6 billion over the forecast period. This translates into a total growth of 94.7%, with the market forecast to expand at a CAGR of 6.9% between 2025 and 2035. Future Market Insights, valued for advanced intelligence on biopolymer and barrier material adoption trends, states that the market size is expected to grow by approximately 1.9X during the same period, supported by increasing demand for protective shipping solutions, growing adoption of lightweight packaging materials, and rising requirements for cost-effective cushioning across e-commerce fulfillment, document shipping, pharmaceutical distribution, and small electronics transportation.
Between 2025 and 2030, the padded mailers market is projected to expand from USD 3.8 billion to USD 5.3 billion, resulting in a value increase of USD 1.5 billion, which represents 41.7% of the total forecast growth for the decade. This phase of development will be shaped by increasing demand for protective packaging solutions, rising online shopping patterns enabling direct-to-consumer shipping formats, and growing availability of advanced cushioning technologies across fulfillment operations and distribution facilities.
Between 2030 and 2035, the market is forecast to grow from USD 5.3 billion to USD 7.4 billion, adding another USD 2.1 billion, which constitutes 58.3% of the ten-year expansion. This period is expected to be characterized by the advancement of multi-layer cushioning designs, the integration of tamper-evident closure systems for security enhancement, and the development of premium protective features across diverse shipping categories. The growing emphasis on damage reduction principles and return minimization strategies will drive demand for advanced padded mailer varieties with enhanced shock absorption properties, improved dimensional stability, and superior protection characteristics.
E-commerce remains the single largest force shaping market momentum. Online retailers favor padded mailers for their ability to reduce shipping costs, improve handling efficiency, and provide sufficient protection for small and medium-sized items. With rising demand for direct-to-consumer shipping of accessories, cosmetics, skincare products, small electronics, and apparel, padded mailers help businesses streamline fulfillment and reduce material waste. The surge in returns from e-commerce transactions is also strengthening demand for durable and resealable padded mailers that enable hassle-free reverse logistics.
The rise of subscription-based services is giving the market additional traction. Monthly and curated boxes for beauty, wellness, personal care, and lifestyle products often rely on padded mailers to minimize packaging volume and enhance delivery efficiency. These businesses prioritize packaging formats that balance protection with cost-effectiveness, making padded mailers a preferred solution.
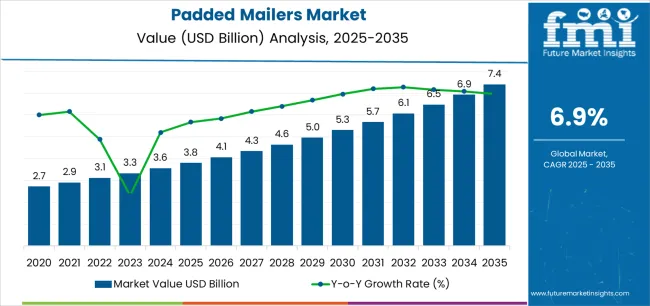
| Metric | Value |
|---|---|
| Estimated Value in (2025E) | USD 3.8 billion |
| Forecast Value in (2035F) | USD 7.4 billion |
| Forecast CAGR (2025 to 2035) | 6.9% |
The e-commerce packaging market is the largest contributor, accounting for about 40-45%. With the rapid growth of online shopping, padded mailers have become a go-to packaging solution for shipping a wide range of products, from electronics to apparel, due to their ability to offer cost-effective protection during transit. The retail packaging market contributes around 20-25%, as padded mailers are also used in brick-and-mortar retail for packaging promotional items, handling product returns, and shipping fragile goods.
The consumer goods packaging market follows with 15-20%, where padded mailers are utilized for securely shipping personal items, small electronics, and other delicate products. The industrial packaging market adds about 10-12%, as padded mailers are employed for shipping machine components, parts, and tools that require extra cushioning. The postal and courier services market accounts for 8-10%, where padded mailers are commonly used by couriers to ensure safe delivery of high-value or fragile items.
Market expansion is being supported by the increasing global demand for protective shipping solutions and the corresponding shift toward lightweight packaging that can provide superior damage prevention while meeting user requirements for cost-effective transportation and space-efficient storage processes. Modern businesses are increasingly focused on incorporating packaging formats that can enhance shipping economics while satisfying demands for consistent, reliably performing protection and optimized warehouse operations. Padded mailers' proven ability to deliver cushioning performance, dimensional flexibility, and diverse application possibilities makes them essential packaging for e-commerce sellers and quality-conscious shipping departments.
The growing emphasis on customer experience and return reduction is driving demand for high-performance padded mailer systems that can support distinctive brand presentation and comprehensive product protection across fragile items, electronics, and valuable merchandise categories. User preference for mailers that combine protective excellence with operational efficiency is creating opportunities for innovative implementations in both traditional and emerging shipping applications. The rising influence of omnichannel retail formats and rapid fulfillment infrastructure is also contributing to increased adoption of padded mailers that can provide authentic performance benefits and reliable protection characteristics.
The market is segmented by product type, material, size category, closure type, end-use application, and region. By product type, the market is divided into bubble mailers, paper padded mailers, foam padded mailers, and poly mailers with cushioning. Based on material, the market is categorized into polyethylene, kraft paper, co-extruded film, and recycled materials. By size category, the market includes small (up to 6"x9"), medium (6"x10" to 9"x12"), large (10"x13" to 14"x20"), and extra-large (above 14"x20"). By closure type, the market encompasses self-seal adhesive, peel & seal, and zipper closure. By end-use application, the market includes e-commerce & retail, pharmaceuticals & healthcare, electronics, documents & media, and other applications. Regionally, the market is divided into North America, Europe, Asia Pacific, Latin America, Middle East & Africa, and other regions.
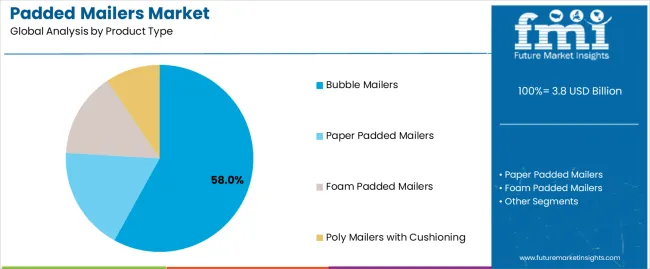
The bubble mailers segment is projected to account for 58% of the padded mailers market in 2025, reaffirming its position as the leading protective packaging category. Businesses and fulfillment centers increasingly utilize bubble mailers for their superior cushioning characteristics, established cost-effectiveness, and essential functionality in diverse shipping applications across multiple product categories. Bubble mailers' standardized protection features and proven damage prevention capabilities directly address user requirements for reliable product safety and optimal shipping value in commercial applications.
This product segment forms the foundation of modern protective shipping patterns, as it represents the format with the greatest operational flexibility and established compatibility across multiple automated systems. Business investments in fulfillment automation and quality standardization continue to strengthen adoption among efficiency-conscious shippers. With users prioritizing protection reliability and weight optimization, bubble mailers align with both economic objectives and performance requirements, making them the central component of comprehensive shipping strategies.
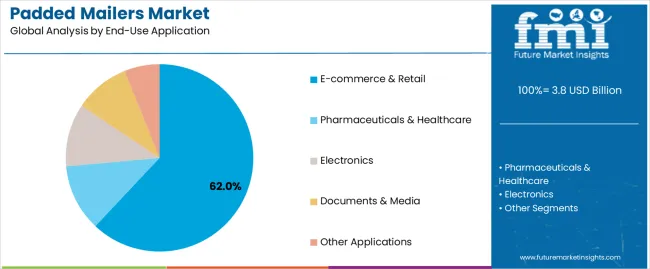
E-commerce & retail is projected to represent 62% of the padded mailers market in 2025, underscoring its critical role as the primary application for volume-focused businesses seeking superior shipping efficiency and enhanced customer satisfaction credentials. Commercial users and online retailers prefer e-commerce applications for their established fulfillment patterns, proven protection effectiveness, and ability to maintain exceptional delivery standards while supporting versatile product offerings during peak shipping periods. Positioned as essential applications for competitive sellers, e-commerce & retail offerings provide both operational excellence and brand differentiation advantages.
The segment is supported by continuous improvement in automated packaging technology and the widespread availability of integrated fulfillment systems that enable rapid processing and premium positioning at the customer level. Logistics companies are optimizing mailer designs to support delivery efficiency and competitive pricing strategies. As e-commerce technology continues to advance and consumers seek faster delivery options, e-commerce & retail applications will continue to drive market growth while supporting seller reputation and customer loyalty strategies.
The padded mailers market is advancing rapidly due to increasing shipping volume consciousness and growing need for protective packaging choices that emphasize superior damage prevention outcomes across e-commerce channels and direct-to-consumer applications. The market faces challenges, including environmental concerns about plastic materials, disposal challenges, and competition from alternative cushioning solutions affecting market dynamics. Innovation in recyclable materials and advanced cushioning systems continues to influence market development and expansion patterns.
The growing adoption of padded mailers in international shipping and cross-border e-commerce is enabling businesses to develop distribution patterns that provide distinctive protection benefits while commanding competitive shipping rates and enhanced delivery reliability. International shipping applications provide superior weight advantages while allowing more sophisticated tracking integration across various logistics networks. Users are increasingly recognizing the functional advantages of padded mailer positioning for global commerce protection and efficiency-conscious distribution integration.
Modern padded mailer manufacturers are incorporating advanced tracking technologies, QR code integration, and digital authentication systems to enhance security credentials, improve shipment visibility, and meet commercial demands for transparent delivery solutions. These systems improve operational effectiveness while enabling new applications, including real-time location monitoring and delivery confirmation programs. Advanced technology integration also allows manufacturers to support premium positioning and enhanced customer experience beyond traditional packaging operations.
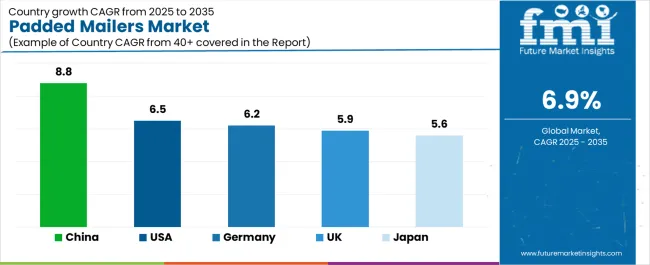
| Country | CAGR (2025-2035) |
|---|---|
| USA | 6.5% |
| Germany | 6.2% |
| UK | 5.9% |
| China | 8.8% |
| Japan | 5.6% |
The padded mailers market is experiencing robust growth globally, with China leading at an 8.8% CAGR through 2035, driven by the expanding e-commerce sector, growing cross-border trade, and increasing adoption of protective packaging solutions. The USA follows at 6.5%, supported by rising online retail penetration, expanding fulfillment infrastructure, and growing demand for lightweight shipping materials. Germany shows growth at 6.2%, emphasizing established logistics capabilities and comprehensive distribution networks. The UK records 5.9%, focusing on premium shipping solutions and customer experience enhancement. Japan demonstrates 5.6% growth, prioritizing quality packaging materials and technological advancement.
The report covers an in-depth analysis of 40+ countries, with top-performing countries highlighted below.
Revenue from padded mailers consumption and sales in the USA is projected to exhibit exceptional growth with a CAGR of 6.5% through 2035, driven by the country's rapidly expanding e-commerce infrastructure, favorable consumer attitudes toward online shopping, and initiatives promoting efficient fulfillment practices across major distribution regions. The USA's position as a leading digital commerce market and increasing focus on delivery speed optimization are creating substantial demand for high-quality padded mailers in both commercial and specialty markets. Major online retailers and fulfillment service providers are establishing comprehensive packaging capabilities to serve growing demand and emerging market opportunities.
Demand for padded mailers products in Germany is expanding at a CAGR of 6.2%, supported by rising packaging automation, growing cross-border commerce requirements, and expanding fulfillment infrastructure. The country's developing e-commerce capabilities and increasing commercial investment in advanced distribution systems are driving demand for padded mailers across both imported and domestically produced applications. International logistics companies and domestic fulfillment providers are establishing comprehensive operational networks to address growing market demand for quality padded mailers and efficient protection solutions.
Revenue from padded mailers products in the UK is projected to grow at a CAGR of 5.9% through 2035, supported by the country's mature e-commerce market, established delivery culture, and leadership in customer satisfaction standards. Britain's sophisticated logistics infrastructure and strong support for efficient packaging are creating steady demand for both traditional and innovative padded mailer varieties. Leading online retailers and specialty fulfillment providers are establishing comprehensive operational strategies to serve both domestic markets and growing export opportunities.
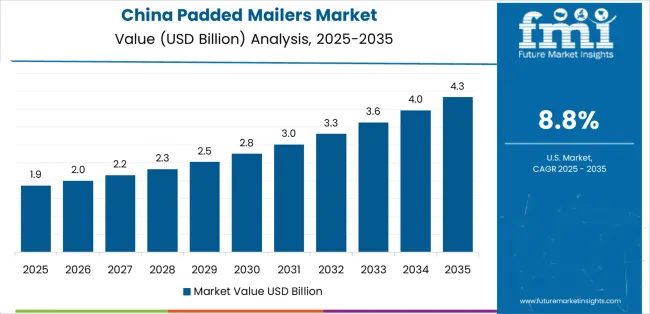
Demand for padded mailers products in China is expected to expand at a CAGR of 8.8% through 2035, driven by the country's emphasis on digital commerce expansion, logistics leadership, and sophisticated fulfillment capabilities for shipments requiring specialized protective varieties. Chinese manufacturers and distributors consistently seek commercial-grade packaging that enhances shipping efficiency and supports operational excellence for both traditional and innovative e-commerce applications. The country's position as an Asian e-commerce leader continues to drive innovation in specialty padded mailer applications and commercial packaging standards.
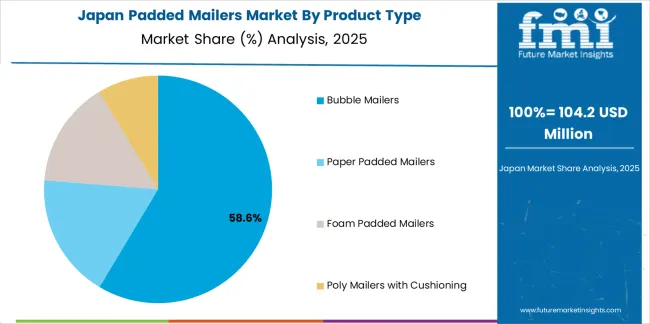
Revenue from padded mailers products in Japan is anticipated to grow at a CAGR of 5.6% through 2035, supported by the country's emphasis on quality packaging, protection standards, and advanced material technology requiring efficient cushioning solutions. Japanese businesses and e-commerce brands prioritize packaging performance and protection precision, making padded mailers essential packaging for both traditional and modern shipping applications. The country's comprehensive quality excellence and advancing e-commerce patterns support continued market expansion.
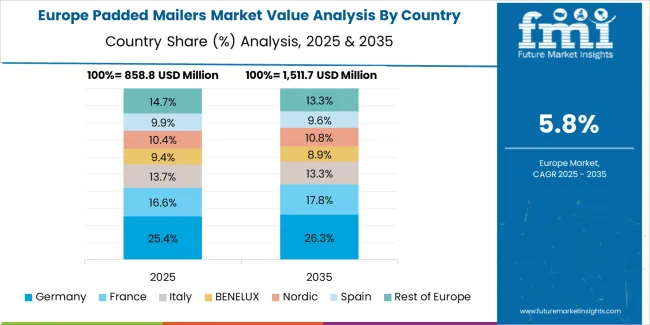
The Europe padded mailers market is projected to grow from USD 1.2 billion in 2025 to USD 2.3 billion by 2035, recording a CAGR of 6.7% over the forecast period. Germany leads the region with a 35.0% share in 2025, moderating slightly to 34.5% by 2035, supported by its strong logistics infrastructure and demand for efficient, protective packaging solutions. The United Kingdom follows with 23.0% in 2025, easing to 22.5% by 2035, driven by a mature e-commerce market and emphasis on customer experience and delivery quality standards. France accounts for 17.0% in 2025, rising to 17.5% by 2035, reflecting steady adoption of protective shipping materials and fulfillment optimization. Italy holds 10.5% in 2025, expanding to 11.0% by 2035 as online retail growth and cross-border commerce applications expand. Spain contributes 6.5% in 2025, growing to 7.0% by 2035, supported by expanding e-commerce sector and marketplace shipping. The Nordic countries rise from 4.5% in 2025 to 4.8% by 2035 on the back of strong digital commerce adoption and advanced logistics technologies. BENELUX decreases from 3.5% in 2025 to 2.7% by 2035, reflecting market maturity and efficiency optimization.
The padded mailers market is characterized by competition among established packaging manufacturers, specialized envelope producers, and integrated protective solution companies. Companies are investing in cushioning technologies, advanced material systems, product innovation capabilities, and comprehensive distribution networks to deliver consistent, high-quality, and reliable padded mailer systems. Innovation in protection enhancement, sealing integrity methods, and application-specific product development is central to strengthening market position and customer satisfaction.
Sealed Air Corporation leads the market with a strong focus on protective innovation and comprehensive padded mailer solutions, offering commercial packaging systems with emphasis on cushioning excellence and technological heritage. PAC Worldwide Corporation provides specialized mailer capabilities with a focus on custom design applications and material engineering networks. Pregis LLC delivers integrated protective packaging solutions with a focus on automation compatibility and operational efficiency. ProAmpac Holdings Inc. specializes in comprehensive flexible packaging with an emphasis on commercial applications. Shorr Packaging Corp. focuses on comprehensive distribution packaging with advanced design and premium positioning capabilities.
The success of padded mailers in meeting commercial shipping demands, consumer-driven protection requirements, and performance integration will not only enhance delivery satisfaction outcomes but also strengthen global e-commerce fulfillment capabilities. It will consolidate emerging regions' positions as hubs for efficient logistics operations and align advanced economies with commercial packaging systems. This calls for a concerted effort by all stakeholders – governments, industry bodies, manufacturers, distributors, and investors. Each can be a crucial enabler in preparing the market for its next phase of growth.
How Governments Could Spur Local Production and Adoption?
How Industry Bodies Could Support Market Development?
How Distributors and E-commerce Industry Players Could Strengthen the Ecosystem?
How Manufacturers Could Navigate the Shift?
| Items | Values |
|---|---|
| Quantitative Units (2025) | USD 3.8 billion |
| Product Type | Bubble Mailers, Paper Padded Mailers, Foam Padded Mailers, Poly Mailers with Cushioning |
| Material | Polyethylene, Kraft Paper, Co-extruded Film, Recycled Materials |
| Size Category | Small (up to 6"x9"), Medium (6"x10" to 9"x12"), Large (10"x13" to 14"x20"), Extra-large (above 14"x20") |
| Closure Type | Self-seal Adhesive, Peel & Seal, Zipper Closure |
| End-Use Application | E-commerce & Retail, Pharmaceuticals & Healthcare, Electronics, Documents & Media, Other Applications |
| Regions Covered | North America, Europe, Asia Pacific, Latin America, Middle East & Africa, Other Regions |
| Countries Covered | United States, Germany, United Kingdom, China, Japan, and 40+ countries |
| Key Companies Profiled | Sealed Air Corporation, PAC Worldwide Corporation, Pregis LLC, ProAmpac Holdings Inc., Shorr Packaging Corp., and other leading padded mailer companies |
| Additional Attributes | Dollar sales by product type, material, size category, closure type, end-use application, and region; regional demand trends, competitive landscape, technological advancements in cushioning engineering, protection enhancement initiatives, sealing technology programs, and premium product development strategies |
The global padded mailers market is estimated to be valued at USD 3.8 billion in 2025.
The market size for the padded mailers market is projected to reach USD 7.4 billion by 2035.
The padded mailers market is expected to grow at a 6.9% CAGR between 2025 and 2035.
The key product types in padded mailers market are bubble mailers , paper padded mailers, foam padded mailers and poly mailers with cushioning.
In terms of end-use application, e-commerce & retail segment to command 62.0% share in the padded mailers market in 2025.


Our Research Products

The "Full Research Suite" delivers actionable market intel, deep dives on markets or technologies, so clients act faster, cut risk, and unlock growth.

The Leaderboard benchmarks and ranks top vendors, classifying them as Established Leaders, Leading Challengers, or Disruptors & Challengers.

Locates where complements amplify value and substitutes erode it, forecasting net impact by horizon

We deliver granular, decision-grade intel: market sizing, 5-year forecasts, pricing, adoption, usage, revenue, and operational KPIs—plus competitor tracking, regulation, and value chains—across 60 countries broadly.

Spot the shifts before they hit your P&L. We track inflection points, adoption curves, pricing moves, and ecosystem plays to show where demand is heading, why it is changing, and what to do next across high-growth markets and disruptive tech

Real-time reads of user behavior. We track shifting priorities, perceptions of today’s and next-gen services, and provider experience, then pace how fast tech moves from trial to adoption, blending buyer, consumer, and channel inputs with social signals (#WhySwitch, #UX).

Partner with our analyst team to build a custom report designed around your business priorities. From analysing market trends to assessing competitors or crafting bespoke datasets, we tailor insights to your needs.
Supplier Intelligence
Discovery & Profiling
Capacity & Footprint
Performance & Risk
Compliance & Governance
Commercial Readiness
Who Supplies Whom
Scorecards & Shortlists
Playbooks & Docs
Category Intelligence
Definition & Scope
Demand & Use Cases
Cost Drivers
Market Structure
Supply Chain Map
Trade & Policy
Operating Norms
Deliverables
Buyer Intelligence
Account Basics
Spend & Scope
Procurement Model
Vendor Requirements
Terms & Policies
Entry Strategy
Pain Points & Triggers
Outputs
Pricing Analysis
Benchmarks
Trends
Should-Cost
Indexation
Landed Cost
Commercial Terms
Deliverables
Brand Analysis
Positioning & Value Prop
Share & Presence
Customer Evidence
Go-to-Market
Digital & Reputation
Compliance & Trust
KPIs & Gaps
Outputs
Full Research Suite comprises of:
Market outlook & trends analysis
Interviews & case studies
Strategic recommendations
Vendor profiles & capabilities analysis
5-year forecasts
8 regions and 60+ country-level data splits
Market segment data splits
12 months of continuous data updates
DELIVERED AS:
PDF EXCEL ONLINE
Market Share Insights for Padded Mailers Providers
Mailers Market Trends - Growth & Forecast 2024 to 2034
Padded Divider Market Insights & Trends 2024-2034
Lab Mailers Market Size and Share Forecast Outlook 2025 to 2035
Polybag Mailers Market Size and Share Forecast Outlook 2025 to 2035
Shipping Mailers Market Size and Share Forecast Outlook 2025 to 2035
Competitive Breakdown of Shipping Mailers Manufacturers
Corrugated Mailers Market Size, Share & Forecast 2025 to 2035
Polyethylene Mailers Market Insights - Growth & Trends Forecast 2025 to 2035
Thermal Insulated Mailers Market Size and Share Forecast Outlook 2025 to 2035
Demand for Corrugated Mailers in USA Size and Share Forecast Outlook 2025 to 2035
Demand for Corrugated Mailers in Japan Size and Share Forecast Outlook 2025 to 2035

Thank you!
You will receive an email from our Business Development Manager. Please be sure to check your SPAM/JUNK folder too.
Chat With
MaRIA