The jewellery box market is poised for significant growth, expanding from USD 3,264 million in 2025 to USD 5,166.7 million by 2035, with a CAGR of 4.7%. This decade-long growth reflects the increasing demand for premium storage systems and sophisticated organizational solutions across residential, retail, and commercial sectors.
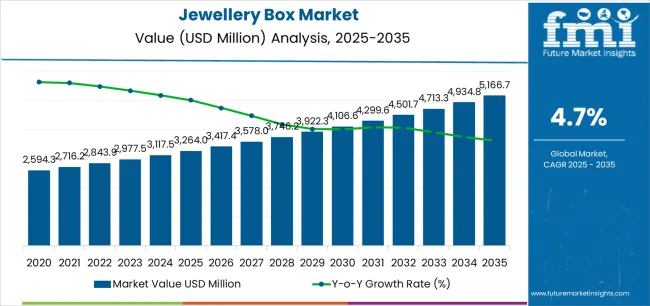
The first half of the decade (2025 to 2030) will witness the market climbing from USD 3,264 million to approximately USD 4,147 million, adding USD 883 million in value, which constitutes 46% of the total forecast growth period. This phase will be characterized by the rapid adoption of customized storage systems, driven by increasing demand for luxury accessories and refined organizational practices worldwide.
The latter half (2030 to 2035) will witness sustained growth from USD 4,147 million to USD 5,166.7 million, representing an addition of USD 1,040 million or 54% of the decade's expansion. This period will be defined by mass market penetration of multi-functional storage systems, integration with comprehensive home organization platforms, and seamless compatibility with existing interior design infrastructure.
The market trajectory signals fundamental shifts in how consumers and retailers approach luxury storage solutions, with participants positioned to benefit from sustained demand across multiple application segments.
The jewellery box market demonstrates distinct growth phases with varying market characteristics and competitive dynamics. Between 2025 and 2030, the market progresses through its design innovation phase, expanding from USD 3,264 million to USD 4,147 million with steady annual increments averaging 4.9% growth. This period showcases the transition from basic storage solutions to advanced systems with enhanced organizational capabilities and integrated aesthetic features becoming mainstream offerings.
The 2025 to 2030 phase adds USD 883 million to market value, representing 46% of total decade expansion. Market maturation factors include standardization of design protocols, evolving consumer preferences for premium materials, and increasing household awareness of luxury storage benefits reaching 75-80% effectiveness in organizational applications. The competitive landscape during this period features established manufacturers like Wolf and Reed & Barton expanding their jewelry box portfolios, while new entrants focus on specialized designs and enhanced customization options.
From 2030 to 2035, market dynamics shift toward advanced personalization and multi-functional deployment, with growth accelerating from USD 4,147 million to USD 5,166.7 million, representing an addition of USD 1,019.7 million, or 54% of the total expansion. This phase transition logic centers on universal storage systems, integration with smart home networks, and deployment across diverse residential scenarios, thereby becoming a standard rather than a specialized application. FMI’s industry-backed packaging intelligence, used across supply chain and sustainability frameworks, indicates that the competitive environment is maturing, with a focus shifting from basic storage capabilities to comprehensive organizational systems and integration with lifestyle management platforms.
The market demonstrates strong fundamentals with wooden systems capturing a dominant share through premium aesthetics and traditional craftsmanship capabilities. Residential applications drive primary demand, supported by increasing consumer spending on luxury storage systems and personal organization solutions.
Geographic expansion remains concentrated in developed markets with established retail infrastructure, while emerging economies show accelerating adoption rates driven by rising disposable incomes and lifestyle modernization.
At-a-Glance Metrics
| Metric | Value |
|---|---|
| Market Value (2025) | USD 3,264 million |
| Market Forecast (2035) | USD 5,166.7 million |
| Growth Rate | 4.70% CAGR |
| Leading Material | Wooden |
| Primary Application | Residential Segment |
The jewellery box market represents a compelling intersection of luxury goods, personal organization, and lifestyle enhancement. With robust growth projected from USD 3,264 million in 2025 to USD 5,166.7 million by 2035 at a 4.70% CAGR, this market is driven by increasing consumer affluence, gift-giving traditions, and demand for premium storage solutions.
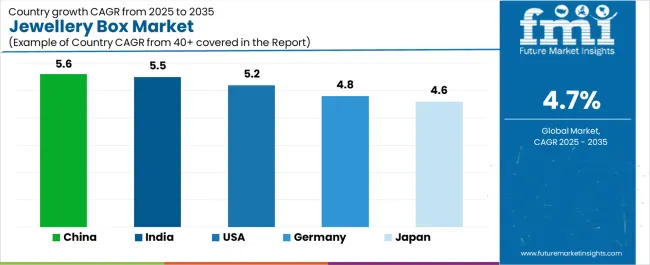
The market's expansion reflects a fundamental shift in how consumers approach jewellery storage and personal accessory management. Strong growth opportunities exist across diverse applications, from residential users requiring elegant organizational solutions to retail establishments demanding display-quality storage systems. Geographic expansion is particularly pronounced in Asia-Pacific markets, led by China (5.6% CAGR) and India (5.5% CAGR), while established markets in North America and Europe drive premium positioning and design innovation.
The dominance of wooden materials and residential applications underscores the importance of traditional craftsmanship and aesthetic appeal in driving adoption. Design customization and price sensitivity remain key challenges, creating opportunities for companies that can deliver premium experiences while maintaining accessible price points.
Market expansion rests on three fundamental shifts driving adoption across consumer and retail sectors. 1. Rising affluence creates compelling lifestyle advantages through premium jewellery boxes that provide sophisticated storage with aesthetic appeal, enabling consumers to enhance personal organization while protecting valuable accessories and expressing individual style preferences. 2. Gift-giving traditions accelerate as consumers worldwide seek elegant presentation solutions that complement premium jewellery purchases, enabling memorable gifting experiences that align with celebration milestones and relationship expression. 3. Retail expansion drives adoption from jewellery stores and luxury boutiques requiring display-quality storage solutions that enhance product presentation while maintaining security standards during customer interactions.
However, growth faces headwinds from price sensitivity challenges that vary across consumer segments regarding material preferences and design expectations, potentially limiting market penetration in cost-conscious demographics. Competition from alternative storage solutions also persists, including generic organizers and digital inventory systems that may reduce demand in certain consumer categories with different organizational priorities.
Primary Classification: The market segments by material type into wooden, leather, metal, glass, and others categories, representing the evolution from traditional handcrafted boxes to contemporary materials with diverse aesthetic and functional characteristics.
Secondary Breakdown: Application segmentation divides the market into residential, commercial retail, and hospitality sectors, reflecting distinct requirements for storage capacity, display features, and security integration.
Regional Classification: Geographic distribution covers North America, Europe, Asia Pacific, Latin America, and the Middle East & Africa, with developed markets leading premium adoption while emerging economies show accelerating growth patterns driven by rising consumer incomes.
The segmentation structure reveals material progression from traditional wooden craftsmanship toward diversified material platforms with enhanced functionality and modern aesthetics, while application diversity spans from personal residential use to commercial retail environments requiring specialized display capabilities.
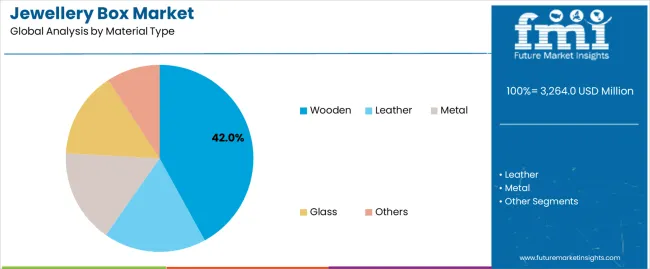
Wooden segment is estimated to account for 42% of the jewellery box market share in 2025. The segment's leading position stems from its fundamental role as a traditional craftsmanship medium and its extensive appeal across multiple consumer demographics. Wooden jewellery boxes' dominance is attributed to superior aesthetic properties, including natural grain patterns, warmth of appearance, and customization capabilities that make them indispensable for premium storage applications.
Market Position: Wooden systems command the leading position in the jewellery box market through traditional craftsmanship features, including comprehensive finishing options, extended product lifespan, and timeless appeal that enable consumers to deploy elegant storage solutions across diverse residential environments.
Value Drivers: The segment benefits from consumer preference for natural materials that provide authentic aesthetics without requiring synthetic components. Classic design features enable deployment in traditional home décor, contemporary interiors, and luxury retail environments where visual appeal and material quality represent critical purchase considerations.
Competitive Advantages: Wooden jewellery boxes differentiate through artisanal craftsmanship potential, material versatility, and compatibility with various finishing techniques that enhance consumer satisfaction while maintaining cost-effective production profiles suitable for diverse market segments.
Key market characteristics:
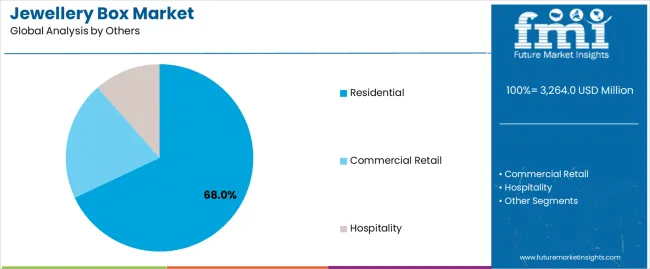
Residential segment is projected to hold 68% of the jewellery box market share in 2025. The segment's market leadership is driven by the extensive use of jewellery boxes in personal homes for accessory storage, collection organization, and dresser décor, where boxes serve as both functional storage and decorative elements. The residential sector's consistent demand for personalized organizational solutions supports the segment's dominant position.
Market Context: Residential applications dominate the market due to widespread adoption of personal storage solutions and increasing focus on home organization, lifestyle expression, and accessory protection applications that enhance living spaces while maintaining aesthetic standards.
Appeal Factors: Residential customers prioritize design aesthetics, storage capacity, and integration with existing bedroom furniture that enables coordinated deployment across personal spaces. The segment benefits from substantial consumer spending on home organization and lifestyle products that emphasize quality enhancement for daily living.
Growth Drivers: Home organization trends incorporate jewellery boxes as essential storage components for personal accessories. At the same time, lifestyle initiatives are increasing demand for premium organizational solutions that comply with interior design preferences and enhance personal space management.
Market Challenges: Budget constraints and design preferences may limit adoption in certain demographic segments or housing types with space limitations.
Application dynamics include:
Growth Accelerators: Rising consumer affluence drives primary adoption as jewellery box systems provide elegant storage capabilities that enable accessory protection with aesthetic appeal, supporting lifestyle enhancement and personal organization that require sophisticated storage management. Gift-giving demand accelerates market expansion as consumers seek premium presentation solutions that enhance jewellery purchases while maintaining memorable gifting standards during celebrations and relationship milestones. Retail spending increases worldwide, creating sustained demand for display-quality storage systems that complement luxury accessories and provide visual appeal in commercial environments.
Growth Inhibitors: Price sensitivity challenges vary across consumer demographics regarding material preferences and design expectations, which may limit market penetration and adoption in budget-conscious segments with alternative storage priorities. Design standardization limitations persist regarding customization options and personalization features that may reduce appeal in markets demanding unique aesthetic expressions and bespoke storage solutions. Market fragmentation across multiple retail channels and consumer preferences creates compatibility concerns between different product categories and customer expectations.
Market Evolution Patterns: Adoption accelerates in affluent demographics where premium storage justifies investment costs, with geographic concentration in developed markets transitioning toward mainstream adoption in emerging economies driven by rising incomes and lifestyle modernization. Design development focuses on enhanced functionality, innovative materials, and integration with smart home systems that optimize storage organization and accessory management. The market could face disruption if alternative storage technologies or minimalist lifestyle trends significantly reduce consumer demand for traditional jewellery boxes in residential applications.
| Country | CAGR (2025 to 2035) |
|---|---|
| China | 5.6% |
| India | 5.5% |
| USA | 5.2% |
| Germany | 4.8% |
| Japan | 4.6% |
The jewellery box market demonstrates varied regional dynamics with Growth Leaders including China (5.6% CAGR) and India (5.5% CAGR) driving expansion through rising consumer incomes and gift-giving traditions. Steady Performers encompass the USA (5.2% CAGR), Germany (4.8% CAGR), and Japan (4.6% CAGR), benefiting from established retail sectors and premium product adoption.
Regional synthesis reveals Asia-Pacific markets leading growth through rising affluence and traditional gifting culture, while European countries maintain steady expansion supported by luxury goods consumption and retail modernization. North American markets show strong growth driven by residential organization trends and premium lifestyle product adoption.
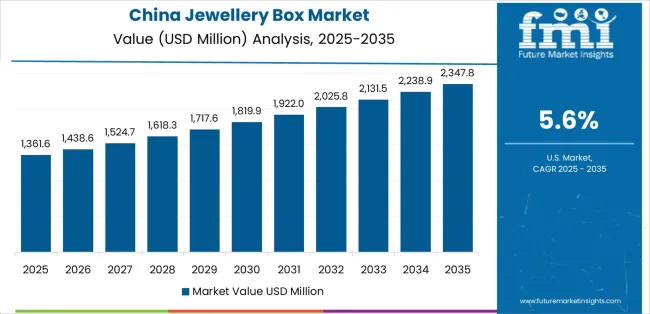
China establishes regional leadership through expanding middle-class consumer base and comprehensive retail modernization, integrating premium jewellery boxes as standard accessories in jewellery purchases and gift-giving occasions. The country's 5.6% CAGR through 2035 reflects increasing consumer affluence and traditional gifting culture that emphasizes elegant presentation in jewellery transactions and personal celebrations. Growth concentrates in major urban centers, including Shanghai, Beijing, and Shenzhen, where retail development showcases integrated display systems that appeal to consumers seeking premium storage solutions and lifestyle enhancement applications.
Chinese manufacturers are developing cost-effective jewellery box solutions that combine domestic production advantages with contemporary designs, including multi-functional features and traditional aesthetic elements.
Strategic Market Indicators:
The Indian market emphasizes traditional craftsmanship, including handmade wooden boxes and comprehensive artisanal production that increasingly incorporates contemporary designs for jewellery storage and cultural gifting applications. The country is projected to show a 5.5% CAGR through 2035, driven by rising disposable incomes under economic development programs and consumer demand for premium, culturally appropriate storage systems. Indian consumers prioritize aesthetic appeal with jewellery boxes delivering traditional craftsmanship through intricate detailing and cultural design capabilities.
Distribution channels include jewellery retailers, lifestyle stores, and traditional craft markets that support artisan production for diverse consumer segments.
Performance Metrics:
The USA market emphasizes advanced jewellery box features, including smart integration systems and luxury materials that manage accessory organization, climate control, and security applications through sophisticated residential storage systems. The country is projected to show a 5.2% CAGR through 2035, driven by home organization trends under lifestyle modernization and consumer demand for premium, multifunctional storage systems. American consumers prioritize design versatility with jewellery boxes delivering contemporary aesthetics through innovative materials and customization capabilities.
Distribution channels include specialty retailers, department stores, and online platforms that support direct consumer access for personalized storage solutions.
Performance Metrics:
In Munich, Frankfurt, and Berlin, German consumers and retailers are implementing premium jewellery boxes to enhance storage capabilities and support aesthetic standards that align with interior design requirements and quality expectations. The German market demonstrates sustained growth with a 4.8% CAGR through 2035, driven by retail modernization programs and consumer preferences that emphasize premium materials for residential and commercial applications. German consumers are prioritizing jewellery box systems that provide reliable storage capabilities while maintaining compliance with design standards and minimizing space requirements, particularly important in urban residences and luxury retail environments.
Market expansion benefits from quality manufacturing programs that mandate high-standard products in retail specifications, creating sustained demand across Germany's jewellery and lifestyle retail sectors, where product excellence and craftsmanship represent critical requirements.
Strategic Market Indicators:
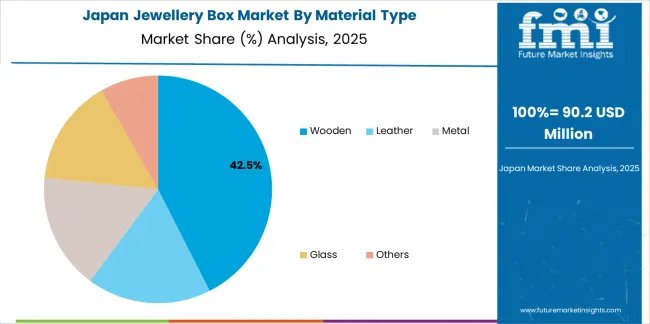
Japan's sophisticated consumer market demonstrates premium jewellery box deployment, growing at 4.6% CAGR, with documented aesthetic excellence in traditional lacquerware and contemporary designs through integration with Japanese minimalist principles and quality craftsmanship infrastructure. The country leverages expertise in material refinement and precision manufacturing to maintain market leadership. Urban centers, including Tokyo, Osaka, and Kyoto, showcase premium installations where jewellery boxes integrate with comprehensive interior design platforms and lifestyle aesthetics to optimize storage functionality and visual harmony.
Japanese consumers prioritize material quality and design refinement in storage product selection, creating demand for premium box systems with advanced features, including traditional craftsmanship elements and integration with modern residential spaces. The market benefits from established retail infrastructure and willingness to invest in artisanal products that provide long-term aesthetic benefits and cultural value.
Market Intelligence Brief:
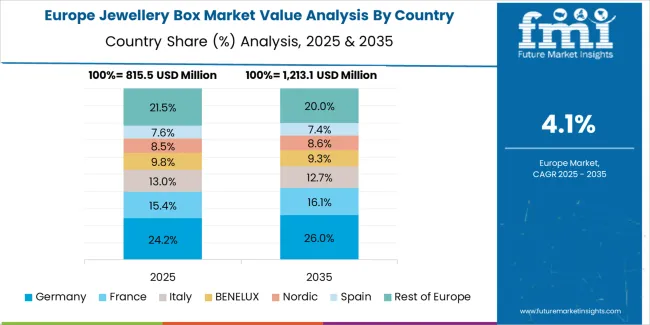
The jewellery box market in Europe is projected to grow from USD 968 million in 2025 to USD 1,535 million by 2035, registering a CAGR of 4.7% over the forecast period. Germany is expected to maintain its leadership position with a 31.8% market share in 2025, declining slightly to 31.4% by 2035, supported by its premium retail infrastructure and major urban centers, including Bavaria and Baden-Württemberg.
The United Kingdom follows with a 24.2% share in 2025, projected to reach 24.6% by 2035, driven by comprehensive luxury retail presence and lifestyle product consumption patterns. France holds a 19.6% share in 2025, expected to maintain 19.8% by 2035 through established fashion sectors and premium accessories adoption.
Italy commands a 14.8% share, while Spain accounts for 7.2% in 2025. The Rest of Europe region is anticipated to gain momentum, expanding its collective share from 2.4% to 2.7% by 2035, attributed to increasing affluent consumer adoption in Nordic countries and emerging Eastern European retail markets implementing luxury lifestyle programs.
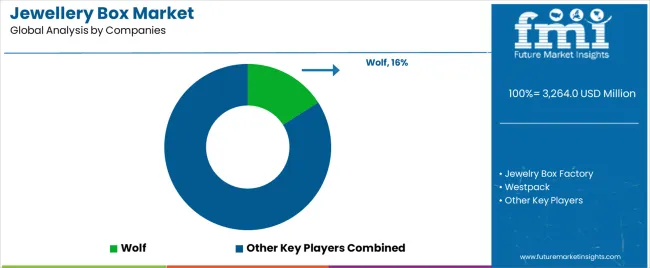
The jewellery box market operates with moderate concentration, featuring approximately 15-22 participants, where leading companies control roughly 35-40% of the global market share through established retail relationships and comprehensive product portfolios. Competition emphasizes design innovation, material quality, and brand positioning rather than price-based rivalry.
Market Leaders encompass Wolf, Reed & Barton, and Jewelry Box Factory, which maintain competitive advantages through extensive craftsmanship expertise, global distribution networks, and comprehensive design capabilities that create customer loyalty and support premium pricing. These companies leverage decades of manufacturing experience and ongoing design investments to develop premium jewellery boxes with enhanced aesthetics and functionality features.
Technology Challengers include Westpack, Gunther Mele Limited, and Vlando, which compete through specialized design focus and innovative material applications that appeal to consumers seeking contemporary storage capabilities and personalization options. These companies differentiate through rapid product development cycles and niche market segment focus.
Market dynamics favor participants that combine exceptional craftsmanship with innovative design approaches, including customization services and brand storytelling capabilities. Competitive pressure intensifies as lifestyle brands expand into jewellery storage systems. At the same time, specialized manufacturers challenge established players through innovative designs and direct-to-consumer models targeting specific demographic segments.
| Item | Value |
|---|---|
| Quantitative Units | USD 3,264 million |
| Material Type | Wooden, Leather, Metal, Glass, Others |
| Application | Residential, Commercial Retail, Hospitality |
| Regions Covered | North America, Europe, Asia Pacific, Latin America, Middle East & Africa |
| Countries Covered | U.S., Germany, Japan, China, India, and 25+ additional countries |
| Key Companies Profiled | Wolf, Jewelry Box Factory, Westpack, Reed & Barton, Gunther Mele Limited |
| Additional Attributes | Dollar sales by material type and application categories, regional adoption trends across North America, Europe, and Asia-Pacific, competitive landscape with luxury manufacturers and artisan producers, consumer preferences for craftsmanship and design aesthetics, integration with retail merchandising and home organization platforms, innovations in materials and functional features, and development of customizable solutions with enhanced storage and display capabilities |
The global jewellery box market is estimated to be valued at USD 3,264.0 million in 2025.
The market size for the jewellery box market is projected to reach USD 5,166.7 million by 2035.
The jewellery box market is expected to grow at a 4.7% CAGR between 2025 and 2035.
The key product types in jewellery box market are wooden, leather, metal, glass and others.
In terms of others, residential segment to command 68.0% share in the jewellery box market in 2025.


Full Research Suite comprises of:
Market outlook & trends analysis
Interviews & case studies
Strategic recommendations
Vendor profiles & capabilities analysis
5-year forecasts
8 regions and 60+ country-level data splits
Market segment data splits
12 months of continuous data updates
DELIVERED AS:
PDF EXCEL ONLINE
Key Companies & Market Share in the Jewellery Box Market
Leather Jewellery Box Market Size and Share Forecast Outlook 2025 to 2035
Paperboard Jewellery Box Market Growth & Trends Forecast 2024-2034
Fragrance Jewellery Pods Market Analysis Size and Share Forecast Outlook 2025 to 2035
Luxury Fine Jewellery Market Analysis - Size, Share, and Forecast 2025 to 2035
Box Liners Market Size and Share Forecast Outlook 2025 to 2035
Boxboard Packaging Market Analysis - Size, Share, and Forecast Outlook 2025 to 2035
Box Compression Tester Market Size and Share Forecast Outlook 2025 to 2035
Box Latch Market Size and Share Forecast Outlook 2025 to 2035
Box Pouch Market by Pouch Type from 2025 to 2035
Box Filling Machine Market from 2025 to 2035
Box and Carton Overwrap Films Market Demand and Growth
Box and Carton Overwrapping Machines Market Insights and Growth 2025 to 2035
Boxcar Scars Market – Demand, Growth & Forecast 2025 to 2035
Box Sealing Machines Market Trends – Growth & Forecast 2025 to 2035
Competitive Breakdown of Box Pouch Providers
Market Share Insights of Boxboard Packaging Providers
Box Latch Market Positioning & Competitive Analysis
Industry Share Analysis for Box Liners Companies
Carboxymethyl Tamarind Kernel Powder Market Size and Share Forecast Outlook 2025 to 2035

Thank you!
You will receive an email from our Business Development Manager. Please be sure to check your SPAM/JUNK folder too.
Chat With
MaRIA