

- Market Size (2026)
- USD 610.0 Mn
- Forecast (2036)
- USD 1245.6 Mn
- CAGR (2026 to 2036)
- 7.4%
How is the mineral uptake additives market segmented?
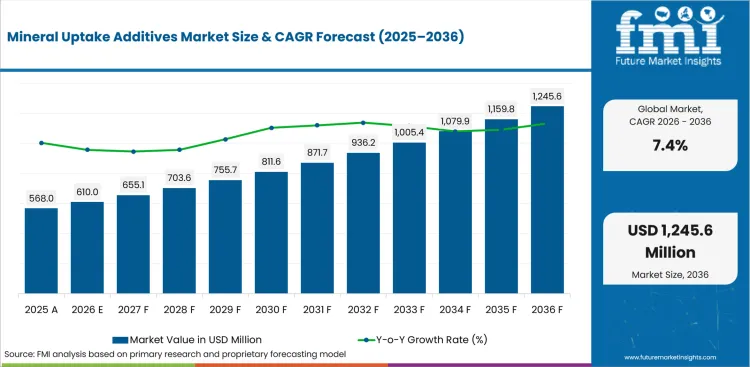
USD 610.0 million in 2026 and USD 1,245.6 million by 2036 at a 7.4% CAGR.
The mineral uptake additive demand now links feed additive sourcing with measurable nutrient use, mill handling, and animal-health documentation. FAO reported world meat output of 374 million tonnes in 2024 along with global milk output of 985 million tonnes, and egg output of 100 million tonnes, placing mineral efficiency under closer review across commercial livestock programs.
Feed mills compare mineral uptake additives based on how stable the dosing remains during storage and handling, and whether performance data exists across multiple animal species.
Ingredient approval pressure is also reshaping supplier screening. FDA described Animal Food Ingredient Consultation in 2025 as an interim process allowing firms to consult on animal food ingredients and helping identify safety concerns, raising documentation expectations for new additive inputs before commercial use.
| Parameter | Details |
|---|---|
| 2025 Market Size | USD 568.0 million |
| 2026 Market Size | USD 610.0 million |
| 2036 Market Size | USD 1,245.6 million |
| Forecast CAGR (2026-2036) | 7.4% |
| Form Focus | Dry (37.0% share in 2026) |
| Livestock Focus | Poultry (36.5% share in 2026) |
| Source Focus | Mineral (34.5% share in 2026) |
| Country CAGR Reference | India (6.7% through 2036) |
Summary of the Mineral Uptake Additives Market
| Market Signal | Commercial Impact |
|---|---|
| Demand and Growth Drivers | Demand for mineral uptake additives is increasing as feed mills seek predictable mineral availability across poultry and aquaculture diets.
|
| Product and Segment View | Segment demand is led by dry handling and mineral-source confidence across feed additive purchasing.
|
| Geography and Growth Outlook | Regional demand is led by countries with livestock scale and documented additive review.
|
| Competitive Landscape | Competition focuses on feed additive portfolios and supply reliability for large nutrition programs.
|
| Analyst Perspective | Mineral uptake additives now support feed-efficiency decisions as buyers connect mineral absorption with animal health and output stability.
|
How is the mineral uptake additives market segmented?
The mineral uptake additives industry is segmented by form, source, livestock, function, and sales channel.
The mineral uptake additives market is segmented by form, source, livestock, function, and sales channel. By form, coverage includes Dry, Liquid, Pellet, Premix, and Encapsulated. By source, coverage includes Synthetic, Microbial, Plant/Botanical, Mineral, and Yeast-based. By livestock, coverage includes Poultry, Swine, Ruminants, Aquaculture, and Equine & Pets. By function, coverage includes Gut Health, Growth Performance, Immunity, Nutrient Utilization, and Stress Management. By sales channel, coverage includes Direct Sales, Feed Mill Contracts, Distributor Sales, Nutrition Consultant Channels, and Online Technical Platforms.
Why do Dry formats lead within the form segment?
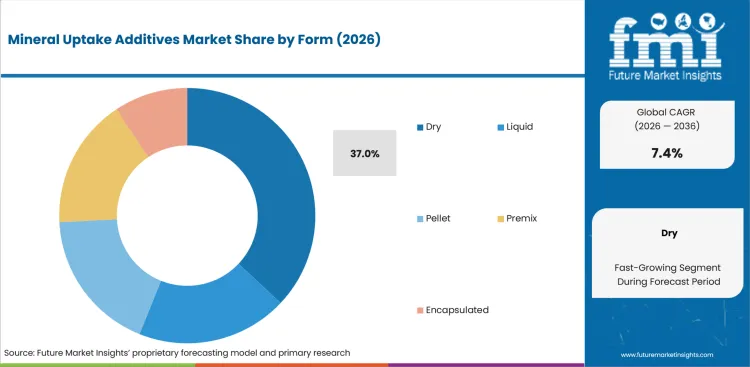
Dry formats lead through easier storage, dosing, and blending across feed mills and premix operations. Feed plants need additives dispersing cleanly in compound feed and keep batch handling simple. Dry forms also support quality checks before full-scale diet inclusion.
- Dry formats are expected to account for 37.0% share in 2026, driven by storage stability and established feed-grain handling systems. USDA ERS reported corn accounts for more than 95% of total USA feed grain production and use, strengthening dry-format compatibility across feed plants.
- Liquid and encapsulated formats serve specific dosing and release needs. Dry formats keep selection strength once buyers compare shelf stability and blending nature across commercial diet programs.
What supports demand for Mineral-source additives?
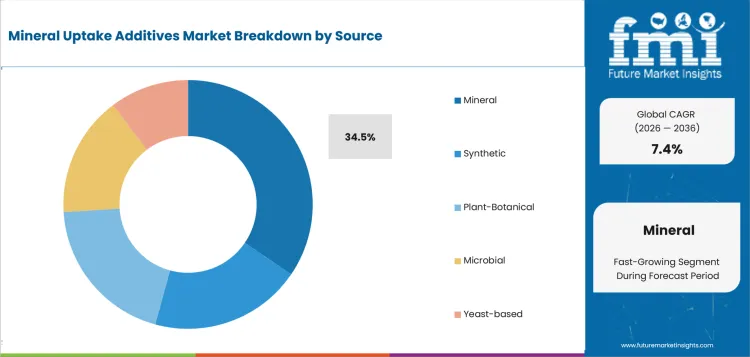
Mineral-source additives support traceable nutrition programs as feed buyers compare cost and batch documentation. Buyers evaluate mineral inputs through digestibility and evidence across species diets. Product approval improves once suppliers provide clear identity files and routine quality records.
- Mineral source is projected to hold 34.5% share in 2026, supported by direct linkage with calcium and selenium nutrition. USGS reported USA phosphate rock marketable output at 20 million tons in 2025, and animal feed supplements remain part of downstream phosphate applications.
- Synthetic and yeast-based inputs expand formulation options in selected programs. Mineral-source products retain buyer attention once traceability and uptake evidence align with feed-mill operating routines.
How does Poultry shape the livestock segment?
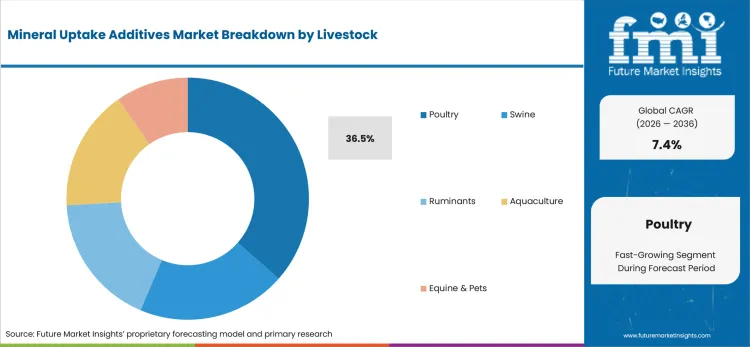
Poultry forms the main demand pool as broiler and layer diets measure feed conversion and gut stability. Short production cycles allow faster review of mineral uptake results through farm records. Integrators also need additives that can support frequent ration changes without adding mill complexity.
- Poultry is anticipated to represent 36.5% share in 2026, supported by high feed turnover and close performance monitoring. USDA NASS reported USA egg production totaled 105 billion eggs in 2025, showing large layer-diet exposure for mineral nutrition programs.
- Swine and equine and pet programs add demand through species-specific mineral needs. Poultry keeps a leading position as buyers can test additive value through shorter cycles and repeated feed conversion checks.
What market factors influence Nutrient Utilization decisions?
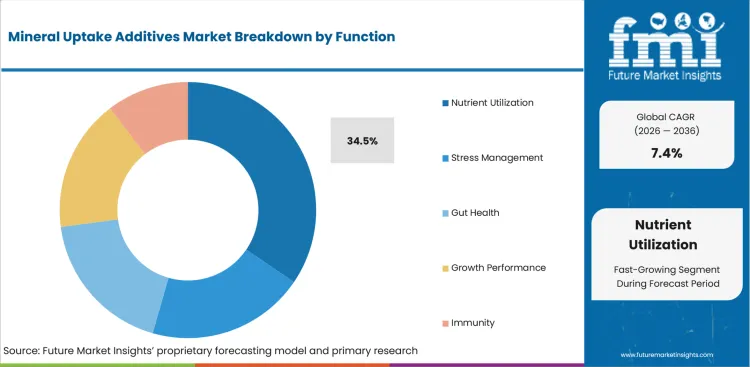
Nutrient utilization turns additive value into a measurable operating target. Feed buyers assess whether mineral uptake additives reduce nutrient loss and protect animal performance during ingredient changes. Supplier review often focuses on trial design and proof of consistent mineral availability.
- Nutrient utilization is set to secure 34.5% share in 2026, driven by buyer interest in mineral absorption and lower feed waste. European Commission feed additive rules state authorisations remain valid for 10 years across the EU and EEA after scientific review.
- Gut health and stress management functions support adjacent use cases. Nutrient utilization retains buyer attention as feed mills connect additive cost with feed conversion and animal performance records.
How is Direct Sales positioned within the sales-channel segment?
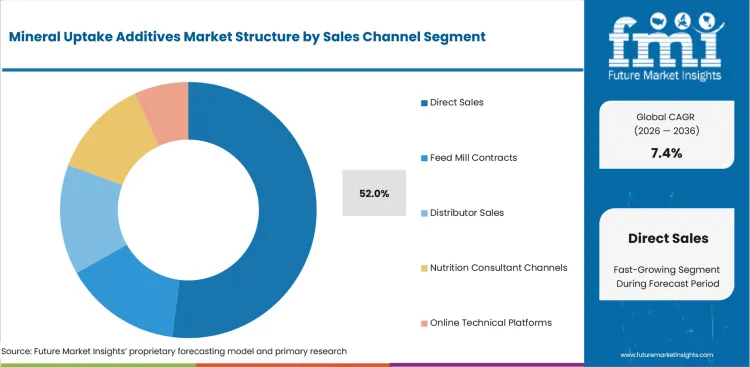
The direct sales channel lets additive suppliers partner closely with feed mills and premix buyers throughout trial design and rollout. Mineral uptake additives need usage guidance and farm-level feedback before repeat purchasing. Supplier-led service forms part of the buying decision.
- Direct sales are expected to account for 52.0% share in 2026, supported by technical service needs during feed trials. Alltech reported world feed output rose 2.9% in 2025 to 1.44 billion metric tonnes, showing why large feed programs value direct supplier accountability.
- Feed mill contracts and online technical platforms serve buyers needing different access models. Direct sales keep selection strength once additive performance must be explained through trials and troubleshooting support.
What are the drivers, restraints, and opportunities in the Mineral Uptake Additives Market?
Near-term purchases are shaped by feed efficiency and species-specific formulation needs outlined below.
- Driver: Feed-cost pressure and raw-material variability push buyers toward additives improving mineral use and diet predictability.
- Restraint: Adoption slows as farm trials and mill-handling practices fail to align across species programs.
- Opportunity: Species-specific premixes and technical service packages create a practical path into mills needing measurable feed outcomes.
Feed efficiency drives demand as compound feed output expands and animal protein programs require better mineral use. USDA ERS projected global coarse grain supply at 2,156 million MT in 2026/27, making mineral uptake evidence useful as feed programs handle changing grain availability. Suppliers able to connect additive inclusion with feed conversion and mineral-use evidence can protect pricing during ingredient-cost changes.
Validation cost restrains adoption across smaller mills and fragmented farm networks. EFSA noted updated efficacy guidance for feed additives applied from 1 December 2024, covering study type and reporting principles. Suppliers without structured trial packs may face slower approval from quality and farm operations teams.
Species-specific premixes create a higher-value route beyond basic additive supply. OECD-FAO projected in 2025 that meat and eggs output would rise 17% through 2034, and livestock inventories would expand 7%.Vendors that back their products with species-specific data and premix support are more likely to keep buyers as long-term customers, even in complex nutrition programs.
Which country CAGRs are profiled in the mineral uptake additives market?
.webp "Top Country Growth Comparison Mineral Uptake Additives Market Cagr (2026 2036)")
| Country | CAGR |
|---|---|
| India | 6.7% |
| China | 5.6% |
| United States | 4.4% |
| South Korea | 4.3% |
| United Kingdom | 4.1% |
| Germany | 3.8% |
| Japan | 3.2% |
Source: Future Market Insights analysis, 2026.
How do country-level CAGRs compare in the mineral uptake additives market?
Country CAGR profiles in the mineral uptake additives market reflect livestock intensity and supplier documentation needs. India and China connect expansion with animal protein scale and feed-mill modernization. United States and South Korea form a mid-tier adoption band shaped by corn-feed use and concentrated livestock systems. United Kingdom and Germany show steadier purchasing through feed quality review and controlled additive approval. Japan reflects a careful evidence cycle guided by feed import reliance and formulation discipline.
- India is estimated at 6.7% CAGR through 2036, supported by animal protein scale. PIB reported 10.50 million tonnes of meat output in 2024-25 including 5.18 million tonnes from poultry, making mineral-use evidence useful for broiler and dairy feed approvals.
- China is projected at 5.6% CAGR by 2036, helped by compound-feed demand. USDA FAS forecast major-grain feed and residual use at 290.7 MMT in MY2026/27, supporting additives that manage grain-quality variation.
- United States is expected to expand at 4.4% CAGR through 2036, reinforced by USDA ERS reporting 2025/26 corn feed and residual use at 6.2 billion bushels, keeping mineral absorption linked to feed-efficiency review.
- South Korea is forecast to record 4.3% CAGR during the forecast period, aided by poultry concentration. Ministry of Data and Statistics counted 96.463 million broilers in Q1 2026, raising need for mineral performance checks.
- United Kingdom is projected to rise at 4.1% CAGR through 2036, shaped by AHDB reporting 11.4 Mt of GB animal feed output from July to April, strengthening demand for additives reducing ration rework.
- Germany is forecast to grow at 3.8% CAGR by 2036, underpinned by FEFAC’s 2025 EU cattle feed forecast of 41.285 million tonnes and Germany’s 1.2% output increase, supporting ruminant mineral-use documentation.
- Japan is set to post 3.2% CAGR over the forecast period, guided by USDA FAS reporting nearly 24 million MT of annual formula feed and 27% layer consumption, favoring low-variation additives for controlled diets.
Who are the notable companies in the Mineral Uptake Additives Market?
Cargill, ADM, DSM-Firmenich, Kemin Industries, Alltech, Novonesis, Adisseo, and Trouw Nutrition (Nutreco) are the notable companies shaping mineral uptake additives and animal nutrition support pathways.
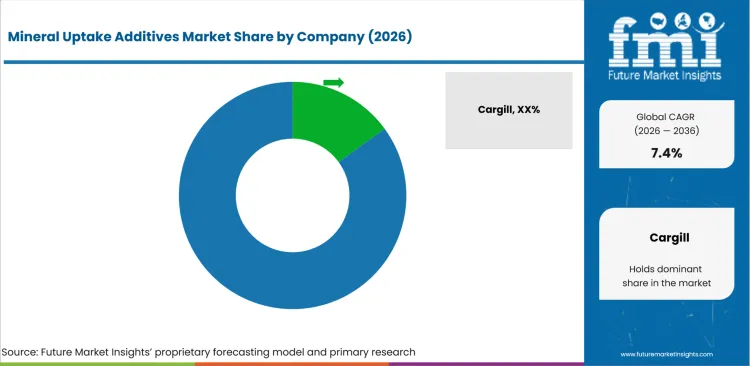
Competition in mineral uptake additives divides by portfolio depth and field support. Feed and ingredient suppliers compete through commercial access and supply assurance. Specialty additive firms compete through species evidence and technical service. Biotechnology specialists compete across enzyme and biosolution integration with nutrition programs.
- Cargill, ADM, and Trouw Nutrition compete based on formulation support and troubleshooting after trial-stage adoption.
- Kemin Industries, Alltech, and Adisseo compete led by focused mineral and performance-support programs across commercial diets.
- DSM-Firmenich and Novonesis compete depending on biosolution depth and enzyme-linked nutrition support across feed manufacturing systems.
Competitive Benchmarking: Mineral Uptake Additives Market
| Company | Species Coverage | Technical Service Match | Premix or Mill Integration | Geographic Reach |
|---|---|---|---|---|
| Cargill | High | High | High | Global |
| ADM | Medium | Medium | Medium | Global |
| DSM-Firmenich | High | High | High | Global |
| Kemin Industries | Strong | Strong | Strong | Global |
| Alltech | Strong | Strong | Strong | Global |
| Novonesis | High | High | High | Global |
| Adisseo | High | High | High | Global |
| Trouw Nutrition (Nutreco) | Strong | Strong | Strong | Global |
Source: Future Market Insights competitive analysis, 2026.
Key Developments in the Mineral Uptake Additives Market
- In June 2025, Novonesis completed acquisition of dsm-firmenich’s part of the Feed Enzyme Alliance. Deal completion gave Novonesis control over animal feed enzyme sales and distribution activities, strengthening animal biosolutions reach.
- In March 2025, Cargill Animal Nutrition & Health announced new mycotoxin and poultry gut-health research for World Mycotoxin Forum 2025. Research update helped feed buyers assess contamination risk and quality-control planning.
- In March 2026, Adisseo launched Sanion Tetra 50 and Sanion Tetra 70, protected sodium butyrate additives for animal feed. Launch activity expanded gut-health support options for buyers evaluating handling quality and active-content concentration.
Key Players in the Mineral Uptake Additives Market
Integrated Feed and Ingredient Suppliers
- Cargill
- ADM
- Trouw Nutrition (Nutreco)
Specialty Additive Suppliers
- Kemin Industries
- Alltech
- Adisseo
Biotechnology and Enzyme Specialists
- DSM-Firmenich
- Novonesis
Mineral Uptake Additives Market - Report Scope
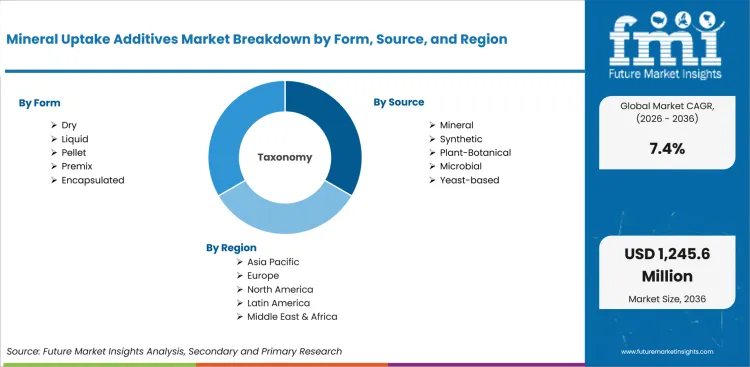
| Coverage field | Report scope |
|---|---|
| Market breakdown | Mineral Uptake Additives Market Breakdown By Form, Source, Livestock, Function and Sales Channel |
| Market Definition | Feed additive products used to improve mineral availability, nutrient utilization, gut-health support, and formulation consistency across livestock diets |
| Regions Covered | North America, Latin America, Western Europe, Eastern Europe, East Asia, South Asia and Pacific, Middle East and Africa |
| Countries Covered | United States, United Kingdom, Germany, Japan, China, South Korea, India and 30+ countries |
| Key Companies Profiled | Cargill, ADM, DSM-Firmenich, Kemin Industries, Alltech, Novonesis, Adisseo, Trouw Nutrition (Nutreco) |
| Forecast Period | 2026 to 2036 |
| Approach | Hybrid bottom-up and top-down methodology using feed output, livestock intensity, premix adoption, additive pricing, supplier portfolios, and sales-channel and country-level nutrition signals |
Source: Future Market Insights analysis, 2026.
Mineral Uptake Additives Market - Research Methodology
| Method | Approach |
|---|---|
| Primary Research | FMI analysts reviewed inputs from feed mill managers, animal nutritionists, premix suppliers, additive formulators, distributors, integrators, and farm operations specialists. Discussions focused on dosing behavior, species evidence, mineral-use outcomes, supplier selection, and adoption barriers. |
| Desk Research | Desk research covered livestock statistics, feed production signals, ingredient approval guidance, company launches, animal nutrition product information, official agriculture datasets, and credible feed association reports. Product coverage was checked against form, source, livestock, function, sales channel, and commercial application. |
| Market Sizing and Forecasting | Model design combined 2026 baseline value, segment shares, additive price bands, livestock intensity, commercial feed output, premix penetration, supplier reach, and country-level adoption signals. Forecast assumptions were adjusted for evidence quality, feed-mill handling, and species-specific usage. |
| Data Validation | Forecasts were checked against feed output data, animal production indicators, regulatory review signals, company product activity, and supplier qualification patterns. Company portfolios were reviewed to avoid counting adjacent products without mineral uptake additive use. |
Mineral Uptake Additives Market by Segments
Mineral Uptake Additives Market segmented by Form:
- Dry
- Liquid
- Pellet
- Premix
- Encapsulated
Mineral Uptake Additives Market segmented by Source:
- Synthetic
- Microbial
- Plant/Botanical
- Mineral
- Yeast-based
Mineral Uptake Additives Market segmented by Livestock:
- Poultry
- Swine
- Ruminants
- Aquaculture
- Equine & Pets
Mineral Uptake Additives Market segmented by Function:
- Gut Health
- Growth Performance
- Immunity
- Nutrient Utilization
- Stress Management
Mineral Uptake Additives Market segmented by Sales Channel:
- Direct Sales
- Feed Mill Contracts
- Distributor Sales
- Nutrition Consultant Channels
- Online Technical Platforms
Mineral Uptake Additives Market by Region:
- North America
- United States
- Canada
- Latin America
- Brazil
- Mexico
- Chile
- Rest of Latin America
- Western Europe
- Germany
- UK
- Italy
- Spain
- France
- Nordic
- BENELUX
- Rest of Western Europe
- Eastern Europe
- Russia
- Poland
- Hungary
- Balkan & Baltic
- Rest of Eastern Europe
- East Asia
- China
- Japan
- South Korea
- South Asia and Pacific
- India
- ASEAN
- Australia & New Zealand
- Rest of South Asia and Pacific
- Middle East & Africa
- Kingdom of Saudi Arabia
- Other GCC Countries
- Turkiye
- South Africa
- Other African Union
- Rest of Middle East & Africa
Research Sources and Bibliography
- Adisseo. (2026, March 1). Adisseo expands butyrate portfolio with Sanion Tetra. Adisseo.
- Agriculture and Horticulture Development Board. (2026, June 4). GB animal feed production. Agriculture and Horticulture Development Board.
- Alltech. (2026, April 21). 2026 Alltech Agri-Food Outlook shares global feed production survey data. Alltech.
- Cargill. (2025, March 24). Cargill Animal Nutrition & Health presents new insights on mycotoxin contamination and poultry gut health. Cargill.
- EFSA. (2024, December 4). Online event: Update on FEEDAP guidance on the assessment of the efficacy of feed additives: what’s new. European Food Safety Authority.
- European Commission. (2026). Feed additives. European Commission.
- FAO. (2025, December 31). Agricultural production statistics 2010-2024. Food and Agriculture Organization of the United Nations.
- FDA. (2025, September 15). Animal Food Ingredient Consultation. USA Food and Drug Administration.
- FEFAC. (2025, May). EU compound feed production market forecast 2025. European Feed Manufacturers’ Federation.
- Ministry of Data and Statistics. (2026, April 24). Livestock statistics in the first quarter of 2026. Ministry of Data and Statistics.
- Novonesis. (2025, June 2). Deal to acquire dsm-firmenich’s share of the Feed Enzyme Alliance is completed. Novonesis.
- OECD and FAO. (2025, July 15). OECD-FAO Agricultural Outlook 2025-2034. OECD Publishing and Food and Agriculture Organization of the United Nations.
- Press Information Bureau. (2025, November 26). Release of Basic Animal Husbandry Statistics 2025 on National Milk Day 2025. Ministry of Fisheries, Animal Husbandry and Dairying.
- USDA Economic Research Service. (2025, September 16). Feed Outlook: September 2025. USA Department of Agriculture.
- USDA Economic Research Service. (2026, January 14). Feed Outlook: January 2026. USA Department of Agriculture.
- USDA Economic Research Service. (2026, May 14). Feed Outlook: May 2026. USA Department of Agriculture.
- USDA Foreign Agricultural Service. (2026, March 18). Japan: Grain and Feed Annual. USA Department of Agriculture.
- USDA Foreign Agricultural Service. (2026, March 19). China: Grain and Feed Annual. USA Department of Agriculture.
- USDA National Agricultural Statistics Service. (2026, April 30). Poultry - Production and Value 2025 Summary. USA Department of Agriculture.
- USA Geological Survey. (2026). Phosphate rock - Mineral Commodity Summaries 2026. USA Geological Survey.
- This bibliography is provided for reader reference and is not exhaustive. The full report contains the complete reference list and detailed citations.
This Report Answers
- What is the expected global value of the mineral uptake additives market in 2026 and 2036?
- What CAGR is forecast for mineral uptake additives during the 2026 to 2036 period?
- Which form segment is used to assess dry mineral uptake additive demand in 2026?
- Why do feed mills buy mineral uptake additives with documented nutrient utilization evidence?
- How do poultry diets and mineral-source choices shape additive selection?
- Which countries are compared in the mineral uptake additives market forecast?
- Which companies compete across mineral uptake additives and animal nutrition support pathways?
- What mineral uptake additive systems and applications are included within the market definition?
- How does FMI size and forecast mineral uptake additive demand across segments and countries?
- What implementation and supplier-selection factors should executives assess?
Frequently Asked Questions
What is driving demand in the mineral uptake additives market?
Demand is driven by feed-cost pressure and buyer preference for additives backed by species-level evidence.
Why should executives track the mineral uptake additives market?
Executives should track mineral uptake additive demand since feed efficiency affects animal output and supplier accountability.
What business problem does the mineral uptake additives market address?
Mineral uptake additives help feed buyers improve nutrient availability and reduce avoidable formulation rework across commercial diets.
What should sourcing leaders evaluate before selecting suppliers?
Sourcing leaders should compare trial evidence and troubleshooting capability before supplier approval.
What can limit return on investment for buyers?
Return on investment can be delayed if additive claims lack species evidence or mill handling creates extra formulation work.
How can suppliers build executive confidence?
Suppliers build confidence through measured mineral-use outcomes and technical support during diet rollout.
Preview the report firsthand - request a free sample
Get SampleGet the brochure for pricing and purchase details.
Get PDFTable of Content
- Key Takeaways
- Market Size and CAGR
- Top Growth Driver
- Fastest Growing Segment
- Leading Region
- Key Companies
- Emerging Opportunities
- Executive Summary
- Global Market Outlook
- Demand-side Trends
- Supply-side Trends
- Technology Roadmap Analysis
- Analysis and Recommendations
- Analyst Perspective (What is happening? Why now? What should investors know?)
- Key Questions Answered
- How large is the market?
- What is the CAGR?
- What are key trends?
- Which region dominates?
- Who are the leaders?
- Market Overview
- Market Coverage / Taxonomy
- Market Definition / Scope / Limitations
- Research Methodology
- Chapter Orientation
- Analytical Lens and Working Hypotheses
- Market Structure, Signals, and Trend Drivers
- Benchmarking and Cross-market Comparability
- Market Sizing, Forecasting, and Opportunity Mapping
- Research Design and Evidence Framework
- Desk Research Programme (Secondary Evidence)
- Expert Input and Fieldwork (Primary Evidence)
- Tooling, Models, and Reference Databases
- Data Engineering and Model Build
- Quality Assurance and Audit Trail
- Market Background
- Market Dynamics (Drivers, Restraints, Opportunity, Trends)
- Scenario Forecast (Optimistic, Likely, Conservative)
- Impact Analysis
- AI Impact
- Sustainability Impact
- Regulatory Impact
- Technology Impact
- Consumer / Buyer Analysis
- Purchase Drivers
- Adoption Barriers
- Buyer Journey
- Opportunity Map Analysis
- Product Life Cycle Analysis
- Supply Chain Analysis
- Investment Feasibility Matrix
- Value Chain Analysis
- PESTLE and Porter's Analysis
- Regulatory Landscape
- Regional Parent Market Outlook
- Production and Consumption Statistics
- Import and Export Statistics
- Global Market Analysis and Forecast, 2021 to 2036
- Historical Market Size Value (USD Million) & Volume (Unit) Analysis, 2021 to 2025
- Current and Future Market Size Value (USD Million) & Volume (Unit) Projections, 2026 to 2036
- Y-o-Y Growth Trend Analysis
- Absolute $ Opportunity Analysis
- Global Market Pricing Analysis, 2021 to 2036
- Global Market Analysis and Forecast, By Form, 2021 to 2036
- Introduction / Key Findings
- Historical Market Size Value (USD Million) & Volume (Unit) Analysis By Form, 2021 to 2025
- Current and Future Market Size Value (USD Million) & Volume (Unit) Analysis and Forecast By Form, 2026 to 2036
- Dry
- Liquid
- Pellet
- Premix
- Encapsulated
- Dry
- Y-o-Y Growth Trend Analysis By Form, 2021 to 2025
- Absolute $ Opportunity Analysis By Form, 2026 to 2036
- Global Market Analysis and Forecast, By Source, 2021 to 2036
- Introduction / Key Findings
- Historical Market Size Value (USD Million) & Volume (Unit) Analysis By Source, 2021 to 2025
- Current and Future Market Size Value (USD Million) & Volume (Unit) Analysis and Forecast By Source, 2026 to 2036
- Mineral
- Synthetic
- Plant-Botanical
- Microbial
- Yeast-based
- Mineral
- Y-o-Y Growth Trend Analysis By Source, 2021 to 2025
- Absolute $ Opportunity Analysis By Source, 2026 to 2036
- Global Market Analysis and Forecast, By Livestock, 2021 to 2036
- Introduction / Key Findings
- Historical Market Size Value (USD Million) & Volume (Unit) Analysis By Livestock, 2021 to 2025
- Current and Future Market Size Value (USD Million) & Volume (Unit) Analysis and Forecast By Livestock, 2026 to 2036
- Poultry
- Swine
- Ruminants
- Aquaculture
- Equine & Pets
- Poultry
- Y-o-Y Growth Trend Analysis By Livestock, 2021 to 2025
- Absolute $ Opportunity Analysis By Livestock, 2026 to 2036
- Global Market Analysis and Forecast, By Function, 2021 to 2036
- Introduction / Key Findings
- Historical Market Size Value (USD Million) & Volume (Unit) Analysis By Function, 2021 to 2025
- Current and Future Market Size Value (USD Million) & Volume (Unit) Analysis and Forecast By Function, 2026 to 2036
- Nutrient Utilization
- Stress Management
- Gut Health
- Growth Performance
- Immunity
- Nutrient Utilization
- Y-o-Y Growth Trend Analysis By Function, 2021 to 2025
- Absolute $ Opportunity Analysis By Function, 2026 to 2036
- Global Market Analysis and Forecast, By Sales Channel, 2021 to 2036
- Introduction / Key Findings
- Historical Market Size Value (USD Million) & Volume (Unit) Analysis By Sales Channel, 2021 to 2025
- Current and Future Market Size Value (USD Million) & Volume (Unit) Analysis and Forecast By Sales Channel, 2026 to 2036
- Direct Sales
- Feed Mill Contracts
- Distributor Sales
- Nutrition Consultant Channels
- Online Technical Platforms
- Direct Sales
- Y-o-Y Growth Trend Analysis By Sales Channel, 2021 to 2025
- Absolute $ Opportunity Analysis By Sales Channel, 2026 to 2036
- Global Market Analysis and Forecast, By Region, 2021 to 2036
- Introduction
- Historical Market Size Value (USD Million) & Volume (Unit) Analysis By Region, 2021 to 2025
- Current Market Size Value (USD Million) & Volume (Unit) Analysis and Forecast By Region, 2026 to 2036
- North America
- Latin America
- Western Europe
- Eastern Europe
- East Asia
- South Asia and Pacific
- Middle East & Africa
- Market Attractiveness Analysis By Region
- North America Market Analysis and Forecast, By Country, 2021 to 2036
- Historical Market Size Value (USD Million) & Volume (Unit) Trend Analysis By Market Taxonomy, 2021 to 2025
- Market Size Value (USD Million) & Volume (Unit) Forecast By Market Taxonomy, 2026 to 2036
- By Country
- USA
- Canada
- Mexico
- By Form
- By Source
- By Livestock
- By Function
- By Sales Channel
- By Country
- Market Attractiveness Analysis
- By Country
- By Form
- By Source
- By Livestock
- By Function
- By Sales Channel
- Key Takeaways
- Latin America Market Analysis and Forecast, By Country
- Historical Market Size Value (USD Million) & Volume (Unit) Trend Analysis By Market Taxonomy, 2021 to 2025
- Market Size Value (USD Million) & Volume (Unit) Forecast By Market Taxonomy, 2026 to 2036
- By Country
- Brazil
- Chile
- Rest of Latin America
- By Form
- By Source
- By Livestock
- By Function
- By Sales Channel
- By Country
- Market Attractiveness Analysis
- By Country
- By Form
- By Source
- By Livestock
- By Function
- By Sales Channel
- Key Takeaways
- Western Europe Market Analysis and Forecast, By Country
- Historical Market Size Value (USD Million) & Volume (Unit) Trend Analysis By Market Taxonomy, 2021 to 2025
- Market Size Value (USD Million) & Volume (Unit) Forecast By Market Taxonomy, 2026 to 2036
- By Country
- Germany
- UK
- Italy
- Spain
- France
- Nordic
- BENELUX
- Rest of Western Europe
- By Form
- By Source
- By Livestock
- By Function
- By Sales Channel
- By Country
- Market Attractiveness Analysis
- By Country
- By Form
- By Source
- By Livestock
- By Function
- By Sales Channel
- Key Takeaways
- Eastern Europe Market Analysis and Forecast, By Country
- Historical Market Size Value (USD Million) & Volume (Unit) Trend Analysis By Market Taxonomy, 2021 to 2025
- Market Size Value (USD Million) & Volume (Unit) Forecast By Market Taxonomy, 2026 to 2036
- By Country
- Russia
- Poland
- Hungary
- Balkan & Baltic
- Rest of Eastern Europe
- By Form
- By Source
- By Livestock
- By Function
- By Sales Channel
- By Country
- Market Attractiveness Analysis
- By Country
- By Form
- By Source
- By Livestock
- By Function
- By Sales Channel
- Key Takeaways
- East Asia Market Analysis and Forecast, By Country
- Historical Market Size Value (USD Million) & Volume (Unit) Trend Analysis By Market Taxonomy, 2021 to 2025
- Market Size Value (USD Million) & Volume (Unit) Forecast By Market Taxonomy, 2026 to 2036
- By Country
- China
- Japan
- South Korea
- By Form
- By Source
- By Livestock
- By Function
- By Sales Channel
- By Country
- Market Attractiveness Analysis
- By Country
- By Form
- By Source
- By Livestock
- By Function
- By Sales Channel
- Key Takeaways
- South Asia and Pacific Market Analysis and Forecast, By Country
- Historical Market Size Value (USD Million) & Volume (Unit) Trend Analysis By Market Taxonomy, 2021 to 2025
- Market Size Value (USD Million) & Volume (Unit) Forecast By Market Taxonomy, 2026 to 2036
- By Country
- India
- ASEAN
- Australia & New Zealand
- Rest of South Asia and Pacific
- By Form
- By Source
- By Livestock
- By Function
- By Sales Channel
- By Country
- Market Attractiveness Analysis
- By Country
- By Form
- By Source
- By Livestock
- By Function
- By Sales Channel
- Key Takeaways
- Middle East & Africa Market Analysis and Forecast, By Country
- Historical Market Size Value (USD Million) & Volume (Unit) Trend Analysis By Market Taxonomy, 2021 to 2025
- Market Size Value (USD Million) & Volume (Unit) Forecast By Market Taxonomy, 2026 to 2036
- By Country
- Kingdom of Saudi Arabia
- Other GCC Countries
- Türkiye
- South Africa
- Other African Union
- Rest of Middle East & Africa
- By Form
- By Source
- By Livestock
- By Function
- By Sales Channel
- By Country
- Market Attractiveness Analysis
- By Country
- By Form
- By Source
- By Livestock
- By Function
- By Sales Channel
- Key Takeaways
- Key Countries Market Analysis
- USA
- Pricing Analysis
- Market Share Analysis, 2025
- By Form
- By Source
- By Livestock
- By Function
- By Sales Channel
- Canada
- Pricing Analysis
- Market Share Analysis, 2025
- By Form
- By Source
- By Livestock
- By Function
- By Sales Channel
- Mexico
- Pricing Analysis
- Market Share Analysis, 2025
- By Form
- By Source
- By Livestock
- By Function
- By Sales Channel
- Brazil
- Pricing Analysis
- Market Share Analysis, 2025
- By Form
- By Source
- By Livestock
- By Function
- By Sales Channel
- Chile
- Pricing Analysis
- Market Share Analysis, 2025
- By Form
- By Source
- By Livestock
- By Function
- By Sales Channel
- Germany
- Pricing Analysis
- Market Share Analysis, 2025
- By Form
- By Source
- By Livestock
- By Function
- By Sales Channel
- UK
- Pricing Analysis
- Market Share Analysis, 2025
- By Form
- By Source
- By Livestock
- By Function
- By Sales Channel
- Italy
- Pricing Analysis
- Market Share Analysis, 2025
- By Form
- By Source
- By Livestock
- By Function
- By Sales Channel
- Spain
- Pricing Analysis
- Market Share Analysis, 2025
- By Form
- By Source
- By Livestock
- By Function
- By Sales Channel
- France
- Pricing Analysis
- Market Share Analysis, 2025
- By Form
- By Source
- By Livestock
- By Function
- By Sales Channel
- India
- Pricing Analysis
- Market Share Analysis, 2025
- By Form
- By Source
- By Livestock
- By Function
- By Sales Channel
- ASEAN
- Pricing Analysis
- Market Share Analysis, 2025
- By Form
- By Source
- By Livestock
- By Function
- By Sales Channel
- Australia & New Zealand
- Pricing Analysis
- Market Share Analysis, 2025
- By Form
- By Source
- By Livestock
- By Function
- By Sales Channel
- China
- Pricing Analysis
- Market Share Analysis, 2025
- By Form
- By Source
- By Livestock
- By Function
- By Sales Channel
- Japan
- Pricing Analysis
- Market Share Analysis, 2025
- By Form
- By Source
- By Livestock
- By Function
- By Sales Channel
- South Korea
- Pricing Analysis
- Market Share Analysis, 2025
- By Form
- By Source
- By Livestock
- By Function
- By Sales Channel
- Russia
- Pricing Analysis
- Market Share Analysis, 2025
- By Form
- By Source
- By Livestock
- By Function
- By Sales Channel
- Poland
- Pricing Analysis
- Market Share Analysis, 2025
- By Form
- By Source
- By Livestock
- By Function
- By Sales Channel
- Hungary
- Pricing Analysis
- Market Share Analysis, 2025
- By Form
- By Source
- By Livestock
- By Function
- By Sales Channel
- Kingdom of Saudi Arabia
- Pricing Analysis
- Market Share Analysis, 2025
- By Form
- By Source
- By Livestock
- By Function
- By Sales Channel
- Türkiye
- Pricing Analysis
- Market Share Analysis, 2025
- By Form
- By Source
- By Livestock
- By Function
- By Sales Channel
- South Africa
- Pricing Analysis
- Market Share Analysis, 2025
- By Form
- By Source
- By Livestock
- By Function
- By Sales Channel
- USA
- Market Structure Analysis
- Competition Dashboard
- Competition Benchmarking
- Market Share Analysis of Top Players
- By Regional
- By Form
- By Source
- By Livestock
- By Function
- By Sales Channel
- Emerging Startups
- Innovation Benchmarking
- Competition Analysis
- Competition Deep Dive
- Cargill
- Overview
- Product Portfolio
- Profitability by Market Segments (Product/Region/Sales Channel)
- Sales Footprint
- Strategy Overview
- Marketing Strategy
- Product Strategy
- Channel Strategy
- ADM
- Trouw Nutrition (Nutreco)
- Kemin Industries
- Alltech
- Adisseo
- DSM-Firmenich
- Novonesis
- Cargill
- Case Studies
- Success Stories
- Recent Developments
- Competition Deep Dive
- Assumptions & Acronyms Used


