

- Market Size (2026)
- USD 369.5 Mn
- Forecast (2036)
- USD 984.9 Mn
- CAGR (2026 to 2036)
- 10.3%
How big is Organic Mineral Complexes Market in 2026?
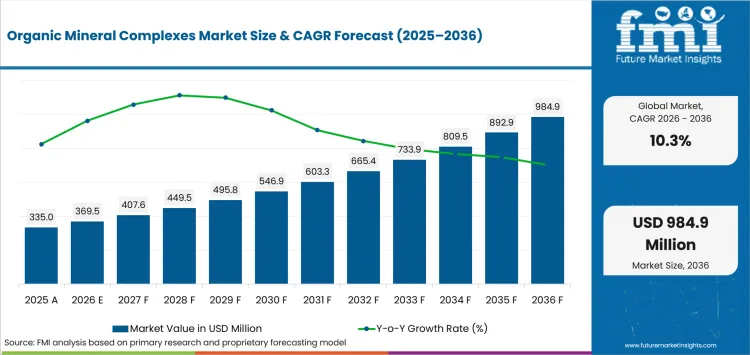
USD 369.5 million in 2026 and USD 984.9 million by 2036 at a 10.3% CAGR.
Demand for organic mineral complexes is projected to expand at 10.3% CAGR between 2026 and 2036, increasing valuation from USD 369.5 million in 2026 to USD 984.9 million by 2036. England illustrates the shift toward planned nutrition: Defra reported in June 2026 that 69% of farmers had a nutrient management plan. Formal planning gives agronomists a clearer trigger for diagnosed micronutrient correction and reduces speculative preventive dosing.
Application infrastructure changes how the global forecast converts into local orders. In April 2025, Japan's agriculture ministry certified nine new smart-agriculture development and supply plans, bringing the cumulative total to 17. One certified plan uses crop maps for variable-rate fertilization. Such programs give soluble micronutrients a defined dosing route. The forecast represents USD 615.4 million of incremental value, but commercial capture still depends on compatible equipment and agronomic rules.
Key Takeaways
- Planned nutrient management and precision application are shifting micronutrient correction toward documented crop programs with clearer repeat-purchase triggers.
- EDTA / synthetic chelates are projected to account for 45.3% of the chelating / complexing agent category in 2026 because formulators already understand their stability windows and metal coverage.
- Iron is estimated to hold 47.6% of the nutrient category in 2026 because alkaline conditions can sharply restrict iron availability and make deficiency visible in the crop.
- Cereals & grains are forecast to represent 39.1% of the crop type category in 2026, supported by broad planted area and repeatable field application schedules.
- Premium complexes lose their commercial case if the ligand, dose, or application route does not match local pH and a diagnosed nutrient constraint.
- Some of the key players in this market include ADOB, Aries Agro, Brandt, Rovensa Next (Tradecorp), BASF, Nouryon, Yara International, and ICL Group.
Analyst Perspective
"Organic mineral complexes earn a premium only where the ligand is matched to a diagnosed deficiency, field pH, and the chosen application route. Commercial value comes from repeatable selection rules and local agronomic support that prevent an expensive chelate from becoming an unnecessary input."
- Nandini Roy Choudhury, Principal Consultant, Future Market Insights
How is the organic mineral complexes market segmented?
The market is assessed by chelating / complexing agent, nutrient, crop type, application method, and sales channel.
The chelating / complexing agent category covers EDTA / synthetic chelates, amino acid complexes, organic acid complexes, and lignosulfonates & others. Nutrient includes iron, zinc, manganese & copper, boron / moly & multi-nutrient, and others. Crop type covers cereals & grains, fruits & vegetables, oilseeds & pulses, turf & ornamentals, and others. Application method separates fertigation, foliar, soil, and others, while sales channel covers agri-input distributors, cooperatives, agri-retail chains, online / direct-to-farm, and others.
What makes EDTA / synthetic chelates central to the chelating / complexing agent category?
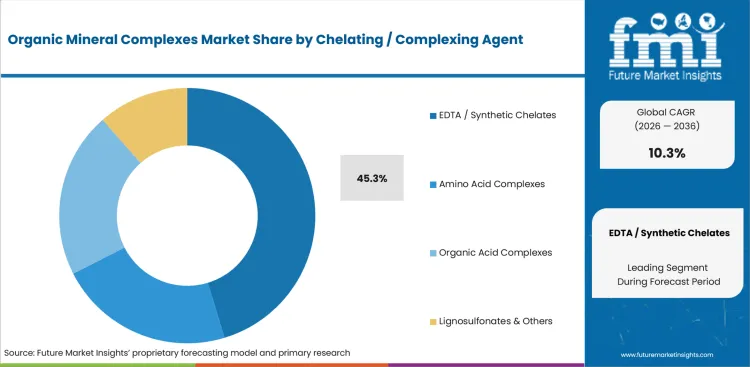
Iron, zinc, manganese, and copper can all be formulated with synthetic chelates whose stability ranges are well understood. EDTA fits familiar liquid and water-soluble manufacturing routes, but field pH and carbonate levels can make another ligand the better technical choice.
- By chelating / complexing agent, EDTA / synthetic chelates are estimated to hold 45.3% in 2026 owing to familiar formulation routes and broad metal coverage.
- In June 2026, BASF announced a North American price increase for selected Trilon chelating agents used in agriculture, citing raw materials, energy, and logistics. The action confirms active agricultural supply and exposes cost sensitivity in chelate chemistry.
Why does iron lead the nutrient category?
Iron has a clear agronomic trigger because chlorosis can appear even where total soil iron is not low. Chelation keeps iron soluble long enough for uptake, with ligand strength becoming more important as alkalinity and carbonate concentrations rise.
- In 2026, iron is expected to lead the nutrient category with 47.6% share because precipitation risk rises sharply under alkaline and calcareous soil conditions.
- Nouryon documented in October 2025 that iron precipitation in alkaline and calcareous soils reduces chlorophyll production and photosynthesis. Its HBED chemistry targets those high-pH conditions, giving formulators a distinct qualification route for difficult soils.
How do cereals & grains sustain leadership within crop type?
Cereals support volume because modest micronutrient doses can be repeated over very large planted areas. The commercial case is strongest after soil or tissue testing identifies a constraint that can be corrected within an existing field pass.
- Cereals & grains are set to lead crop type with 39.1% share in 2026 due to broad planted area and compatibility with routine field applications.
- Destatis estimated in May 2025 that Germany would plant 5.86 million hectares of cereals for the 2025 harvest. That scale gives crop-nutrition companies a large addressable area. A micronutrient still needs a documented deficiency to earn the added spend.
What supports fertigation as the leading application method?
Fertigation places soluble micronutrients into irrigation schedules so smaller doses can follow crop stage. Performance depends on water quality, injector compatibility, and solution stability. Split dosing can also reduce corrective rescue applications after visible deficiency in practice.
- Fertigation is projected to hold 43.2% share in 2026 owing to irrigation systems that can meter soluble complexes at several crop stages.
- South Korea selected five open-field smart-agriculture districts in March 2026 of roughly 500 hectares each and included smart water and fertilizer supply systems. Controlled delivery gives soluble complexes a defined dosing route, provided compatibility is demonstrated.
What drives agri-input distributors to lead the sales channel category?
Organic mineral complexes need more explanation than commodity fertilizer because ligand choice depends on crop symptoms, pH, and application route. Local distributors can diagnose that fit, carry several formulations, and support a first trial before the farm commits to repeat orders.
- The agri-input distributors segment is likely to capture 48.2% share in 2026 attributable to local inventory and agronomic advice during product selection.
- Defra found in June 2025 that 77% of English farms seeking professional nutrient-plan help used fertilizer advisers or agronomists. That advisory role gives distributors a practical route to qualify chelate choice before a premium product reaches the farm.
What are the drivers, restraints and opportunities in the Organic Mineral Complexes Market?
Precision nutrient management increases targeted use, higher fertilizer costs raise the return threshold, and data-led application systems give soluble complexes more repeatable delivery routes.
- Driver: Precision farming is expanding the number of crop programs where micronutrient correction can be tied to measured field conditions and scheduled application.
- Restraint: Higher fertilizer prices force growers to defend specialty input cost against simpler nutrient sources and other crop-protection priorities.
- Opportunity: Smart-farming programs can move complexed micronutrients into variable-rate or controlled delivery once formulations fit the equipment and agronomic prescription.
Precision farming increases demand by tying micronutrient correction to measured crop and field conditions. South Korea's agriculture ministry set a 2025-2029 plan in February 2025 to make 35% of 55,000 hectares of greenhouses smart farms and extend smart technology to 20% of major field-crop areas. Controlled production gives soluble complexes more scheduled dosing points, but diagnosis still determines whether the added chemistry earns repeat purchase.
Cost limits adoption because complexed micronutrients compete with bulk fertilizer and crop protection for the same seasonal budget. Eurostat reported in May 2026 that EU fertilizer and soil-improver prices were 8.0% higher year over year in the fourth quarter of 2025, with increases in 24 member countries. Higher input bills concentrate premium chelates in fields where a deficiency and expected response can be documented before purchase.
Repeat sales can move online after the first formulation choice has been validated by an agronomist or distributor. USDA NASS reported in August 2025 that 50% of USA farms used the internet to purchase agricultural inputs, up 18% from 2023. Digital reordering can lower transaction friction for established programs, but first-use conversion still depends on crop diagnosis, ligand fit, and clear application instructions.
Which country CAGRs are profiled in the Organic Mineral Complexes Market?
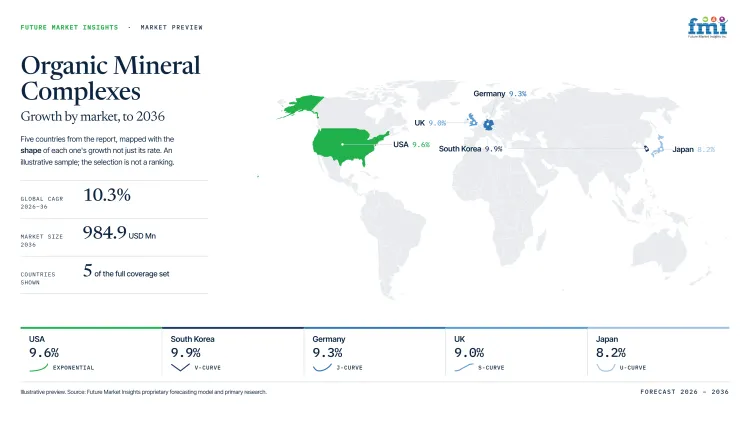
| Country | CAGR |
|---|---|
| South Korea | 9.9% |
| USA | 9.6% |
| Germany | 9.3% |
| UK | 9.0% |
| Japan | 8.2% |
How do country-level CAGRs compare in the Organic Mineral Complexes Market?
The five forecasts span 1.7 percentage points. South Korea and the USA form the upper group, Germany and the UK sit in a narrow middle range, and Japan records the lowest profiled rate. The gaps point to different application systems and service requirements rather than a simple ranking of current revenue or installed demand.
- South Korea is building local smart-farming support capacity for implementation.
- USA scale makes per-acre economics central to specialty-input trials.
- Germany requires formulations that fit several crop-application routes.
- UK recommendations are shaped by adviser-led nutrient planning and cost discipline.
- Japan ties smart-agriculture approval to labor-saving field operations.
Similar growth rates can therefore require different sales, training, and application strategies.
The full report provides country-level CAGR analysis across North America, Latin America, Western Europe, Eastern Europe, East Asia, South Asia and Pacific, and the Middle East and Africa.
Country-wise Analysis
- South Korean crop programs increasingly pair public smart-farming support with operator training and shared technical services, including open-field districts where water and fertilizer supply can be automated at field level for repeat treatment. MAFRA designated KOAT and KAPE as smart-farming support centres in June 2025, and organic mineral complex demand is forecast to rise at 9.9% CAGR over the assessment period because more farms can use programmable input delivery. Local service capacity remains the constraint: technicians must translate water quality, crop stage, and chelate compatibility into settings that farms can repeat without adding setup time or risking precipitation in irrigation equipment.
- Large US corn and wheat programs make per-acre economics decisive, so specialty micronutrients usually enter after a diagnosed constraint or a retailer-led field trial that compares crop response with the added formulation cost. USDA NASS estimated 95.2 million corn acres and 45.5 million wheat acres in June 2025, giving the USA a broad crop base for targeted programs despite uneven micronutrient need between soils and production regions. Organic mineral complex sales in the USA are projected to expand at 9.6% CAGR through 2036 owing to dealer reach, though repeat orders depend on crop response that can justify the formulation premium.
- German crop nutrition must work in broad-acre cereal systems that use different water access and application routes from intensive horticulture, which keeps foliar and soil programs relevant beside irrigated delivery. Destatis estimated 6.03 million hectares of cereals for the 2026 harvest in May 2026, with winter wheat representing 48% of that area and giving formulators a large commercial field-crop base for diagnosed micronutrient programs in Germany. Germany is projected to record 9.3% CAGR during the forecast period attributable to crop-specific nutrition, but distributors must support foliar, soil, and irrigation choices without turning ligand selection into another layer of farm complexity.
- UK nutrient recommendations increasingly sit inside formal farm plans, so agronomists must defend premium micronutrients against the same budget pressure affecting bulk fertilizer and explain why the selected ligand fits the diagnosed deficiency. The UK organic mineral complexes sector is forecast to advance at 9.0% CAGR through 2036 given diagnosed deficiencies that justify targeted treatment over routine application, especially where advisers already review nutrient plans each season. Defra reported in July 2026 that purchased fertilizer volume fell 4.6% in 2025 after changed buying patterns, which means local growth depends on documented crop need and simple selection rules that make the added spend defensible.
- Japanese smart-agriculture approvals are linking field data with machinery and crop operations, so specialty inputs must fit the farm technology already being qualified and remain easy to dose under labor-saving schedules. MAFF certified production-method innovation plans from two applicants in March 2025, giving equipment-linked nutrient programs a formal route into commercial farming without proving product demand by itself. Adoption of organic mineral complexes in Japan is estimated to expand at 8.2% CAGR through 2036 supported by labor-saving application, though vendors still need solubility, tank-mix, dosing, and application records before automated schedules can become routine purchasing in commercial greenhouse and field programs.
Who are the notable companies in the Organic Mineral Complexes Market?
ADOB, Aries Agro, Brandt, Rovensa Next (Tradecorp), BASF, Nouryon, Yara International, and ICL Group are the notable companies profiled in this market.
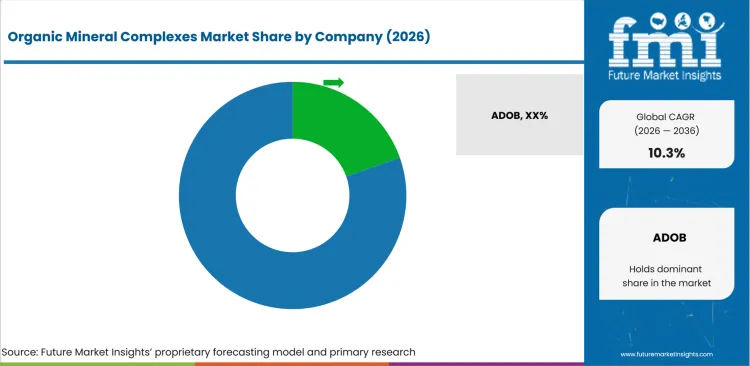
Competition separates into chelate chemistry, specialty crop formulation, and integrated crop nutrition. BASF and Nouryon supply upstream chelate chemistry, while ADOB applies chelation to agricultural micronutrients. Aries Agro, Brandt, and Rovensa Next work closer to farm programs. Yara International and ICL Group place micronutrients inside broader foliar and water-soluble portfolios. Entry therefore requires both formulation evidence and a channel that can explain pH, crop, and application fit before the first order.
- BASF, Nouryon, and ADOB form the chemistry-led group, with documented chelate production or agricultural micronutrient activity.
- Aries Agro, Brandt, and Rovensa Next (Tradecorp) focus on specialty crop nutrition, formulation breadth, and farm-facing technical support.
- Yara International and ICL Group place micronutrients within global specialty nutrition programs that include foliar and water-soluble delivery.
Competitive Benchmarking: Organic Mineral Complexes Market
| Company | Chelate Chemistry Breadth | Crop Nutrition Formulation Depth | Agronomic & Channel Integration | Geographic Reach |
|---|---|---|---|---|
| ADOB | High | High | High | Europe with international reach through Nouryon |
| Aries Agro | High | High | High | India, Middle East and selected export markets |
| Brandt | Medium | High | High | North America with international specialty-ag reach |
| Rovensa Next (Tradecorp) | Medium | High | High | Europe, Americas, Asia, Middle East and Africa |
| BASF | High | Medium | Medium | Global chemical and agricultural customer reach |
| Nouryon | High | High | High | Global crop-nutrition and specialty-chemicals reach |
| Yara International | Medium | High | High | Global crop-nutrition network |
| ICL Group | Medium | High | High | Europe, Americas and Asia-Pacific crop-nutrition reach |
Scoring basis: High requires broad current evidence in the criterion, Medium requires direct but narrower evidence, and Low requires a documented limitation. Chelate chemistry breadth covers multiple complexing systems or chelated nutrient lines. Formulation depth covers several crop-nutrition formats. Agronomic and channel integration covers field support, distributor reach, or application guidance. Geographic reach records documented operating scope without a score.
Key Developments in the Organic Mineral Complexes Market
- In March 2026, Yara International expanded laboratory facilities at its Hanninghof Research Centre for biological crop solutions and plant-nutrition research. The added test capacity can shorten evidence development for integrated specialty-nutrition programs. Field validation remains crop-specific.
- In February 2026, Aries Agro inaugurated a manufacturing unit at GIDC Sayakha in Gujarat with a planned 6,000-tonne annual capacity addition for boron and NPK water-soluble fertilizers. The project expands specialty-nutrition supply beyond chelated micronutrients alone.
- In April 2025, ICL Group expanded its North American crop-nutrition portfolio after acquiring Custom Ag Formulators and adding five brands including X-TRA liquid micronutrients. The acquisition gives retailers more liquid formats beside ICL water-soluble nutrition programs.
Key Players in the Organic Mineral Complexes Market
Integrated chelate chemistry suppliers
- BASF
- Nouryon
- ADOB
Specialty crop nutrition formulators
- Aries Agro
- Brandt
- Rovensa Next (Tradecorp)
Global specialty nutrition platforms
- Yara International
- ICL Group
Organic Mineral Complexes Market - Report Scope
| Coverage field | Report scope |
|---|---|
| Market breakdown | Chelating / complexing agent, nutrient, crop type, application method, sales channel, and region |
| Quantitative Units | USD million and CAGR in percentage terms |
| Market Definition | Revenue includes agricultural organic mineral complex and chelated micronutrient products within the stated segmentation. It excludes industrial chelates, human or animal mineral complexes, and downstream finished-product revenue outside crop nutrition. |
| Regions Covered | North America; Latin America; Western Europe; Eastern Europe; East Asia; South Asia and Pacific; Middle East and Africa |
| Countries Covered | South Korea, USA, Germany, UK, Japan, and 20+ countries included in the full report |
| Key Companies Profiled | ADOB, Aries Agro, Brandt, Rovensa Next (Tradecorp), BASF, Nouryon, Yara International, ICL Group |
| Forecast Period | 2026 to 2036 |
| Approach | Primary and secondary research with market triangulation. |
Organic Mineral Complexes Market - Research Methodology
| Method | Approach |
|---|---|
| Primary Research | FMI analysts gathered input from manufacturers, service providers, technology developers, distributors, end users, procurement teams, and subject-matter experts. Interviews examined purchasing decisions, product or service evaluation, adoption barriers, approval requirements, pricing considerations, and expectations for technical or commercial support. Respondents were also asked what evidence is required before a trial, pilot, or initial order develops into regular purchasing. |
| Desk Research | Desk research covered government statistics, regulatory publications, trade data, industry associations, technical literature, standards, company filings, product information, and official corporate announcements. Sources were reviewed for relevance, publication date, geographic coverage, and consistency with the defined market scope. Claims relating to performance, applications, approvals, capacity, investment, and commercial activity were retained only when supported by credible public evidence. |
| Market Sizing and Forecasting | The market model combined the baseline value with historical performance, segment structure, pricing and volume indicators, adoption levels, company participation, and country-level demand conditions. Forecast assumptions considered economic activity, investment trends, regulatory developments, technology adoption, purchasing cycles, supply availability, and barriers to wider market use. Segment and regional estimates were reconciled before the final market total was calculated. |
| Data Validation | Estimates were checked against multiple independent indicators, including public data, company activity, trade patterns, industry developments, and findings from primary interviews. Validation also tested whether products, services, applications, and company revenues fell within the defined market boundaries. Adjacent categories, unsupported claims, overlapping revenues, and activities without direct market relevance were excluded to reduce double counting and maintain consistency across segments and countries. |
Organic Mineral Complexes Market by Segments
Organic Mineral Complexes Market segmented by Chelating / Complexing Agent:
- EDTA / Synthetic Chelates
- Amino Acid Complexes
- Organic Acid Complexes
- Lignosulfonates & Others
Organic Mineral Complexes Market segmented by Nutrient:
- Iron
- Zinc
- Manganese & Copper
- Boron / Moly & Multi-Nutrient
- Others
Organic Mineral Complexes Market segmented by Crop Type:
- Cereals & Grains
- Fruits & Vegetables
- Oilseeds & Pulses
- Turf & Ornamentals
- Others
Organic Mineral Complexes Market segmented by Application Method:
- Fertigation
- Foliar
- Soil
- Others
Organic Mineral Complexes Market segmented by Sales Channel:
- Agri-Input Distributors
- Cooperatives
- Agri-Retail Chains
- Online / Direct-to-Farm
- Others
Organic Mineral Complexes Market by Region:
- North America
- United States
- Canada
- Latin America
- Brazil
- Mexico
- Argentina
- Chile
- Western Europe
- Germany
- France
- United Kingdom
- Italy
- Spain
- Benelux
- Nordics
- Eastern Europe
- Poland
- Czech Republic
- Romania
- Hungary
- East Asia
- China
- Japan
- South Korea
- South Asia and Pacific
- India
- ASEAN
- Australia and New Zealand
- Middle East and Africa
- GCC Countries
- South Africa
- Türkiye
- Israel
Research Sources and Bibliography
- Department for Environment, Food & Rural Affairs (2026, June 11). Nutrient management - Farm practices survey February 2026
- Ministry of Agriculture, Forestry and Fisheries of Japan (2025, April 25). Development and supply implementation plans certified under the Smart Agriculture Technology Utilization Promotion Act
- BASF (2026, June 5). BASF to adjust prices for select Trilon chelating agents in North America
- Nouryon (2025, October). Celebrating World Fertilizer Day with Innovation: HBED, the world’s strongest iron chelate
- Statistisches Bundesamt (Destatis) (2025, May 19). Leichter Anstieg der Getreideanbaufläche zur Ernte 2025 nach Tiefststand im Vorjahr
- Ministry of Agriculture, Food and Rural Affairs of the Republic of Korea (2026, March 3). Regional open-field smart agriculture development districts selected
- Department for Environment, Food & Rural Affairs (2025, June 12). Nutrient management - Farm practices survey February 2025
- Ministry of Agriculture, Food and Rural Affairs of the Republic of Korea (2025, February 26). S. Korea’s First Master Plan for Promotion of the Growth of the Smart-Farming Industry for the Years 2025-2029
- Eurostat (2026, May 19). Fertilisers price went up 8.0% in Q4 2025
- USA Department of Agriculture, National Agricultural Statistics Service (2025, August). Technology Use (Farm Computer Usage and Ownership)
- Ministry of Agriculture, Food and Rural Affairs of the Republic of Korea (2025, June 17). S. Korea Accelerates Turning Agricultural Production into Smart Farming through Smart Farming Support Centres
- USA Department of Agriculture, National Agricultural Statistics Service (2025, June 30). Corn planted acreage up 5% from 2024, soybean acreage down 4% from last year
- Statistisches Bundesamt (Destatis) (2026, May 19). Getreideanbaufläche 2026 hat sich nach Tiefststand von 2024 weiter stabilisiert
- Department for Environment, Food & Rural Affairs (2026, July 9). Agriculture in the United Kingdom 2025: Chapter 5, Productivity
- Ministry of Agriculture, Forestry and Fisheries of Japan (2025, March 7). Production method innovation plans certified under the Smart Agriculture Technology Utilization Promotion Act
- Yara International (2026, March 23). Yara expands research capabilities in biological crop solutions
- Aries Agro Limited (2026, February 12). Inauguration of manufacturing unit at GIDC Sayakha Industrial Estate
- ICL Group (2025, April 17). Introducing New ICL Products for Enhanced Crop Nutrition
- Yara International (2026, March 20). Yara publishes 2025 Annual Report
- Rovensa Next (2026, February 23). Rovensa Next launches two biosolutions in North America: TYPHOON and GALACTEK
- ICL Group (2025, May 15). ICL Reports First Quarter 2025 Results
- Rovensa Next (2026, January 27). FAUVE Project: Rovensa Next and UTC collaborate on innovative drone spraying for water savings and agricultural efficiency
- Rovensa Next (2025, December 9). Rovensa Next launches Myndra, a new synergistic biostimulant to elevate fruit quality in woody perennials in Europe
- ADOB (2025, October 22). Współpraca ADOB i Hazera w akcji!
- Aries Agro Limited (2026, March 5). Inauguration of relocated manufacturing unit at Unnao, Uttar Pradesh
- BRANDT (2025, September 3). Talc USA Fully Integrates Under New Business Name, BRANDT Planting Solutions
- Rovensa Next (2025, May 12). Rovensa Next launches Biostimulation 360º
- BASF (2025, April 7). BASF launches Sokalan CP 301: a readily biodegradable dispersant with optimal performance for stable agricultural formulations
- Nouryon (2025, January 28). Nouryon achieves ISCC PLUS certification at green chelates manufacturing site in Herkenbosch, Netherlands
- Yara International (2026, June 30). Creating new value with PROCOTE, 10 years on
- ICL Group (2026, March 18). ICL Group Opens Specialty Fertilizer Manufacturing Facility in India
This bibliography is provided for reader reference and is not exhaustive. The full report contains the complete reference list and detailed citations.
This Report Answers
- How large is the organic mineral complexes market in 2026?
- What is moving micronutrient correction into planned crop programs?
- Why do EDTA / synthetic chelates lead their category?
- Why does iron lead the nutrient category?
- Why do cereals & grains lead crop type?
- Why does fertigation lead application method?
- How do the five profiled countries differ in growth?
- Which companies compete and how do their roles differ?
Frequently Asked Questions
How big is the organic mineral complexes market in 2026?
The organic mineral complexes market is valued at USD 369.5 million in 2026 and is projected to reach USD 984.9 million by 2036. Planned nutrient management and controlled application are moving diagnosed micronutrient correction into repeat crop programs.
What is the CAGR of the organic mineral complexes market from 2026 to 2036?
The organic mineral complexes market is projected to grow at 10.3% CAGR between 2026 and 2036. Crop diagnostics, soluble delivery systems, and formal nutrient planning are increasing the situations where a complexed micronutrient can justify repeat purchase.
Which chelating / complexing agent leads the organic mineral complexes market?
The EDTA / synthetic chelates segment is expected to hold 45.3% of the chelating / complexing agent category in 2026. Familiar manufacturing routes and broad metal coverage support its position, but field pH can require a different ligand.
How much value will the organic mineral complexes market add between 2026 and 2036?
The organic mineral complexes market is expected to add USD 615.4 million in value between 2026 and 2036. Revenue conversion depends on crop programs where diagnosis, application equipment, and expected response support the added formulation cost.
Which companies are active in the organic mineral complexes market?
Key companies operating in the organic mineral complexes market include ADOB, Aries Agro, Brandt, Rovensa Next (Tradecorp), BASF, Nouryon, Yara International, and ICL Group. Their positions differ through chelate chemistry, crop-nutrition formulation depth, agronomic support, and regional distribution.
Preview the report firsthand - request a free sample
Get SampleGet the brochure for pricing and purchase details.
Get PDFTable of Content
- Key Takeaways
- Market Size and CAGR
- Top Growth Driver
- Fastest Growing Segment
- Leading Region
- Key Companies
- Emerging Opportunities
- Executive Summary
- Global Market Outlook
- Demand-side Trends
- Supply-side Trends
- Technology Roadmap Analysis
- Analysis and Recommendations
- Analyst Perspective (What is happening? Why now? What should investors know?)
- Key Questions Answered
- How large is the market?
- What is the CAGR?
- What are key trends?
- Which region dominates?
- Who are the leaders?
- Market Overview
- Market Coverage / Taxonomy
- Market Definition / Scope / Limitations
- Research Methodology
- Chapter Orientation
- Analytical Lens and Working Hypotheses
- Market Structure, Signals, and Trend Drivers
- Benchmarking and Cross-market Comparability
- Market Sizing, Forecasting, and Opportunity Mapping
- Research Design and Evidence Framework
- Desk Research Programme (Secondary Evidence)
- Expert Input and Fieldwork (Primary Evidence)
- Tooling, Models, and Reference Databases
- Data Engineering and Model Build
- Quality Assurance and Audit Trail
- Market Background
- Market Dynamics (Drivers, Restraints, Opportunity, Trends)
- Scenario Forecast (Optimistic, Likely, Conservative)
- Impact Analysis
- AI Impact
- Sustainability Impact
- Regulatory Impact
- Technology Impact
- Consumer / Buyer Analysis
- Purchase Drivers
- Adoption Barriers
- Buyer Journey
- Opportunity Map Analysis
- Product Life Cycle Analysis
- Supply Chain Analysis
- Investment Feasibility Matrix
- Value Chain Analysis
- PESTLE and Porter's Analysis
- Regulatory Landscape
- Regional Parent Market Outlook
- Production and Consumption Statistics
- Import and Export Statistics
- Global Market Analysis and Forecast, 2021 to 2036
- Historical Market Size Value (USD Million) Analysis, 2021 to 2025
- Current and Future Market Size Value (USD Million) Projections, 2026 to 2036
- Y-o-Y Growth Trend Analysis
- Absolute $ Opportunity Analysis
- Global Market Pricing Analysis, 2021 to 2036
- Global Market Analysis and Forecast, By Chelating / Complexing Agent, 2021 to 2036
- Introduction / Key Findings
- Historical Market Size Value (USD Million) Analysis By Chelating / Complexing Agent, 2021 to 2025
- Current and Future Market Size Value (USD Million) Analysis and Forecast By Chelating / Complexing Agent, 2026 to 2036
- EDTA / Synthetic Chelates
- Amino Acid Complexes
- Organic Acid Complexes
- Lignosulfonates & Others
- EDTA / Synthetic Chelates
- Y-o-Y Growth Trend Analysis By Chelating / Complexing Agent, 2021 to 2025
- Absolute $ Opportunity Analysis By Chelating / Complexing Agent, 2026 to 2036
- Global Market Analysis and Forecast, By Nutrient, 2021 to 2036
- Introduction / Key Findings
- Historical Market Size Value (USD Million) Analysis By Nutrient, 2021 to 2025
- Current and Future Market Size Value (USD Million) Analysis and Forecast By Nutrient, 2026 to 2036
- Iron
- Zinc
- Manganese & Copper
- Boron / Moly & Multi-Nutrient
- Others
- Iron
- Y-o-Y Growth Trend Analysis By Nutrient, 2021 to 2025
- Absolute $ Opportunity Analysis By Nutrient, 2026 to 2036
- Global Market Analysis and Forecast, By Crop Type, 2021 to 2036
- Introduction / Key Findings
- Historical Market Size Value (USD Million) Analysis By Crop Type, 2021 to 2025
- Current and Future Market Size Value (USD Million) Analysis and Forecast By Crop Type, 2026 to 2036
- Cereals & Grains
- Fruits & Vegetables
- Oilseeds & Pulses
- Turf & Ornamentals
- Others
- Cereals & Grains
- Y-o-Y Growth Trend Analysis By Crop Type, 2021 to 2025
- Absolute $ Opportunity Analysis By Crop Type, 2026 to 2036
- Global Market Analysis and Forecast, By Application Method, 2021 to 2036
- Introduction / Key Findings
- Historical Market Size Value (USD Million) Analysis By Application Method, 2021 to 2025
- Current and Future Market Size Value (USD Million) Analysis and Forecast By Application Method, 2026 to 2036
- Fertigation
- Foliar
- Soil
- Others
- Fertigation
- Y-o-Y Growth Trend Analysis By Application Method, 2021 to 2025
- Absolute $ Opportunity Analysis By Application Method, 2026 to 2036
- Global Market Analysis and Forecast, By Sales Channel, 2021 to 2036
- Introduction / Key Findings
- Historical Market Size Value (USD Million) Analysis By Sales Channel, 2021 to 2025
- Current and Future Market Size Value (USD Million) Analysis and Forecast By Sales Channel, 2026 to 2036
- Agri-Input Distributors
- Cooperatives
- Agri-Retail Chains
- Online / Direct-to-Farm
- Others
- Agri-Input Distributors
- Y-o-Y Growth Trend Analysis By Sales Channel, 2021 to 2025
- Absolute $ Opportunity Analysis By Sales Channel, 2026 to 2036
- Global Market Analysis and Forecast, By Region, 2021 to 2036
- Introduction
- Historical Market Size Value (USD Million) Analysis By Region, 2021 to 2025
- Current Market Size Value (USD Million) Analysis and Forecast By Region, 2026 to 2036
- North America
- Latin America
- Western Europe
- Eastern Europe
- East Asia
- South Asia and Pacific
- Middle East & Africa
- Market Attractiveness Analysis By Region
- North America Market Analysis and Forecast, By Country, 2021 to 2036
- Historical Market Size Value (USD Million) Trend Analysis By Market Taxonomy, 2021 to 2025
- Market Size Value (USD Million) Forecast By Market Taxonomy, 2026 to 2036
- By Country
- USA
- Canada
- By Chelating / Complexing Agent
- By Nutrient
- By Crop Type
- By Application Method
- By Sales Channel
- By Country
- Market Attractiveness Analysis
- By Country
- By Chelating / Complexing Agent
- By Nutrient
- By Crop Type
- By Application Method
- By Sales Channel
- Key Takeaways
- Latin America Market Analysis and Forecast, By Country
- Historical Market Size Value (USD Million) Trend Analysis By Market Taxonomy, 2021 to 2025
- Market Size Value (USD Million) Forecast By Market Taxonomy, 2026 to 2036
- By Country
- Brazil
- Mexico
- Chile
- Rest of Latin America
- By Chelating / Complexing Agent
- By Nutrient
- By Crop Type
- By Application Method
- By Sales Channel
- By Country
- Market Attractiveness Analysis
- By Country
- By Chelating / Complexing Agent
- By Nutrient
- By Crop Type
- By Application Method
- By Sales Channel
- Key Takeaways
- Western Europe Market Analysis and Forecast, By Country
- Historical Market Size Value (USD Million) Trend Analysis By Market Taxonomy, 2021 to 2025
- Market Size Value (USD Million) Forecast By Market Taxonomy, 2026 to 2036
- By Country
- Germany
- UK
- Italy
- Spain
- France
- Nordic
- BENELUX
- Rest of Western Europe
- By Chelating / Complexing Agent
- By Nutrient
- By Crop Type
- By Application Method
- By Sales Channel
- By Country
- Market Attractiveness Analysis
- By Country
- By Chelating / Complexing Agent
- By Nutrient
- By Crop Type
- By Application Method
- By Sales Channel
- Key Takeaways
- Eastern Europe Market Analysis and Forecast, By Country
- Historical Market Size Value (USD Million) Trend Analysis By Market Taxonomy, 2021 to 2025
- Market Size Value (USD Million) Forecast By Market Taxonomy, 2026 to 2036
- By Country
- Russia
- Poland
- Hungary
- Balkan & Baltic
- Rest of Eastern Europe
- By Chelating / Complexing Agent
- By Nutrient
- By Crop Type
- By Application Method
- By Sales Channel
- By Country
- Market Attractiveness Analysis
- By Country
- By Chelating / Complexing Agent
- By Nutrient
- By Crop Type
- By Application Method
- By Sales Channel
- Key Takeaways
- East Asia Market Analysis and Forecast, By Country
- Historical Market Size Value (USD Million) Trend Analysis By Market Taxonomy, 2021 to 2025
- Market Size Value (USD Million) Forecast By Market Taxonomy, 2026 to 2036
- By Country
- China
- Japan
- South Korea
- By Chelating / Complexing Agent
- By Nutrient
- By Crop Type
- By Application Method
- By Sales Channel
- By Country
- Market Attractiveness Analysis
- By Country
- By Chelating / Complexing Agent
- By Nutrient
- By Crop Type
- By Application Method
- By Sales Channel
- Key Takeaways
- South Asia and Pacific Market Analysis and Forecast, By Country
- Historical Market Size Value (USD Million) Trend Analysis By Market Taxonomy, 2021 to 2025
- Market Size Value (USD Million) Forecast By Market Taxonomy, 2026 to 2036
- By Country
- India
- ASEAN
- Australia & New Zealand
- Rest of South Asia and Pacific
- By Chelating / Complexing Agent
- By Nutrient
- By Crop Type
- By Application Method
- By Sales Channel
- By Country
- Market Attractiveness Analysis
- By Country
- By Chelating / Complexing Agent
- By Nutrient
- By Crop Type
- By Application Method
- By Sales Channel
- Key Takeaways
- Middle East & Africa Market Analysis and Forecast, By Country
- Historical Market Size Value (USD Million) Trend Analysis By Market Taxonomy, 2021 to 2025
- Market Size Value (USD Million) Forecast By Market Taxonomy, 2026 to 2036
- By Country
- Kingdom of Saudi Arabia
- Other GCC Countries
- Türkiye
- South Africa
- Other African Union
- Rest of Middle East & Africa
- By Chelating / Complexing Agent
- By Nutrient
- By Crop Type
- By Application Method
- By Sales Channel
- By Country
- Market Attractiveness Analysis
- By Country
- By Chelating / Complexing Agent
- By Nutrient
- By Crop Type
- By Application Method
- By Sales Channel
- Key Takeaways
- Key Countries Market Analysis
- USA
- Pricing Analysis
- Market Share Analysis, 2025
- By Chelating / Complexing Agent
- By Nutrient
- By Crop Type
- By Application Method
- By Sales Channel
- Canada
- Pricing Analysis
- Market Share Analysis, 2025
- By Chelating / Complexing Agent
- By Nutrient
- By Crop Type
- By Application Method
- By Sales Channel
- Mexico
- Pricing Analysis
- Market Share Analysis, 2025
- By Chelating / Complexing Agent
- By Nutrient
- By Crop Type
- By Application Method
- By Sales Channel
- Brazil
- Pricing Analysis
- Market Share Analysis, 2025
- By Chelating / Complexing Agent
- By Nutrient
- By Crop Type
- By Application Method
- By Sales Channel
- Chile
- Pricing Analysis
- Market Share Analysis, 2025
- By Chelating / Complexing Agent
- By Nutrient
- By Crop Type
- By Application Method
- By Sales Channel
- Germany
- Pricing Analysis
- Market Share Analysis, 2025
- By Chelating / Complexing Agent
- By Nutrient
- By Crop Type
- By Application Method
- By Sales Channel
- UK
- Pricing Analysis
- Market Share Analysis, 2025
- By Chelating / Complexing Agent
- By Nutrient
- By Crop Type
- By Application Method
- By Sales Channel
- Italy
- Pricing Analysis
- Market Share Analysis, 2025
- By Chelating / Complexing Agent
- By Nutrient
- By Crop Type
- By Application Method
- By Sales Channel
- Spain
- Pricing Analysis
- Market Share Analysis, 2025
- By Chelating / Complexing Agent
- By Nutrient
- By Crop Type
- By Application Method
- By Sales Channel
- France
- Pricing Analysis
- Market Share Analysis, 2025
- By Chelating / Complexing Agent
- By Nutrient
- By Crop Type
- By Application Method
- By Sales Channel
- India
- Pricing Analysis
- Market Share Analysis, 2025
- By Chelating / Complexing Agent
- By Nutrient
- By Crop Type
- By Application Method
- By Sales Channel
- ASEAN
- Pricing Analysis
- Market Share Analysis, 2025
- By Chelating / Complexing Agent
- By Nutrient
- By Crop Type
- By Application Method
- By Sales Channel
- Australia & New Zealand
- Pricing Analysis
- Market Share Analysis, 2025
- By Chelating / Complexing Agent
- By Nutrient
- By Crop Type
- By Application Method
- By Sales Channel
- China
- Pricing Analysis
- Market Share Analysis, 2025
- By Chelating / Complexing Agent
- By Nutrient
- By Crop Type
- By Application Method
- By Sales Channel
- Japan
- Pricing Analysis
- Market Share Analysis, 2025
- By Chelating / Complexing Agent
- By Nutrient
- By Crop Type
- By Application Method
- By Sales Channel
- South Korea
- Pricing Analysis
- Market Share Analysis, 2025
- By Chelating / Complexing Agent
- By Nutrient
- By Crop Type
- By Application Method
- By Sales Channel
- Russia
- Pricing Analysis
- Market Share Analysis, 2025
- By Chelating / Complexing Agent
- By Nutrient
- By Crop Type
- By Application Method
- By Sales Channel
- Poland
- Pricing Analysis
- Market Share Analysis, 2025
- By Chelating / Complexing Agent
- By Nutrient
- By Crop Type
- By Application Method
- By Sales Channel
- Hungary
- Pricing Analysis
- Market Share Analysis, 2025
- By Chelating / Complexing Agent
- By Nutrient
- By Crop Type
- By Application Method
- By Sales Channel
- Kingdom of Saudi Arabia
- Pricing Analysis
- Market Share Analysis, 2025
- By Chelating / Complexing Agent
- By Nutrient
- By Crop Type
- By Application Method
- By Sales Channel
- Türkiye
- Pricing Analysis
- Market Share Analysis, 2025
- By Chelating / Complexing Agent
- By Nutrient
- By Crop Type
- By Application Method
- By Sales Channel
- South Africa
- Pricing Analysis
- Market Share Analysis, 2025
- By Chelating / Complexing Agent
- By Nutrient
- By Crop Type
- By Application Method
- By Sales Channel
- USA
- Market Structure Analysis
- Competition Dashboard
- Competition Benchmarking
- Market Share Analysis of Top Players
- By Regional
- By Chelating / Complexing Agent
- By Nutrient
- By Crop Type
- By Application Method
- By Sales Channel
- Emerging Startups
- Innovation Benchmarking
- Competition Analysis
- Competition Deep Dive
- ADOB
- Overview
- Product Portfolio
- Profitability by Market Segments
- Sales Footprint
- Strategy Overview
- Marketing Strategy
- Product Strategy
- Channel Strategy
- Aries Agro
- Brandt
- Rovensa Next (Tradecorp)
- BASF
- Nouryon
- Yara International
- ICL Group
- ADOB
- Case Studies
- Success Stories
- Recent Developments
- Competition Deep Dive
- Assumptions & Acronyms Used


