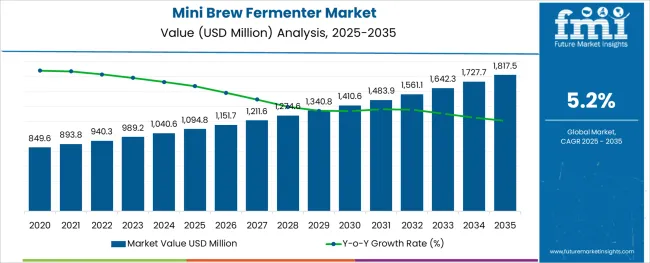
The Mini Brew Fermenter Market is estimated to be valued at USD 1094.8 million in 2025 and is projected to reach USD 1817.5 million by 2035, registering a compound annual growth rate (CAGR) of 5.2% over the forecast period.
The mini brew fermenter market is witnessing a steady rise as demand for craft brewing, home brewing, and small-batch production intensifies globally. This growth is being shaped by a combination of consumer preference for artisanal beverages, increasing awareness of quality control in brewing, and rising investments in compact, efficient brewing technologies.
Companies are focusing on providing scalable, durable, and hygienic fermenters that meet the evolving needs of microbreweries and advanced home brewers. The future outlook remains positive as emerging brewing communities, supportive legislation in favor of small-scale alcohol production, and technological improvements in material design continue to create opportunities for expansion.
Sustainability considerations, coupled with the appeal of premium quality craft beers, are paving the path for wider adoption and product differentiation across end-user segments.
The market is segmented by Material, Automation, and End-user and region. By Material, the market is divided into Stainless Steel, Plastic, and Others. In terms of Automation, the market is classified into Fully Automatic and Semi-automatic. Based on End-user, the market is segmented into Micro-Breweries, Breweries, Food & Beverage Industry, and Household. Regionally, the market is classified into North America, Latin America, Western Europe, Eastern Europe, Balkan & Baltic Countries, Russia & Belarus, Central Asia, East Asia, South Asia & Pacific, and the Middle East & Africa.
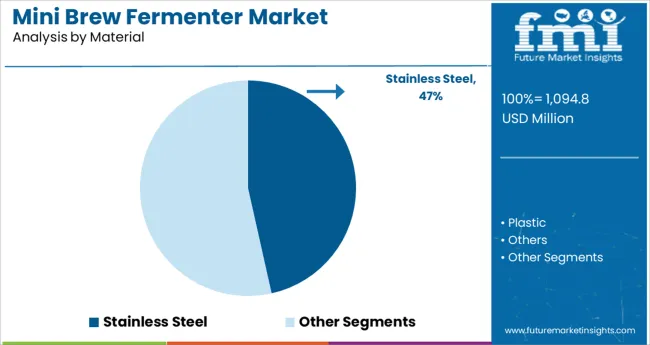
When segmented by material, stainless steel is anticipated to hold 46.5% of the mini brew fermenter market revenue in 2025, establishing itself as the leading material segment. Its dominance is attributed to its inherent properties of durability, corrosion resistance, and ease of sanitation, which are essential in maintaining the purity and quality of the brew.
Stainless steel has enabled manufacturers to design fermenters that withstand rigorous cleaning cycles and extended usage without compromising structural integrity. Its ability to retain temperature consistency and prevent contamination has further reinforced its position as the material of choice.
Moreover, the premium appearance and long lifecycle of stainless steel units have contributed to their strong preference among both commercial and advanced hobbyist brewers, solidifying the segment’s leadership.
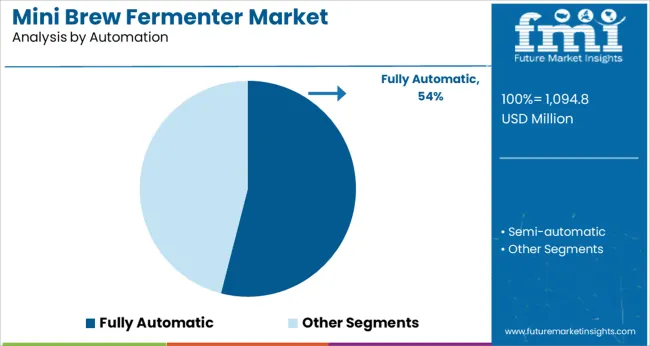
In terms of automation, the fully automatic segment is projected to command 54.0% of the market revenue in 2025, marking it as the most prominent automation type. This leadership is driven by the increasing demand for precision, consistency, and labor efficiency in small-scale brewing operations. Fully automatic fermenters have allowed brewers to achieve accurate control over fermentation variables such as temperature, pressure, and timing, significantly reducing the margin for human error.
The integration of sensors and programmable logic controllers has improved operational reliability and reduced the need for constant monitoring, making these units particularly attractive for busy microbreweries and high-end home brewers.
As expectations for repeatable quality and time-saving solutions continue to rise, the fully automatic segment has been firmly positioned at the forefront of the market.
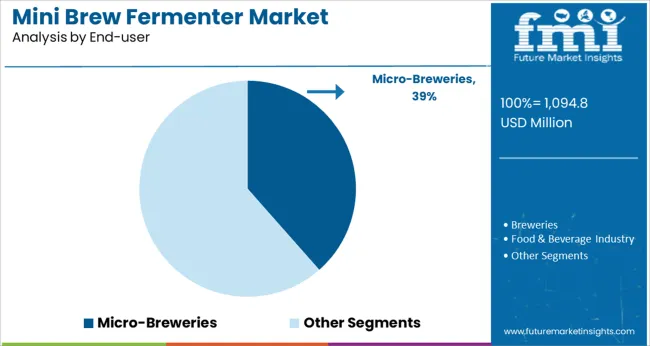
When segmented by end user, micro breweries are expected to capture 38.5% of the mini brew fermenter market revenue in 2025, maintaining their leadership as the top end-user category. This dominance has been underpinned by the rapid proliferation of microbreweries globally, fueled by consumer demand for distinctive, locally-produced craft beers.
Microbreweries have increasingly adopted mini brew fermenters due to their compact size, scalability, and ability to produce high-quality batches in limited spaces. These establishments value equipment that offers hygiene, efficiency, and durability, all of which mini fermenters provide.
Furthermore, the ability of microbreweries to experiment with small-batch recipes and introduce seasonal or specialty brews has been supported by the flexibility offered by mini fermenters. This alignment with the creative and operational needs of microbreweries has cemented their position as the largest end-user segment in the market.
The global market for mini brew fermenters increased from USD 849.6 million to USD 940.3 million between 2020 and 2025 with a CAGR of 4.9% during this period.
The market is driven by the growing demand for craft beer and the need for efficient fermentation. Moreover, the increasing popularity of home brewing is also expected to contribute to the growth of the market.
However, the historical outlook for the mini brew fermenter market has been mixed. While sales have grown steadily over the past few years, they have not been able to keep pace with the overall growth of the beer industry. As a result, mini brew fermenters currently account for a relatively small share of the total beer market.
During the forecast period, the global mini brew fermenter market is anticipated to grow from USD 1094.8 million in 2025 to USD 1817.5 million by 2035 with a healthy CAGR of 5.2%. The market is projected to grow over the forecast period, owing to the rising demand for premium, flavorful beers developed in small batches, which is creating enormous opportunities for sales of mini brew fermenters in local markets.
Moreover, the shifting of consumers from conventional beer to craft beer has accelerated the number of brewpubs and microbreweries worldwide, thus, in turn, driving the demand for mini brew fermenters.
| Attributes | Details |
|---|---|
| Mini Brew Fermenter Market CAGR (2025 to 2035) | 5.2% |
| Mini Brew Fermenter Market Size (2025) | USD 1094.8 million |
| Mini Brew Fermenter Market Size (2035) | USD 1817.5 million |
The mini brew fermenter market is predicted to be positively influenced by rising acquisition activities adopted by large multinational breweries and craft breweries. Several manufacturers are concentrating on the development of new flavors and tastes to provide quality-level alcoholic beverages, to cater to the evolving demand of consumers, especially the young customer base.
Their emphasis on value addition in their existing product portfolio is anticipated to give rise to new opportunities for market expansion. Therefore, the enduring partnerships with such huge beer processing and distilleries is a significant strategy adopted by these establishments for the supply of mini brew fermenters.
The mini brew fermenter market is likely to suffer from the severely stringent regulations pertaining to alcoholic beverages in some economies, which might restrict the market growth opportunities for mini brew fermenters. The substantial high cost of the initial setup of the mini brew fermenters, maintenance charges, and rising energy costs might hinder the progress of the mini brew fermenter market over the forecast period.
Additionally, the growing preference for healthier beverages, which contain fewer calories and are nutritious as opposed to alcoholic beverages, is resulting in the expansion of non-alcoholic beverages, which is a competitive market. In addition to this, the receding number of beer consumers who are seeking a healthy lifestyle and weight-loss options is also likely to restrict the market growth of mini brew fermenters.
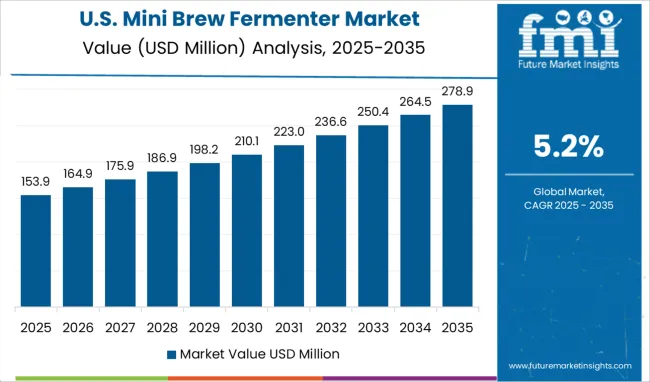
The USA will account for 37.6% of the global market with a value of USD 1094.8 million in 2025 as per prediction. The USA mini brew fermenter market has seen exponential growth in recent years. The number of breweries has more than doubled and shows no signs of slowing down. This growth has been fueled by the demand for high-quality, small-batch beer.
The mini brew fermenter is the perfect tool for micro-breweries looking to produce high-quality beer. These fermenters are small enough to fit in a home brewing setup but large enough to produce commercial-grade beer.
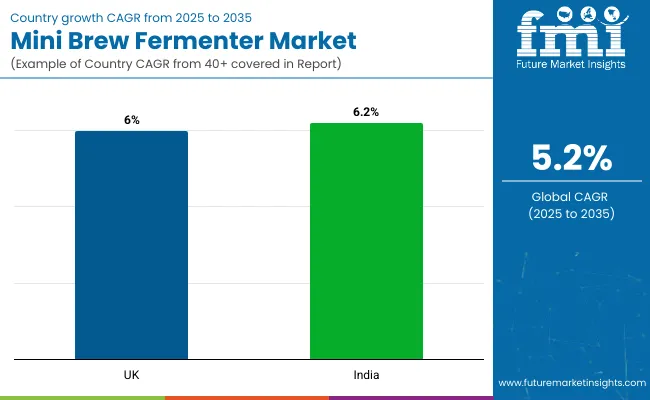
The United Kingdom mini brew fermenter market is predicted to grow at a CAGR of 6.0% between 2025 and 2035. The United Kingdom is home to many different types of mini brew fermenters. These devices have become increasingly popular in recent years due to their small size and ability to produce high-quality beer. While there are many different manufacturers of mini brew fermenters spread across the globe, the United Kingdom’s market share is significant.
There are a number of reasons for the popularity of mini brew fermenters in the United Kingdom. One reason is that these devices are relatively easy to use. They also do not require a large amount of space, which makes them ideal for small homes or apartments. Additionally, mini brew fermenters produce high-quality beer that can rival that of larger commercial breweries.
The India mini brew fermenter market is projected to grow at a CAGR of 6.2% between 2025 and 2035. In recent years, India has been increasingly involved in the global market for mini brew fermenters. This is due to a number of factors, including the country’s large population, growing economy, and increasing interest in craft beer among young adults in India. This is due to a number of factors, including the rise of social media and increased exposure to international culture. As a result, India is emerging as a significant market for mini brew fermenters.
The material that is in high demand for the production of mini brew fermenters is stainless steel. The main reason behind its high demand can be attributed to its beneficial attributes, such as anti-corrosion and durability. Another reason why stainless steel is popular among brewers is that it is easy to clean and doesn’t retain flavors from previous batches.
Micro-breweries are the primary users of mini brew fermenters. The small size of these fermenters allows for a more controlled and intimate brewing process, which is essential for micro-breweries that want to maintain the quality and integrity of their product. In addition, mini brew fermenters take up less space than traditional full-size fermenters, thus enabling more efficient use of space for small breweries.
Following are some of the advantages of owning a fully automatic mini brew fermenter:
The emerging start-ups in the mini brew fermenter market are inventing superior-quality fermenters to be used in breweries, micro-breweries, the food and beverage industry, households, etc. The evolving consumer demands have given rise to the growth of craft beers, which are concocted with varied brewing techniques and combinations of different beers and wines, the focus being the taste and flavor of the resultant beverage. To up-level their position, some of the new entrants in the market are introducing their own recipes to develop innovative, fool-proof beer solutions.
The growing demand for affordable, sustainable, and flavorful fresh beer made with natural and authentic ingredients is fueling the development of mini brew fermenters with advanced features. The new mini brew fermenter manufacturers in the market are also offering rebates and discounts to lure more customers, and substantiate their market presence. In addition to this, the development of new products by companies to extend their brewing portfolio, in order to help beer enthusiasts realize their brewing potential, is laying the ground for the growth of new entrants into the market.
MiniBrew
The Netherlands-based start-up, which is a brainchild of Bart van de Kooij and Olivier van Oord, commenced operations in the year 2020. The concept of MiniBrew is inspired by the growing demand for simple and accessible quality home brewing options. MiniBrew offers a smart, all-in-one beer machine that brews high-quality beer at your own residence. Recently, the company launched CRAFT GEN 3.0, with a better price range, product quality, and availability in more countries than before. The firm offers exclusive, site-wide discounts on the purchase of the first CRAFT GEN 3 MiniBrew.
Recent developments by MiniBrew include:
Goxoa
The Montpellier-based but Barcelona-operated start-up, Goxoa was created recently in October 2025, with an aim to provide alcohol-free beer to athletes. The start-up claims to provide the perfect sports beer, containing nutrient-rich and flavorful content, for athletes, to be consumed post-workout. The product is currently under Research and Development (R&D) and is expected to be launched in early 2025.
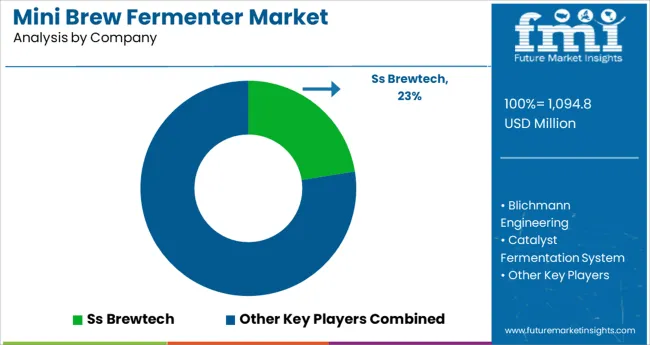
The market is highly competitive with the presence of a large number of players. The key players in the market include Ss Brewtech, The Greater Good Fresh Brewing Co., Blichmann Engineering, Catalyst Fermentation System, MoreBeer!, and Spike Brewing. These players are focusing on strategies such as mergers & acquisitions, product launches, and expansions to gain a competitive edge in the market. The new launches premiering new, more economical line of mini brew fermenters to enable would-be brewers explore the art of home-brewing is anticipated to propel market growth.
| Attribute | Details |
|---|---|
| Forecast Period | 2025 to 2035 |
| Historical Data Available for | 2020 to 2024 |
| Market Analysis | million for Value and Units for Volume |
| Key Regions Covered | North America; Latin America; Europe; Asia Pacific; Oceania; Middle East and Africa (MEA) |
| Key Countries Covered | USA, Mexico, Canada, United Kingdom, Germany, France, Italy, China, Spain, India, Japan, South Korea, Australia, Argentina, Brazil, South Africa, UAE |
| Key Segments Covered | Material, Automation, End-user, Region |
| Key Companies Profiled | Ss Brewtech; The Greater Good Fresh Brewing Co.; Blichmann Engineering; Catalyst Fermentation System; Midwest Supplies; Northern Brewer; MoreBeer!; Spike Brewing; Krome Brewing; Grainfather; Anvil Brewing |
| Report Coverage | Company Share Analysis, DROT Analysis, Market Dynamics and Challenges, Strategic Growth Initiatives, Market Forecast, Competitive Landscape, |
| Customization & Pricing | Available upon Request |
The global mini brew fermenter market is estimated to be valued at USD 1,094.8 million in 2025.
It is projected to reach USD 1,817.5 million by 2035.
The market is expected to grow at a 5.2% CAGR between 2025 and 2035.
The key product types are stainless steel, plastic and others.
fully automatic segment is expected to dominate with a 54.0% industry share in 2025.


Our Research Products

The "Full Research Suite" delivers actionable market intel, deep dives on markets or technologies, so clients act faster, cut risk, and unlock growth.

The Leaderboard benchmarks and ranks top vendors, classifying them as Established Leaders, Leading Challengers, or Disruptors & Challengers.

Locates where complements amplify value and substitutes erode it, forecasting net impact by horizon

We deliver granular, decision-grade intel: market sizing, 5-year forecasts, pricing, adoption, usage, revenue, and operational KPIs—plus competitor tracking, regulation, and value chains—across 60 countries broadly.

Spot the shifts before they hit your P&L. We track inflection points, adoption curves, pricing moves, and ecosystem plays to show where demand is heading, why it is changing, and what to do next across high-growth markets and disruptive tech

Real-time reads of user behavior. We track shifting priorities, perceptions of today’s and next-gen services, and provider experience, then pace how fast tech moves from trial to adoption, blending buyer, consumer, and channel inputs with social signals (#WhySwitch, #UX).

Partner with our analyst team to build a custom report designed around your business priorities. From analysing market trends to assessing competitors or crafting bespoke datasets, we tailor insights to your needs.
Supplier Intelligence
Discovery & Profiling
Capacity & Footprint
Performance & Risk
Compliance & Governance
Commercial Readiness
Who Supplies Whom
Scorecards & Shortlists
Playbooks & Docs
Category Intelligence
Definition & Scope
Demand & Use Cases
Cost Drivers
Market Structure
Supply Chain Map
Trade & Policy
Operating Norms
Deliverables
Buyer Intelligence
Account Basics
Spend & Scope
Procurement Model
Vendor Requirements
Terms & Policies
Entry Strategy
Pain Points & Triggers
Outputs
Pricing Analysis
Benchmarks
Trends
Should-Cost
Indexation
Landed Cost
Commercial Terms
Deliverables
Brand Analysis
Positioning & Value Prop
Share & Presence
Customer Evidence
Go-to-Market
Digital & Reputation
Compliance & Trust
KPIs & Gaps
Outputs
Full Research Suite comprises of:
Market outlook & trends analysis
Interviews & case studies
Strategic recommendations
Vendor profiles & capabilities analysis
5-year forecasts
8 regions and 60+ country-level data splits
Market segment data splits
12 months of continuous data updates
DELIVERED AS:
PDF EXCEL ONLINE
Miniplate for Bone Fixation Market Size and Share Forecast Outlook 2025 to 2035
Miniature Electrochemical CO Sensor Market Size and Share Forecast Outlook 2025 to 2035
Mini LED Solder Pastes and Fluxes Market Size and Share Forecast Outlook 2025 to 2035
Miniature Duplex Connectors Market Size and Share Forecast Outlook 2025 to 2035
Mining Lubricant Market Size and Share Forecast Outlook 2025 to 2035
Mining Remanufacturing Component Market Forecast Outlook 2025 to 2035
Mining Hose Market Size and Share Forecast Outlook 2025 to 2035
Mining Equipment Industry Analysis in Latin America Size and Share Forecast Outlook 2025 to 2035
Mining Tester Market Size and Share Forecast Outlook 2025 to 2035
Brewer's Yeast Market Size and Share Forecast Outlook 2025 to 2035
Mini Cranes Market Size and Share Forecast Outlook 2025 to 2035
Mining Pneumatic Saw Market Size and Share Forecast Outlook 2025 to 2035
Mini Grid Market Size and Share Forecast Outlook 2025 to 2035
Mini POS Terminals Market Size and Share Forecast Outlook 2025 to 2035
Mini Track Machinery Market Size and Share Forecast Outlook 2025 to 2035
Minimally Invasive Spine Technologies Market Size and Share Forecast Outlook 2025 to 2035
Mining Drilling Service Market Size and Share Forecast Outlook 2025 to 2035
Mini Hair Straightener Market Size and Share Forecast Outlook 2025 to 2035
Minimally Invasive Laser Therapy Devices Market Size and Share Forecast Outlook 2025 to 2035
Mining Trucks Market Size and Share Forecast Outlook 2025 to 2035

Thank you!
You will receive an email from our Business Development Manager. Please be sure to check your SPAM/JUNK folder too.
Chat With
MaRIA