Miniprotein Supplement Market Size and Share Forecast Outlook 2025 to 2035

The miniprotein supplement market is on track for strong growth rising from USD 435.6 million in 2025 to USD 783.8 million by 2035. This marks a 6.0% CAGR and an absolute increase of USD 348.2 million, signaling long-term expansion potential across performance nutrition and wellness segments.
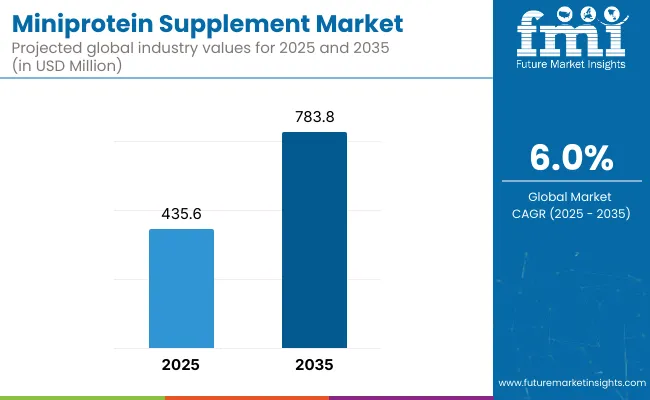
Quick Stats for Miniprotein Supplement Market

  • Miniprotein Supplement Market Value (2025): USD 435.6 million
  • Miniprotein Supplement Market Forecast Value (2035): USD 783.8 million
  • Miniprotein Supplement Market Forecast CAGR: 6.0%
  • Leading Segment in 2025: Powder Format (40% share)
  • Key Growth Regions: North America, Asia-Pacific, Western Europe
  • Top Key Players: Nestlé Health Science, Abbott Nutrition, Glanbia Performance Nutrition, FrieslandCampina Ingredients, Arla Foods Ingredients, Fonterra, Hilmar Ingredients, Amway (Nutrilite), Herbalife Nutrition, NOW Foods

Miniprotein Supplement Market

Miniprotein Supplement Market Key Takeaways

Metric Value
Market Estimated Value in (2025E) USD 435.6 million
Market Forecast Value in (2035F) USD 783.8 million
Forecast CAGR (2025 to 2035) 6.0%

The overall momentum is expected to be driven by the convergence of precision nutrition, personalized health trends, and the increasing integration of low-molecular-weight proteins into clinical and performance nutrition regimes.

Between 2025 and 2030, the market is forecast to expand from USD 435.6 million to USD 589.3 million, contributing USD 153.7 million, or approximately 44% of the total decade growth. This initial growth phase is likely to be underpinned by increasing consumer demand for muscle recovery and metabolic health supplements, particularly among athletes and active lifestyle consumers. Powder-based formats are expected to dominate this period due to their formulation flexibility and cost-efficiency, while sports nutrition remains the primary application area, benefiting from brand-backed clinical claims and advanced amino acid profiling.

In the second half, from 2030 to 2035, the market is anticipated to add another USD 194.5 million, accounting for 56% of total growth, as the segment shifts further toward medical and healthy aging nutrition applications. Increased institutional usage across specialty clinics, hospitals, and pediatric nutrition programs is expected to enhance demand. Meanwhile, plant-based blended miniproteins and RTD (ready-to-drink) innovations are likely to gain traction, supported by scientific backing in areas such as joint, cognitive, and skin health.

From 2020 to 2024, the global Miniprotein Supplement Market expanded steadily as consumer awareness shifted toward targeted protein delivery, digestive efficiency, and personalized nutritional support. During this early phase, market leadership remained concentrated among clinical nutrition giants, with Nestlé and Abbott collectively holding over 25-30% of market share through strong hospital distribution, patented peptide formulations, and early entry into aging and post-operative care channels.

Competitive differentiation primarily focused on whey and collagen-based innovation, with most revenue driven by bulk powders and limited penetration of newer delivery formats. Clinical integration and retail personalization were minimal during this period.

By 2025, market demand is projected to rise significantly, led by expanding applications in healthy aging, sports recovery, and medical nutrition. The revenue mix is shifting, as plant-based, blended, and bioengineered miniproteins begin to outpace traditional proteins in innovation pipelines. Major players are evolving toward subscription-based wellness models, flavor-neutral RTDs, and condition-specific formulations for cognitive, joint, and metabolic health.

The competitive edge is now transitioning from ingredient volume to precision, digestibility, and clinical validation, as firms that integrate scientific substantiation, regulatory readiness, and multi-format accessibility are expected to command future growth.

Why the Miniprotein Supplement Market is growing?

The growth of the miniprotein supplement market is being driven by a convergence of health personalization, functional wellness, and scientific advancements in protein engineering. Rising consumer awareness of sarcopenia prevention, muscle maintenance, and healthy aging has accelerated the adoption of bioavailable, low-molecular-weight proteins. Miniproteins have been increasingly positioned as efficient alternatives for individuals seeking faster absorption, improved digestibility, and targeted physiological benefits.

Clinical validation of miniprotein efficacy in post-operative recovery, pediatric nutrition, and cognitive support has further strengthened their role in medical and specialized nutrition. The market has been boosted by innovations in formulation technologies, enabling incorporation into RTD beverages, powders, and gummies without compromising stability or taste.

Additionally, plant-based miniproteins have been supported by sustainability narratives, meeting the preferences of ethical and environmentally conscious consumers. Integration of omics-based precision nutrition and expanding distribution through online D2C and pharmacy channels are expected to further sustain demand across diverse demographic segments.

Segmental Analysis

The miniprotein supplement market has been segmented across protein type, application, and product format, offering a structured view into its multi-dimensional evolution. Each segment reflects a unique demand trajectory shaped by consumer lifestyle, clinical outcomes, and innovation in protein science.

By protein type, animal- and plant-based miniproteins have been analyzed for their functional specificity and absorption dynamics. Applications range from performance-oriented sports nutrition to clinical-grade recovery support and aging health. Product format segmentation reveals shifts in convenience, bioavailability, and formulation stability.

This structured segmentation allows for precise strategic planning, as brands target niche demographics with tailored delivery systems. Segment-level analysis highlights the critical roles of whey miniprotein, sports nutrition, and powder formats in shaping near-term growth and long-term market leadership.
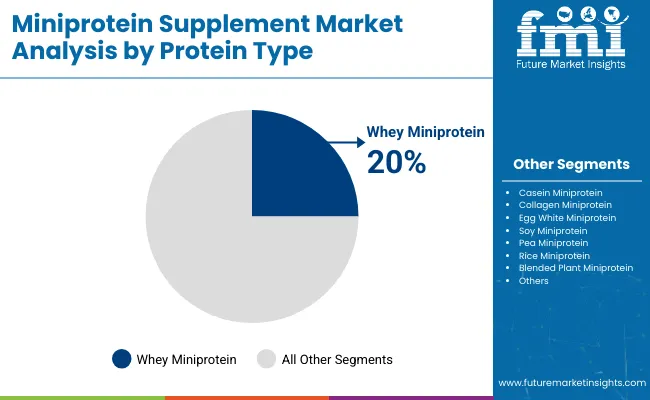
Insights into the Protein Type Segment with Whey Miniprotein Leading the Category

Miniprotein Supplement Market By Protien

Protein Type Market Value Share, 2025
Whey Miniprotein 20%
Casein Miniprotein 8%
Collagen Miniprotein 15%
Egg White Miniprotein 7%
Soy Miniprotein 10%
Pea Miniprotein 8%
Rice Miniprotein 5%
Blended Plant Miniprotein 12%
Other Specialty Miniproteins 15%

Whey miniprotein is expected to account for 20% of the market share in 2025, maintaining its position as the most preferred protein type in this category. Recognized for its rapid digestibility, complete amino acid profile, and clinical validation, whey continues to be utilized extensively in muscle recovery and sports performance applications.

Its efficacy in lean muscle synthesis and immune modulation has been widely supported by peer-reviewed nutritional science. Growth is further underpinned by innovations in whey hydrolysates and nano-peptide formulations, enhancing absorption while reducing allergenic potential.

As personalization of protein intake becomes mainstream, whey-based miniproteins are projected to remain a cornerstone of both performance and clinical nutrition formulations.
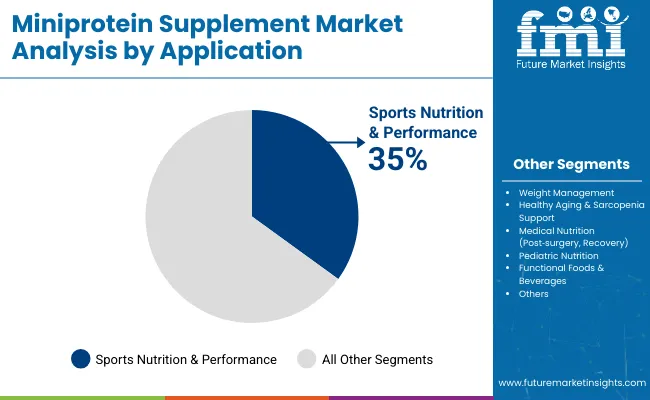
Insights into the Application Segment with Sports Nutrition Dominating the Demand

Miniprotein Supplement Market By Application

Application Market Value Share, 2025
Sports Nutrition & Performance 35%
Weight Management 18%
Healthy Aging & Sarcopenia Support 15%
Medical Nutrition (Post surgery, Recovery) 10%
Pediatric Nutrition 7%
Functional Foods & Beverages 15%

The sports nutrition & performance segment is projected to lead with a 35% share in 2025, fueled by a sustained surge in active lifestyle adoption and performance-focused dietary interventions. Miniproteins are being favored by athletes and fitness consumers due to their faster bioavailability and efficient amino acid delivery.

The segment is also benefiting from partnerships between sports brands and ingredient manufacturers offering science-backed miniprotein blends. Innovations in clean-label, non-GMO, and hormone-free formulations are expected to reinforce demand. Moreover, clinical studies demonstrating enhanced muscle recovery and reduced fatigue markers have validated the inclusion of miniproteins in pre- and post-workout regimes, solidifying the segment’s dominance.
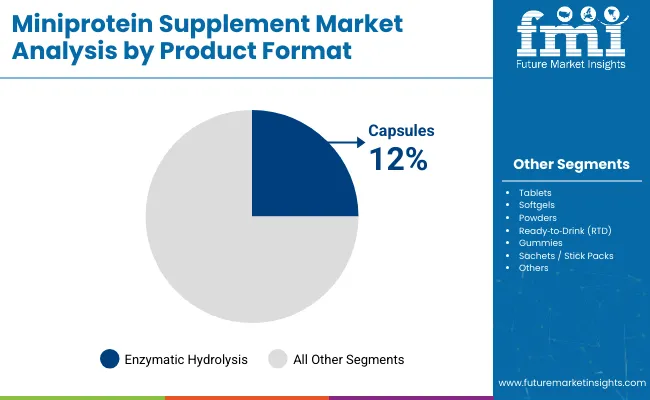
Insights into the Product Format Segment with Powders Maintaining Market Leadership

Miniprotein Supplement Market By Product

Product Format 2025 Share %
Capsules 12%
Tablets 8%
Softgels 5%
Powders 40%
Ready to Drink (RTD) 20%
Gummies 7%
Sachets / Stick Packs 8%

Powder-based miniprotein supplements are expected to contribute 40% of market revenue in 2025, reflecting their versatility in formulation, customization, and cost efficiency. Their widespread usage in performance nutrition, meal replacements, and clinical formulations has been enabled by compatibility with a wide range of dietary ingredients.

Powders allow precise dosage control, extended shelf stability, and easy mixing into beverages and food. Manufacturers have prioritized flavor masking, solubility, and fast-dissolving features to enhance user experience. As consumer preference shifts toward flexible dosing and portable nutrition, the powder format is expected to retain its leadership, while RTD innovations continue to grow as a convenience-driven alternative.

What are the Drivers, Restraints, and Key Trends of the Miniprotein Supplement Market?

Despite the expanding use of targeted nutrition in clinical and wellness sectors, the miniprotein supplement market faces nuanced barriers in raw material standardization and delivery optimization. Still, innovation in formulation science and functional precision continues to redefine growth opportunities across segments.

Integration of Precision Amino Acid Profiling in Clinical Protocols

The adoption of precision amino acid profiling in clinical nutrition protocols has significantly supported the demand for miniprotein supplements. Unlike conventional proteins, miniproteins offer optimized bioavailability tailored to individual metabolic requirements, especially in post-operative care, oncology recovery, and pediatric development. Hospitals and specialty clinics have begun integrating structured peptide intake plans into treatment pathways, driven by personalized medicine initiatives.

The shift toward molecularly defined protein regimens is being supported by metabolomics and AI-led diagnostics, enabling miniprotein formulations to match exact nutrient deficits. This integration has been critical in improving patient outcomes, enhancing recovery speed, and reducing adverse reactions associated with larger protein molecules. Over the forecast period, this clinical alignment is expected to serve as a core strategic advantage for manufacturers operating in high-value therapeutic segments.

Development of Thermostable, Flavor-Neutral Miniprotein Powders

A key formulation trend has been the development of thermostable and flavor-neutral miniprotein powders that retain integrity in varied temperature and pH environments. This advancement has enabled wider use in RTD beverages, heat-processed functional foods, and tropical climate markets.

Proteins derived from enzymatically refined sources (e.g., sunflower seed or rice peptides) are being processed with next-generation microencapsulation techniques, minimizing taste fatigue and improving consumer compliance. These innovations are positioning miniproteins as viable for mainstream and clinical hybrid formats such as therapeutic smoothies or geriatric soup mixes where palatability and shelf-life are equally critical.
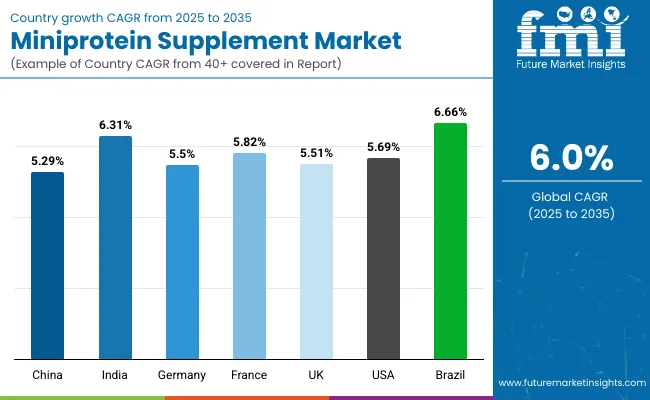
Analysis of Miniprotein Supplement Market By Key Countries

Miniprotein Supplement Market By Country

Countries CAGR
China 5.29%
India 6.31%
Germany 5.50%
France 5.82%
UK 5.51%
USA 5.69%
Brazil 6.66%

The global miniprotein supplement market demonstrates differentiated momentum across key economies, shaped by clinical adoption rates, demographic health priorities, and functional nutrition policies. A shift toward precision nutrition protocols, protein customization, and elder care supplementation is influencing regional demand curves.

The Asia-Pacific region, particularly India (6.31% CAGR) and China (5.29% CAGR), is expected to witness accelerated uptake, supported by population-scale wellness initiatives, expanding sports infrastructure, and public-private collaborations in malnutrition intervention. India’s surge is being fueled by inclusion of peptide-based supplements in school nutrition programs and rising market penetration through D2C platforms targeting young urban consumers.

China’s market, while more mature, is gaining traction through integration of miniproteins in TCM-adjacent formulations and innovation hubs focusing on digestive-friendly sports products tailored to lactose-intolerant consumers.

In Europe, France (5.82%), UK (5.51%), and Germany (5.50%) are maintaining robust growth, anchored by healthy aging initiatives, clinical dietary guidelines, and sustainability standards in protein sourcing. France’s demand is being driven by medical nutrition adoption in geriatrics, while the UK has shown strong preference for plant-based blended miniproteins amid ethical consumption narratives.

The USA market (5.69%) is expected to remain innovation-led, with traction in pediatric and oncology nutrition, alongside retail expansion of flavorless RTD and functional snacking formats. In Latin America, Brazil (6.66%) stands out, propelled by government-driven health interventions and rapid mainstreaming of protein-enriched staple foods targeting middle-income households.

Sales Outlook for Miniprotein Supplement in the United States

Years 2025 2026 2027 2028 2029 2030 2031 2032 2033 2034 2035
USA 104.5 110.9 116.8 124.5 131.6 139.7 147.4 156.0 164.1 173.3 183.1

The USA miniprotein supplement market is forecasted to expand from USD 104.54 million in 2025 to USD 183.10 million by 2035, achieving a CAGR of 5.8% over the decade. This consistent growth is being underpinned by the incorporation of targeted peptide-based formulations in chronic care, sports recovery, and lifestyle-driven nutrition.

Hospitals and specialized clinics have increasingly adopted miniprotein protocols in post-surgical and immunonutrition therapy, especially in elderly and oncology patients. Meanwhile, product innovation in flavor-neutral, high-solubility powders and sachets has enabled broader use across pediatric and outpatient dietary regimens.

Digital health platforms in the USA have begun pairing microbiome testing and amino acid panels with customized miniprotein dosing kits, expanding the market toward preventive wellness.

  • Therapeutic miniproteins have been integrated into Enhanced Recovery After Surgery (ERAS) protocols across USA hospital networks.
  • Pediatric nutrition programs are increasingly prescribing low-allergen, high-absorption miniprotein formats to address protein-energy malnutrition.
  • Sports and lifestyle brands have bundled plant-animal hybrid miniproteins with gut-friendly delivery systems to support holistic recovery.

Growth and Expansion Outlook for Miniprotein Supplement Market in the United Kingdom

The Miniprotein Supplement Market in the United Kingdom is expected to grow at a CAGR of 5.53% from 2025 through 2035, driven by the country’s aging population, NHS-supported dietary research, and strong consumer demand for clinical-grade functional nutrition. A shift from traditional protein powders to condition-specific miniproteins has been observed across senior wellness programs and outpatient care.

Consumer preferences have increasingly favored plant-based blended miniproteins aligned with ethical and sustainability values. Pharmacy chains and specialist health retailers have expanded their offerings of gastro-friendly and lactose-free peptide formats, particularly among elderly and IBS-sensitive users.

Digital platforms in the UK have supported adoption through nutrigenomic pairing and personalized supplement tracking tools.

  • The NHS has funded clinical research trials assessing the use of miniproteins in elderly malnutrition and sarcopenia.
  • RTD and sachet formats are being preferred for their portability in elderly care and home-based recovery.
  • Plant-based miniproteins are promoted through carbon-labeled packaging and ethical sourcing claims.
  • Digital wellness platforms are offering custom peptide regimens based on wearable-generated biometrics.

Growth and Expansion Outlook for Miniprotein Supplement Market in India

The Miniprotein Supplement Market in the India is expected to grow at a CAGR of 6.31%, through 2035, supported by government-led health interventions, growing sports nutrition infrastructure, and rising demand for affordable, high-absorption protein formats. Miniproteins have been increasingly positioned as a solution to India’s double burden of undernutrition and lifestyle disorders.

Adoption has been accelerated through integration into state-run school meal and maternal health programs, where lightweight, sachet-based miniproteins are being deployed to address regional protein gaps. The private healthcare sector has promoted clinical-grade peptides in oncology recovery and dialysis nutrition.

Urban D2C brands have introduced ayurvedic-infused miniproteins and digestive enzyme-enhanced formulations targeting fitness, aging, and women's health segments.

  • Miniproteins are included in public nutrition schemes across pediatric and prenatal care in Tier II and III cities.
  • Low-lactose, heat-stable peptide formats are favored in warm-climate retail markets.
  • Sports and wellness chains have launched sachet-based miniprotein boosters in gyms and clinics.
  • Ayurveda-integrated blends are driving adoption in the functional lifestyle segment among millennials and Gen Z.

Sales Outlook for Miniprotein Supplement in China

The miniprotein supplement market in China is expected to grow 5.29% through 2035, driven by growing clinical acceptance, public health integration, and strong demand for digestively mild protein solutions in both preventive and therapeutic care. Regulatory support for functional food labeling and expanded health insurance coverage for enteral nutrition have positioned miniproteins as a viable solution in hospital and home settings.

Aging population trends and digestive intolerance to conventional proteins have catalyzed the shift toward hydrolyzed peptides and microproteins, especially for oncology, elderly care, and post-viral recovery diets. In addition, TCM-integrated formulations featuring herbal-miniprotein blends are gaining adoption, particularly in retail pharmacies and wellness centers.

  • Government-supported nutrition intervention programs have included miniproteins in public hospital procurement.
  • Elderly and convalescent care facilities have adopted easy-to-digest collagen and soy miniproteins.
  • TCM-inspired peptide blends are being commercialized across wellness platforms.
  • Strict functional food labeling laws are promoting scientifically backed protein claims in the clinical and retail space.

In-depth Analysis of Miniprotein Supplement in Germany

Countries 2025 2035
UK 20.50% 19.32%
Germany 21.31% 20.89%
Italy 9.61% 9.81%
France 12.63% 13.72%
Spain 10.42% 11.77%
BENELUX 6.32% 5.89%
Nordic 5.83% 5.94%
Rest of Europe 13% 13%

Germany’s miniprotein supplement market is projected to grow at 5.50% over the next decade, underpinned by stringent clinical nutrition protocols, insurance-backed outpatient dietary programs, and the country's advanced regulatory support for medical-grade supplements. Formulations with documented therapeutic outcomes are prioritized in both hospital and pharmacy networks.

Institutional buyers have focused on collagen and whey-based miniproteins for orthopedic recovery, sarcopenia prevention, and post-cardiac rehabilitation. Market preference remains centered on clean-label and allergen-free formulations, often verified through third-party clinical testing and eco-certifications.The aging demographic has driven expansion in nutritionally fortified RTDs, especially in the homecare segment, where ease of administration and digestibility are critical.

  • German health insurers have reimbursed prescription-grade miniproteins for elderly and chronically ill patients.
  • RTD beverages with joint-health peptides have gained traction in orthopedic rehabilitation.
  • Pharmacies and e-pharmacies have prioritized certified low-allergen formulations for medical-grade use.
  • Germany leads in clean-label and clinical transparency certifications, influencing buyer behavior.

Growth Outlook for Miniprotein Supplement Market in Japan

Protein Type Market Value Share, 2025
Whey Miniprotein 22%
Casein Miniprotein 7%
Collagen Miniprotein 18%
Egg White Miniprotein 6%
Soy Miniprotein 10%
Pea Miniprotein 7%
Rice Miniprotein 5%
Blended Plant Miniprotein 12%
Other Specialty Miniproteins 13%

The miniprotein supplement market in Japan is projected to reach USD 32.67 million in 2025, with whey (22%) and collagen (18%) miniproteins leading the market by value. This dominance reflects Japan’s continued emphasis on clinically validated, high-bioavailability proteins for specialized applications in healthy aging, skin health, and muscle preservation. The country’s structured approach to functional food regulation has favored ingredient-backed supplements, especially among elderly and health-conscious adult populations.

A distinct consumer inclination toward collagen-based solutions driven by dermal, joint, and mobility health concerns has amplified demand for bioactive miniproteins in RTD and powder form. Concurrently, whey proteins are being widely used in hospital recovery diets, gym-based performance products, and sarcopenia-prevention programs for seniors.

  • Japan’s miniprotein market is expected to hold a significant share of APAC demand in 2025.
  • Collagen and whey proteins together account for 40% of market share due to strong clinical and cosmetic applications.
  • Growth is supported by elder care policies, beauty-from-within trends, and institutional use in long-term care facilities.
  • Advanced hydrolysate and nano-formulation technologies are being adopted by Japanese nutraceutical firms to improve efficacy and compliance.

Opportunity Analysis of South Korea Miniprotein Supplement Market

Application Market Value Share, 2025
Sports Nutrition & Performance 36%
Weight Management 17%
Healthy Aging & Sarcopenia Support 14%
Medical Nutrition (Post surgery, Recovery) 9%
Pediatric Nutrition 6%
Functional Foods & Beverages 18%

The miniprotein supplement market in South Korea is expected to achieve robust growth by 2025, reaching USD 20.9 million, with sports nutrition (36%) and functional foods & beverages (18%) emerging as the dominant application areas. South Korea's growth trajectory is being shaped by convergence between performance nutrition, beauty innovation, and a tech-enabled food retail ecosystem. Brands have prioritized science-backed personalization and clean-label positioning, aligning with consumer preferences for precise, convenient, and aesthetically beneficial supplements.

The dominance of sports nutrition stems from a cultural shift toward active living and gym culture among millennials and Gen Z consumers. Simultaneously, the popularity of functional miniprotein-infused beverages, particularly in the RTD and convenience categories, reflects a growing demand for on-the-go supplementation without compromise on taste or digestibility.
  • South Korea's market is forecasted to hold a notable share within the East Asian miniprotein landscape by 2025.
  • Sports nutrition leads the application spectrum at 36%, driven by fitness-focused urban consumers.
  • Functional beverages with collagen and plant-based miniproteins are gaining ground in both beauty and wellness retail chains.
  • Innovations in convenience-based protein delivery formats, such as protein teas and jelly packs, are shaping market direction.

Competitive Landscape of Miniprotein Supplement Market

Miniprotein Supplement Market By Company

Global Leaders Global Value Share 2025
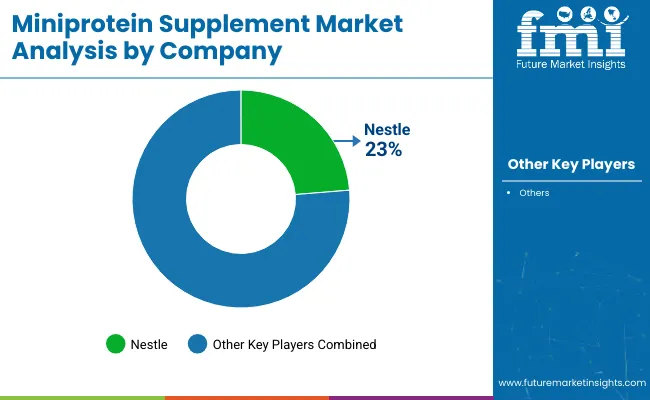
Nestle 23 %
Others 77 %

The miniprotein supplement market remains moderately fragmented, characterized by a mix of global nutrition giants, functional ingredient innovators, and specialty wellness brands competing across clinical, performance, and lifestyle-driven use cases. Market competition is increasingly shaped by clinical efficacy, protein source diversification, and delivery format innovation, rather than pure volume or brand recognition.

Global leaders such as Nestlé Health Science, Abbott Nutrition, and Glanbia Performance Nutrition are projected to collectively account for approximately 35-40% of global market share in 2025. Their leadership has been underpinned by investments in therapeutic nutrition, plant-based miniprotein R&D, and personalized wellness platforms. These companies are expanding clinical applications through hospital partnerships, subscription-based DTC models, and integration of diagnostic tools to guide protein intake.

Mid-sized ingredient players, including FrieslandCampina Ingredients, Arla Foods Ingredients, and Hilmar Ingredients, have specialized in functional peptide development, catering to B2B clients in the medical nutrition, healthy aging, and infant care sectors. Their strength lies in bioactive protein customization, traceable sourcing, and EFSA/GRAS-aligned regulatory compliance.

Niche-focused wellness brands such as Amway (Nutrilite), Herbalife Nutrition, and NOW Foods are innovating through gummies, RTD drinks, and flavor-neutral sachets, appealing to younger, active consumers via D2C and health store channels.

Competitive differentiation is rapidly evolving toward format flexibility, digestive optimization, and science-backed claims, with sustained focus on bioavailability, gut health integration, and clean-label positioning across all tiers of players.

Key Developments in Miniprotein Supplement Market

  • In June 2025, Nestlé Health Science introduced BOOST Advanced Nutritional Shake, containing 35 g whey protein, prebiotic fibre, and B‑vitamins to support lean muscle, digestive health, and metabolism for adults using GLP‑1 weight loss drugs or dieting. It is available in Rich Chocolate and French Vanilla flavors.
  • In April 2025, Nestlé’s research division revealed its proprietary whey protein microgel technology, backed by 11 new patents, designed to create highly concentrated, flavor-neutral, and shelf-stable protein beverages. Clinical trials showed improved glucose response and increased GLP‑1 release, strengthening its weight management nutrition portfolio.

Scope of the Report

Item Value
Quantitative Units USD 435.6 million in 2025
Ingredient Type Whey Miniprotein, Casein Miniprotein, Collagen Miniprotein, Egg White Miniprotein, Soy Miniprotein, Pea Miniprotein, Rice Miniprotein, Blended Plant Miniprotein, Specialty Miniproteins (e.g., Sunflower, Pumpkin Seed)
Application Sports Nutrition & Performance, Weight Management, Healthy Aging & Sarcopenia Support, Medical Nutrition (Post-surgery, Recovery), Pediatric Nutrition, Functional Foods & Beverages
Product Format Capsules, Tablets, Softgels, Powders, Ready-to-Drink (RTD), Gummies, Sachets/Stick Packs
Functionality Muscle Maintenance & Recovery, Joint & Bone Health, Metabolic Health, Skin, Hair & Nail Support, Cognitive Support
Sales Channel Pharmacies & Drugstores, Health & Nutrition Stores, Supermarkets/Hypermarkets, Online Retail, Direct-to-Consumer (D2C), Specialty Clinics & Hospitals
End User Athletes & Fitness Enthusiasts, Elderly Consumers, Patients in Recovery, Active Lifestyle Consumers
Regions Covered North America, Europe, Asia-Pacific, Latin America, Middle East & Africa
Countries Covered United States, Canada, Germany, France, United Kingdom, China, Japan, India, Brazil, South Korea

Key Segments

By Protein Type:

  • Whey Miniprotein
  • Casein Miniprotein
  • Collagen Miniprotein
  • Egg White Miniprotein
  • Soy Miniprotein
  • Pea Miniprotein
  • Rice Miniprotein
  • Blended Plant Miniprotein
  • Other Specialty Miniproteins (Pumpkin Seed, Sunflower, etc.)

By Application:

  • Sports Nutrition & Performance
  • Weight Management
  • Healthy Aging & Sarcopenia Support
  • Medical Nutrition (Post-surgery, Recovery)
  • Pediatric Nutrition
  • Functional Foods & Beverages

By Product Format:

  • Capsules
  • Tablets
  • Softgels
  • Powders
  • Ready-to-Drink (RTD)
  • Gummies
  • Sachets/Stick Packs

By Functionality:

  • Muscle Maintenance & Recovery
  • Joint & Bone Health
  • Metabolic Health
  • Skin, Hair & Nail Support
  • Cognitive Support

By Sales Channel:

  • Pharmacies & Drugstores
  • Health & Nutrition Stores
  • Supermarkets/Hypermarkets
  • Online Retail
  • Direct-to-Consumer (D2C)
  • Specialty Clinics & Hospitals

By End User:

  • Athletes & Fitness Enthusiasts
  • Elderly Consumers
  • Patients in Recovery
  • Active Lifestyle Consumers

By Region:

  • North America
  • Latin America
  • Europe
  • East Asia
  • South Asia & Pacific
  • MEA

Table of Content

  1. Executive Summary
    • Global Market Outlook
    • Demand-side Trends
    • Supply-side Trends
    • Technology Roadmap Analysis
    • Analysis and Recommendations
  2. Market Overview
    • Market Coverage / Taxonomy
    • Market Definition / Scope / Limitations
  3. Market Background
    • Market Dynamics
      • Drivers
      • Restraints
      • Opportunity
      • Trends
    • Scenario Forecast
      • Demand in Optimistic Scenario
      • Demand in Likely Scenario
      • Demand in Conservative Scenario
    • Opportunity Map Analysis
    • Product Life Cycle Analysis
    • Supply Chain Analysis
      • Supply Side Participants and their Roles
        • Producers
        • Mid-Level Participants (Traders/ Agents/ Brokers)
        • Wholesalers and Distributors
      • Value Added and Value Created at Node in the Supply Chain
      • List of Raw Material Suppliers
      • List of Existing and Potential Buyer’s
    • Investment Feasibility Matrix
    • Value Chain Analysis
      • Profit Margin Analysis
      • Wholesalers and Distributors
      • Retailers
    • PESTLE and Porter’s Analysis
    • Regulatory Landscape
      • By Key Regions
      • By Key Countries
    • Regional Parent Market Outlook
    • Production and Consumption Statistics
    • Import and Export Statistics
  4. Global Market Analysis 2020 to 2024 and Forecast, 2025 to 2035
    • Historical Market Size Value (USD Million) & Volume (Units) Analysis, 2020 to 2024
    • Current and Future Market Size Value (USD Million) & Volume (Units) Projections, 2025 to 2035
      • Y-o-Y Growth Trend Analysis
      • Absolute $ Opportunity Analysis
  5. Global Market Analysis 2020 to 2024 and Forecast 2025 to 2035, By Protein Type
    • Introduction / Key Findings
    • Historical Market Size Value (USD Million) & Volume (Units) Analysis By Protein Type, 2020 to 2024
    • Current and Future Market Size Value (USD Million) & Volume (Units) Analysis and Forecast By Protein Type, 2025 to 2035
      • Whey Miniprotein
      • Casein Miniprotein
      • Collagen Miniprotein
      • Egg White Miniprotein
      • Soy Miniprotein
      • Pea Miniprotein
      • Rice Miniprotein
      • Blended Plant Miniprotein
      • Other Specialty Miniproteins (Pumpkin Seed, Sunflower, etc.)
    • Y-o-Y Growth Trend Analysis By Protein Type, 2020 to 2024
    • Absolute $ Opportunity Analysis By Protein Type, 2025 to 2035
  6. Global Market Analysis 2020 to 2024 and Forecast 2025 to 2035, By Application
    • Introduction / Key Findings
    • Historical Market Size Value (USD Million) & Volume (Units) Analysis By Application, 2020 to 2024
    • Current and Future Market Size Value (USD Million) & Volume (Units) Analysis and Forecast By Application, 2025 to 2035
      • Sports Nutrition & Performance
      • Weight Management
      • Healthy Aging & Sarcopenia Support
      • Medical Nutrition (Post-surgery, Recovery)
      • Pediatric Nutrition
      • Functional Foods & Beverages
    • Y-o-Y Growth Trend Analysis By Application, 2020 to 2024
    • Absolute $ Opportunity Analysis By Application, 2025 to 2035
  7. Global Market Analysis 2020 to 2024 and Forecast 2025 to 2035, By Product Format
    • Introduction / Key Findings
    • Historical Market Size Value (USD Million) & Volume (Units) Analysis By Product Format, 2020 to 2024
    • Current and Future Market Size Value (USD Million) & Volume (Units) Analysis and Forecast By Product Format, 2025 to 2035
      • Capsules
      • Tablets
      • Softgels
      • Powders
      • Ready-to-Drink (RTD)
      • Gummies
      • Sachets/Stick Packs
    • Y-o-Y Growth Trend Analysis By Product Format, 2020 to 2024
    • Absolute $ Opportunity Analysis By Product Format, 2025 to 2035
  8. Global Market Analysis 2020 to 2024 and Forecast 2025 to 2035, By Functionality
    • Introduction / Key Findings
    • Historical Market Size Value (USD Million) & Volume (Units) Analysis By Functionality, 2020 to 2024
    • Current and Future Market Size Value (USD Million) & Volume (Units) Analysis and Forecast By Functionality, 2025 to 2035
      • Muscle Maintenance & Recovery
      • Joint & Bone Health
      • Metabolic Health
      • Skin, Hair & Nail Support
      • Cognitive Support
    • Y-o-Y Growth Trend Analysis By Functionality, 2020 to 2024
    • Absolute $ Opportunity Analysis By Functionality, 2025 to 2035
  9. Global Market Analysis 2020 to 2024 and Forecast 2025 to 2035, By Sales Channel
    • Introduction / Key Findings
    • Historical Market Size Value (USD Million) & Volume (Units) Analysis By Sales Channel, 2020 to 2024
    • Current and Future Market Size Value (USD Million) & Volume (Units) Analysis and Forecast By Sales Channel, 2025 to 2035
      • Pharmacies & Drugstores
      • Health & Nutrition Stores
      • Supermarkets/Hypermarkets
      • Online Retail
      • Direct-to-Consumer (D2C)
      • Specialty Clinics & Hospitals
    • Y-o-Y Growth Trend Analysis By Sales Channel, 2020 to 2024
    • Absolute $ Opportunity Analysis By Sales Channel, 2025 to 2035
  10. Global Market Analysis 2020 to 2024 and Forecast 2025 to 2035, By End User
    • Introduction / Key Findings
    • Historical Market Size Value (USD Million) & Volume (Units) Analysis By End User, 2020 to 2024
    • Current and Future Market Size Value (USD Million) & Volume (Units) Analysis and Forecast By End User, 2025 to 2035
      • Athletes & Fitness Enthusiasts
      • Elderly Consumers
      • Patients in Recovery
      • Active Lifestyle Consumers
    • Y-o-Y Growth Trend Analysis By End User, 2020 to 2024
    • Absolute $ Opportunity Analysis By End User, 2025 to 2035
  11. Global Market Analysis 2020 to 2024 and Forecast 2025 to 2035, By Region
    • Introduction
    • Historical Market Size Value (USD Million) & Volume (Units) Analysis By Region, 2020 to 2024
    • Current Market Size Value (USD Million) & Volume (Units) Analysis and Forecast By Region, 2025 to 2035
      • North America
      • Latin America
      • Europe
      • East Asia
      • South Asia & Pacific
      • MEA
    • Market Attractiveness Analysis By Region
  12. North America Market Analysis 2020 to 2024 and Forecast 2025 to 2035, By Country
    • Historical Market Size Value (USD Million) & Volume (Units) Trend Analysis By Market Taxonomy, 2020 to 2024
    • Market Size Value (USD Million) & Volume (Units) Forecast By Market Taxonomy, 2025 to 2035
      • By Country
        • USA
        • Canada
      • By Protein Type
      • By Application
      • By Product Format
      • By Functionality
      • By Sales Channel
      • By End User
    • Market Attractiveness Analysis
      • By Country
      • By Protein Type
      • By Application
      • By Product Format
      • By Functionality
      • By Sales Channel
      • By End User
    • Key Takeaways
  13. Latin America Market Analysis 2020 to 2024 and Forecast 2025 to 2035, By Country
    • Historical Market Size Value (USD Million) & Volume (Units) Trend Analysis By Market Taxonomy, 2020 to 2024
    • Market Size Value (USD Million) & Volume (Units) Forecast By Market Taxonomy, 2025 to 2035
      • By Country
        • Brazil
        • Mexico
        • Colombia
        • Rest of Latin America
      • By Protein Type
      • By Application
      • By Product Format
      • By Functionality
      • By Sales Channel
      • By End User
    • Market Attractiveness Analysis
      • By Country
      • By Protein Type
      • By Application
      • By Product Format
      • By Functionality
      • By Sales Channel
      • By End User
    • Key Takeaways
  14. Europe Market Analysis 2020 to 2024 and Forecast 2025 to 2035, By Country
    • Historical Market Size Value (USD Million) & Volume (Units) Trend Analysis By Market Taxonomy, 2020 to 2024
    • Market Size Value (USD Million) & Volume (Units) Forecast By Market Taxonomy, 2025 to 2035
      • By Country
        • Germany
        • UK
        • France
        • Italy
        • Spain
        • Belgium
        • Netherlands
        • Nordic
        • Switzerland
        • Russia
        • Poland
        • Rest of Europe
      • By Protein Type
      • By Application
      • By Product Format
      • By Functionality
      • By Sales Channel
      • By End User
    • Market Attractiveness Analysis
      • By Country
      • By Protein Type
      • By Application
      • By Product Format
      • By Functionality
      • By Sales Channel
      • By End User
    • Key Takeaways
  15. East Asia Market Analysis 2020 to 2024 and Forecast 2025 to 2035, By Country
    • Historical Market Size Value (USD Million) & Volume (Units) Trend Analysis By Market Taxonomy, 2020 to 2024
    • Market Size Value (USD Million) & Volume (Units) Forecast By Market Taxonomy, 2025 to 2035
      • By Country
        • China
        • Japan
        • South Korea
      • By Protein Type
      • By Application
      • By Product Format
      • By Functionality
      • By Sales Channel
      • By End User
    • Market Attractiveness Analysis
      • By Country
      • By Protein Type
      • By Application
      • By Product Format
      • By Functionality
      • By Sales Channel
      • By End User
    • Key Takeaways
  16. South Asia & Pacific Market Analysis 2020 to 2024 and Forecast 2025 to 2035, By Country
    • Historical Market Size Value (USD Million) & Volume (Units) Trend Analysis By Market Taxonomy, 2020 to 2024
    • Market Size Value (USD Million) & Volume (Units) Forecast By Market Taxonomy, 2025 to 2035
      • By Country
        • India
        • Thailand
        • Malaysia
        • Indonesia
        • Singapore
        • Vietnam
        • Australia
        • New Zealand
        • Rest of South Asia
      • By Protein Type
      • By Application
      • By Product Format
      • By Functionality
      • By Sales Channel
      • By End User
    • Market Attractiveness Analysis
      • By Country
      • By Protein Type
      • By Application
      • By Product Format
      • By Functionality
      • By Sales Channel
      • By End User
    • Key Takeaways
  17. MEA Market Analysis 2020 to 2024 and Forecast 2025 to 2035, By Country
    • Historical Market Size Value (USD Million) & Volume (Units) Trend Analysis By Market Taxonomy, 2020 to 2024
    • Market Size Value (USD Million) & Volume (Units) Forecast By Market Taxonomy, 2025 to 2035
      • By Country
        • Turkey
        • UAE
        • Saudi Arabia
        • Israel
        • Other GCC Countries
        • North Africa
        • South Africa
        • Central Africa
        • Rest of MEA
      • By Protein Type
      • By Application
      • By Product Format
      • By Functionality
      • By Sales Channel
      • By End User
    • Market Attractiveness Analysis
      • By Country
      • By Protein Type
      • By Application
      • By Product Format
      • By Functionality
      • By Sales Channel
      • By End User
    • Key Takeaways
  18. Key Countries Market Analysis
    • USA
      • Pricing Analysis
      • Market Share Analysis, 2024
        • By Protein Type
        • By Application
        • By Product Format
        • By Functionality
        • By Sales Channel
        • By End User
    • Canada
      • Pricing Analysis
      • Market Share Analysis, 2024
        • By Protein Type
        • By Application
        • By Product Format
        • By Functionality
        • By Sales Channel
        • By End User
    • Brazil
      • Pricing Analysis
      • Market Share Analysis, 2024
        • By Protein Type
        • By Application
        • By Product Format
        • By Functionality
        • By Sales Channel
        • By End User
    • Mexico
      • Pricing Analysis
      • Market Share Analysis, 2024
        • By Protein Type
        • By Application
        • By Product Format
        • By Functionality
        • By Sales Channel
        • By End User
    • Colombia
      • Pricing Analysis
      • Market Share Analysis, 2024
        • By Protein Type
        • By Application
        • By Product Format
        • By Functionality
        • By Sales Channel
        • By End User
    • Germany
      • Pricing Analysis
      • Market Share Analysis, 2024
        • By Protein Type
        • By Application
        • By Product Format
        • By Functionality
        • By Sales Channel
        • By End User
    • UK
      • Pricing Analysis
      • Market Share Analysis, 2024
        • By Protein Type
        • By Application
        • By Product Format
        • By Functionality
        • By Sales Channel
        • By End User
    • France
      • Pricing Analysis
      • Market Share Analysis, 2024
        • By Protein Type
        • By Application
        • By Product Format
        • By Functionality
        • By Sales Channel
        • By End User
    • Italy
      • Pricing Analysis
      • Market Share Analysis, 2024
        • By Protein Type
        • By Application
        • By Product Format
        • By Functionality
        • By Sales Channel
        • By End User
    • Spain
      • Pricing Analysis
      • Market Share Analysis, 2024
        • By Protein Type
        • By Application
        • By Product Format
        • By Functionality
        • By Sales Channel
        • By End User
    • Belgium
      • Pricing Analysis
      • Market Share Analysis, 2024
        • By Protein Type
        • By Application
        • By Product Format
        • By Functionality
        • By Sales Channel
        • By End User
    • Netherlands
      • Pricing Analysis
      • Market Share Analysis, 2024
        • By Protein Type
        • By Application
        • By Product Format
        • By Functionality
        • By Sales Channel
        • By End User
    • Nordic
      • Pricing Analysis
      • Market Share Analysis, 2024
        • By Protein Type
        • By Application
        • By Product Format
        • By Functionality
        • By Sales Channel
        • By End User
    • Switzerland
      • Pricing Analysis
      • Market Share Analysis, 2024
        • By Protein Type
        • By Application
        • By Product Format
        • By Functionality
        • By Sales Channel
        • By End User
    • Russia
      • Pricing Analysis
      • Market Share Analysis, 2024
        • By Protein Type
        • By Application
        • By Product Format
        • By Functionality
        • By Sales Channel
        • By End User
    • Poland
      • Pricing Analysis
      • Market Share Analysis, 2024
        • By Protein Type
        • By Application
        • By Product Format
        • By Functionality
        • By Sales Channel
        • By End User
    • China
      • Pricing Analysis
      • Market Share Analysis, 2024
        • By Protein Type
        • By Application
        • By Product Format
        • By Functionality
        • By Sales Channel
        • By End User
    • Japan
      • Pricing Analysis
      • Market Share Analysis, 2024
        • By Protein Type
        • By Application
        • By Product Format
        • By Functionality
        • By Sales Channel
        • By End User
    • South Korea
      • Pricing Analysis
      • Market Share Analysis, 2024
        • By Protein Type
        • By Application
        • By Product Format
        • By Functionality
        • By Sales Channel
        • By End User
    • India
      • Pricing Analysis
      • Market Share Analysis, 2024
        • By Protein Type
        • By Application
        • By Product Format
        • By Functionality
        • By Sales Channel
        • By End User
    • Thailand
      • Pricing Analysis
      • Market Share Analysis, 2024
        • By Protein Type
        • By Application
        • By Product Format
        • By Functionality
        • By Sales Channel
        • By End User
    • Indonesia
      • Pricing Analysis
      • Market Share Analysis, 2024
        • By Protein Type
        • By Application
        • By Product Format
        • By Functionality
        • By Sales Channel
        • By End User
    • Australia
      • Pricing Analysis
      • Market Share Analysis, 2024
        • By Protein Type
        • By Application
        • By Product Format
        • By Functionality
        • By Sales Channel
        • By End User
    • New Zealand
      • Pricing Analysis
      • Market Share Analysis, 2024
        • By Protein Type
        • By Application
        • By Product Format
        • By Functionality
        • By Sales Channel
        • By End User
    • Turkey
      • Pricing Analysis
      • Market Share Analysis, 2024
        • By Protein Type
        • By Application
        • By Product Format
        • By Functionality
        • By Sales Channel
        • By End User
    • UAE
      • Pricing Analysis
      • Market Share Analysis, 2024
        • By Protein Type
        • By Application
        • By Product Format
        • By Functionality
        • By Sales Channel
        • By End User
    • Saudi Arabia
      • Pricing Analysis
      • Market Share Analysis, 2024
        • By Protein Type
        • By Application
        • By Product Format
        • By Functionality
        • By Sales Channel
        • By End User
    • Israel
      • Pricing Analysis
      • Market Share Analysis, 2024
        • By Protein Type
        • By Application
        • By Product Format
        • By Functionality
        • By Sales Channel
        • By End User
    • North Africa
      • Pricing Analysis
      • Market Share Analysis, 2024
        • By Protein Type
        • By Application
        • By Product Format
        • By Functionality
        • By Sales Channel
        • By End User
    • South Africa
      • Pricing Analysis
      • Market Share Analysis, 2024
        • By Protein Type
        • By Application
        • By Product Format
        • By Functionality
        • By Sales Channel
        • By End User
  19. Market Structure Analysis
    • Competition Dashboard
    • Competition Benchmarking
    • Market Share Analysis of Top Players
      • By Regional
      • By Protein Type
      • By Application
      • By Product Format
      • By Functionality
      • By Sales Channel
      • By End User
  20. Competition Analysis
    • Competition Deep Dive
      • Nestlé Health Science
        • Overview
        • Product Portfolio
        • Profitability by Market Segments (Product/Age /Sales Channel/Region)
        • Sales Footprint
        • Strategy Overview
          • Marketing Strategy
          • Product Strategy
          • Channel Strategy
      • Abbott Nutrition
        • Overview
        • Product Portfolio
        • Profitability by Market Segments (Product/Age /Sales Channel/Region)
        • Sales Footprint
        • Strategy Overview
          • Marketing Strategy
          • Product Strategy
          • Channel Strategy
      • Glanbia Performance Nutrition
        • Overview
        • Product Portfolio
        • Profitability by Market Segments (Product/Age /Sales Channel/Region)
        • Sales Footprint
        • Strategy Overview
          • Marketing Strategy
          • Product Strategy
          • Channel Strategy
      • FrieslandCampina Ingredients
        • Overview
        • Product Portfolio
        • Profitability by Market Segments (Product/Age /Sales Channel/Region)
        • Sales Footprint
        • Strategy Overview
          • Marketing Strategy
          • Product Strategy
          • Channel Strategy
      • Arla Foods Ingredients
        • Overview
        • Product Portfolio
        • Profitability by Market Segments (Product/Age /Sales Channel/Region)
        • Sales Footprint
        • Strategy Overview
          • Marketing Strategy
          • Product Strategy
          • Channel Strategy
      • Fonterra Co-operative Group
        • Overview
        • Product Portfolio
        • Profitability by Market Segments (Product/Age /Sales Channel/Region)
        • Sales Footprint
        • Strategy Overview
          • Marketing Strategy
          • Product Strategy
          • Channel Strategy
      • Hilmar Ingredients
        • Overview
        • Product Portfolio
        • Profitability by Market Segments (Product/Age /Sales Channel/Region)
        • Sales Footprint
        • Strategy Overview
          • Marketing Strategy
          • Product Strategy
          • Channel Strategy
      • Amway (Nutrilite)
        • Overview
        • Product Portfolio
        • Profitability by Market Segments (Product/Age /Sales Channel/Region)
        • Sales Footprint
        • Strategy Overview
          • Marketing Strategy
          • Product Strategy
          • Channel Strategy
      • Herbalife Nutrition
        • Overview
        • Product Portfolio
        • Profitability by Market Segments (Product/Age /Sales Channel/Region)
        • Sales Footprint
        • Strategy Overview
          • Marketing Strategy
          • Product Strategy
          • Channel Strategy
      • NOW Foods
        • Overview
        • Product Portfolio
        • Profitability by Market Segments (Product/Age /Sales Channel/Region)
        • Sales Footprint
        • Strategy Overview
          • Marketing Strategy
          • Product Strategy
          • Channel Strategy
      • Others
        • Overview
        • Product Portfolio
        • Profitability by Market Segments (Product/Age /Sales Channel/Region)
        • Sales Footprint
        • Strategy Overview
          • Marketing Strategy
          • Product Strategy
          • Channel Strategy
  21. Assumptions & Acronyms Used
  22. Research Methodology

List of Tables

  • Table 1: Global Market Value (USD Million) Forecast by Region, 2020-2035
  • Table 2: Global Market Volume (Units) Forecast by Region, 2020-2035
  • Table 3: Global Market Value (USD Million) Forecast By Protein Type, 2020-2035
  • Table 4: Global Market Volume (Units) Forecast By Protein Type, 2020-2035
  • Table 5: Global Market Value (USD Million) Forecast By Application, 2020-2035
  • Table 6: Global Market Volume (Units) Forecast By Application, 2020-2035
  • Table 7: Global Market Value (USD Million) Forecast By Product Format, 2020-2035
  • Table 8: Global Market Volume (Units) Forecast By Product Format, 2020-2035
  • Table 9: Global Market Value (USD Million) Forecast By Functionality, 2020-2035
  • Table 10: Global Market Volume (Units) Forecast By Functionality, 2020-2035
  • Table 11: Global Market Value (USD Million) Forecast By Sales Channel, 2020-2035
  • Table 12: Global Market Volume (Units) Forecast By Sales Channel, 2020-2035
  • Table 13: Global Market Value (USD Million) Forecast By End User, 2020-2035
  • Table 14: Global Market Volume (Units) Forecast By End User, 2020-2035
  • Table 15: North America Market Value (USD Million) Forecast by Country, 2020-2035
  • Table 16: North America Market Volume (Units) Forecast by Country, 2020-2035
  • Table 17: North America Market Value (USD Million) Forecast By Protein Type, 2020-2035
  • Table 18: North America Market Volume (Units) Forecast By Protein Type, 2020-2035
  • Table 19: North America Market Value (USD Million) Forecast By Application, 2020-2035
  • Table 20: North America Market Volume (Units) Forecast By Application, 2020-2035
  • Table 21: North America Market Value (USD Million) Forecast By Product Format, 2020-2035
  • Table 22: North America Market Volume (Units) Forecast By Product Format, 2020-2035
  • Table 23: North America Market Value (USD Million) Forecast By Functionality, 2020-2035
  • Table 24: North America Market Volume (Units) Forecast By Functionality, 2020-2035
  • Table 25: North America Market Value (USD Million) Forecast By Sales Channel, 2020-2035
  • Table 26: North America Market Volume (Units) Forecast By Sales Channel, 2020-2035
  • Table 27: North America Market Value (USD Million) Forecast By End User, 2020-2035
  • Table 28: North America Market Volume (Units) Forecast By End User, 2020-2035
  • Table 29: Latin America Market Value (USD Million) Forecast by Country, 2020-2035
  • Table 30: Latin America Market Volume (Units) Forecast by Country, 2020-2035
  • Table 31: Latin America Market Value (USD Million) Forecast By Protein Type, 2020-2035
  • Table 32: Latin America Market Volume (Units) Forecast By Protein Type, 2020-2035
  • Table 33: Latin America Market Value (USD Million) Forecast By Application, 2020-2035
  • Table 34: Latin America Market Volume (Units) Forecast By Application, 2020-2035
  • Table 35: Latin America Market Value (USD Million) Forecast By Product Format, 2020-2035
  • Table 36: Latin America Market Volume (Units) Forecast By Product Format, 2020-2035
  • Table 37: Latin America Market Value (USD Million) Forecast By Functionality, 2020-2035
  • Table 38: Latin America Market Volume (Units) Forecast By Functionality, 2020-2035
  • Table 39: Latin America Market Value (USD Million) Forecast By Sales Channel, 2020-2035
  • Table 40: Latin America Market Volume (Units) Forecast By Sales Channel, 2020-2035
  • Table 41: Latin America Market Value (USD Million) Forecast By End User, 2020-2035
  • Table 42: Latin America Market Volume (Units) Forecast By End User, 2020-2035
  • Table 43: Europe Market Value (USD Million) Forecast by Country, 2020-2035
  • Table 44: Europe Market Volume (Units) Forecast by Country, 2020-2035
  • Table 45: Europe Market Value (USD Million) Forecast By Protein Type, 2020-2035
  • Table 46: Europe Market Volume (Units) Forecast By Protein Type, 2020-2035
  • Table 47: Europe Market Value (USD Million) Forecast By Application, 2020-2035
  • Table 48: Europe Market Volume (Units) Forecast By Application, 2020-2035
  • Table 49: Europe Market Value (USD Million) Forecast By Product Format, 2020-2035
  • Table 50: Europe Market Volume (Units) Forecast By Product Format, 2020-2035
  • Table 51: Europe Market Value (USD Million) Forecast By Functionality, 2020-2035
  • Table 52: Europe Market Volume (Units) Forecast By Functionality, 2020-2035
  • Table 53: Europe Market Value (USD Million) Forecast By Sales Channel, 2020-2035
  • Table 54: Europe Market Volume (Units) Forecast By Sales Channel, 2020-2035
  • Table 55: Europe Market Value (USD Million) Forecast By End User, 2020-2035
  • Table 56: Europe Market Volume (Units) Forecast By End User, 2020-2035
  • Table 57: East Asia Market Value (USD Million) Forecast by Country, 2020-2035
  • Table 58: East Asia Market Volume (Units) Forecast by Country, 2020-2035
  • Table 59: East Asia Market Value (USD Million) Forecast By Protein Type, 2020-2035
  • Table 60: East Asia Market Volume (Units) Forecast By Protein Type, 2020-2035
  • Table 61: East Asia Market Value (USD Million) Forecast By Application, 2020-2035
  • Table 62: East Asia Market Volume (Units) Forecast By Application, 2020-2035
  • Table 63: East Asia Market Value (USD Million) Forecast By Product Format, 2020-2035
  • Table 64: East Asia Market Volume (Units) Forecast By Product Format, 2020-2035
  • Table 65: East Asia Market Value (USD Million) Forecast By Functionality, 2020-2035
  • Table 66: East Asia Market Volume (Units) Forecast By Functionality, 2020-2035
  • Table 67: East Asia Market Value (USD Million) Forecast By Sales Channel, 2020-2035
  • Table 68: East Asia Market Volume (Units) Forecast By Sales Channel, 2020-2035
  • Table 69: East Asia Market Value (USD Million) Forecast By End User, 2020-2035
  • Table 70: East Asia Market Volume (Units) Forecast By End User, 2020-2035
  • Table 71: South Asia & Pacific Market Value (USD Million) Forecast by Country, 2020-2035
  • Table 72: South Asia & Pacific Market Volume (Units) Forecast by Country, 2020-2035
  • Table 73: South Asia & Pacific Market Value (USD Million) Forecast By Protein Type, 2020-2035
  • Table 74: South Asia & Pacific Market Volume (Units) Forecast By Protein Type, 2020-2035
  • Table 75: South Asia & Pacific Market Value (USD Million) Forecast By Application, 2020-2035
  • Table 76: South Asia & Pacific Market Volume (Units) Forecast By Application, 2020-2035
  • Table 77: South Asia & Pacific Market Value (USD Million) Forecast By Product Format, 2020-2035
  • Table 78: South Asia & Pacific Market Volume (Units) Forecast By Product Format, 2020-2035
  • Table 79: South Asia & Pacific Market Value (USD Million) Forecast By Functionality, 2020-2035
  • Table 80: South Asia & Pacific Market Volume (Units) Forecast By Functionality, 2020-2035
  • Table 81: South Asia & Pacific Market Value (USD Million) Forecast By Sales Channel, 2020-2035
  • Table 82: South Asia & Pacific Market Volume (Units) Forecast By Sales Channel, 2020-2035
  • Table 83: South Asia & Pacific Market Value (USD Million) Forecast By End User, 2020-2035
  • Table 84: South Asia & Pacific Market Volume (Units) Forecast By End User, 2020-2035
  • Table 85: MEA Market Value (USD Million) Forecast by Country, 2020-2035
  • Table 86: MEA Market Volume (Units) Forecast by Country, 2020-2035
  • Table 87: MEA Market Value (USD Million) Forecast By Protein Type, 2020-2035
  • Table 88: MEA Market Volume (Units) Forecast By Protein Type, 2020-2035
  • Table 89: MEA Market Value (USD Million) Forecast By Application, 2020-2035
  • Table 90: MEA Market Volume (Units) Forecast By Application, 2020-2035
  • Table 91: MEA Market Value (USD Million) Forecast By Product Format, 2020-2035
  • Table 92: MEA Market Volume (Units) Forecast By Product Format, 2020-2035
  • Table 93: MEA Market Value (USD Million) Forecast By Functionality, 2020-2035
  • Table 94: MEA Market Volume (Units) Forecast By Functionality, 2020-2035
  • Table 95: MEA Market Value (USD Million) Forecast By Sales Channel, 2020-2035
  • Table 96: MEA Market Volume (Units) Forecast By Sales Channel, 2020-2035
  • Table 97: MEA Market Value (USD Million) Forecast By End User, 2020-2035
  • Table 98: MEA Market Volume (Units) Forecast By End User, 2020-2035

List of Figures

  • Figure 1: Global Market Value (USD Million) By Protein Type, 2025-2035
  • Figure 2: Global Market Value (USD Million) By Application, 2025-2035
  • Figure 3: Global Market Value (USD Million) By Product Format, 2025-2035
  • Figure 4: Global Market Value (USD Million) By Functionality, 2025-2035
  • Figure 5: Global Market Value (USD Million) By Sales Channel, 2025-2035
  • Figure 6: Global Market Value (USD Million) By End User, 2025-2035
  • Figure 7: Global Market Value (USD Million) by Region, 2025-2035
  • Figure 8: Global Market Value (USD Million) Analysis by Region, 2020-2035
  • Figure 9: Global Market Volume (Units) Analysis by Region, 2020-2035
  • Figure 10: Global Market Value Share (%) and BPS Analysis by Region, 2025-2035
  • Figure 11: Global Market Y-o-Y Growth (%) Projections by Region, 2025-2035
  • Figure 12: Global Market Value (USD Million) Analysis By Protein Type, 2020-2035
  • Figure 13: Global Market Volume (Units) Analysis By Protein Type, 2020-2035
  • Figure 14: Global Market Value Share (%) and BPS Analysis By Protein Type, 2025-2035
  • Figure 15: Global Market Y-o-Y Growth (%) Projections By Protein Type, 2025-2035
  • Figure 16: Global Market Value (USD Million) Analysis By Application, 2020-2035
  • Figure 17: Global Market Volume (Units) Analysis By Application, 2020-2035
  • Figure 18: Global Market Value Share (%) and BPS Analysis By Application, 2025-2035
  • Figure 19: Global Market Y-o-Y Growth (%) Projections By Application, 2025-2035
  • Figure 20: Global Market Value (USD Million) Analysis By Product Format, 2020-2035
  • Figure 21: Global Market Volume (Units) Analysis By Product Format, 2020-2035
  • Figure 22: Global Market Value Share (%) and BPS Analysis By Product Format, 2025-2035
  • Figure 23: Global Market Y-o-Y Growth (%) Projections By Product Format, 2025-2035
  • Figure 24: Global Market Value (USD Million) Analysis By Functionality, 2020-2035
  • Figure 25: Global Market Volume (Units) Analysis By Functionality, 2020-2035
  • Figure 26: Global Market Value Share (%) and BPS Analysis By Functionality, 2025-2035
  • Figure 27: Global Market Y-o-Y Growth (%) Projections By Functionality, 2025-2035
  • Figure 28: Global Market Value (USD Million) Analysis By Sales Channel, 2020-2035
  • Figure 29: Global Market Volume (Units) Analysis By Sales Channel, 2020-2035
  • Figure 30: Global Market Value Share (%) and BPS Analysis By Sales Channel, 2025-2035
  • Figure 31: Global Market Y-o-Y Growth (%) Projections By Sales Channel, 2025-2035
  • Figure 32: Global Market Value (USD Million) Analysis By End User, 2020-2035
  • Figure 33: Global Market Volume (Units) Analysis By End User, 2020-2035
  • Figure 34: Global Market Value Share (%) and BPS Analysis By End User, 2025-2035
  • Figure 35: Global Market Y-o-Y Growth (%) Projections By End User, 2025-2035
  • Figure 36: Global Market Attractiveness By Protein Type, 2025-2035
  • Figure 37: Global Market Attractiveness By Application, 2025-2035
  • Figure 38: Global Market Attractiveness By Product Format, 2025-2035
  • Figure 39: Global Market Attractiveness By Functionality, 2025-2035
  • Figure 40: Global Market Attractiveness By Sales Channel, 2025-2035
  • Figure 41: Global Market Attractiveness By End User, 2025-2035
  • Figure 42: Global Market Attractiveness by Region, 2025-2035
  • Figure 43: North America Market Value (USD Million) By Protein Type, 2025-2035
  • Figure 44: North America Market Value (USD Million) By Application, 2025-2035
  • Figure 45: North America Market Value (USD Million) By Product Format, 2025-2035
  • Figure 46: North America Market Value (USD Million) By Functionality, 2025-2035
  • Figure 47: North America Market Value (USD Million) By Sales Channel, 2025-2035
  • Figure 48: North America Market Value (USD Million) By End User, 2025-2035
  • Figure 49: North America Market Value (USD Million) by Country, 2025-2035
  • Figure 50: North America Market Value (USD Million) Analysis by Country, 2020-2035
  • Figure 51: North America Market Volume (Units) Analysis by Country, 2020-2035
  • Figure 52: North America Market Value Share (%) and BPS Analysis by Country, 2025-2035
  • Figure 53: North America Market Y-o-Y Growth (%) Projections by Country, 2025-2035
  • Figure 54: North America Market Value (USD Million) Analysis By Protein Type, 2020-2035
  • Figure 55: North America Market Volume (Units) Analysis By Protein Type, 2020-2035
  • Figure 56: North America Market Value Share (%) and BPS Analysis By Protein Type, 2025-2035
  • Figure 57: North America Market Y-o-Y Growth (%) Projections By Protein Type, 2025-2035
  • Figure 58: North America Market Value (USD Million) Analysis By Application, 2020-2035
  • Figure 59: North America Market Volume (Units) Analysis By Application, 2020-2035
  • Figure 60: North America Market Value Share (%) and BPS Analysis By Application, 2025-2035
  • Figure 61: North America Market Y-o-Y Growth (%) Projections By Application, 2025-2035
  • Figure 62: North America Market Value (USD Million) Analysis By Product Format, 2020-2035
  • Figure 63: North America Market Volume (Units) Analysis By Product Format, 2020-2035
  • Figure 64: North America Market Value Share (%) and BPS Analysis By Product Format, 2025-2035
  • Figure 65: North America Market Y-o-Y Growth (%) Projections By Product Format, 2025-2035
  • Figure 66: North America Market Value (USD Million) Analysis By Functionality, 2020-2035
  • Figure 67: North America Market Volume (Units) Analysis By Functionality, 2020-2035
  • Figure 68: North America Market Value Share (%) and BPS Analysis By Functionality, 2025-2035
  • Figure 69: North America Market Y-o-Y Growth (%) Projections By Functionality, 2025-2035
  • Figure 70: North America Market Value (USD Million) Analysis By Sales Channel, 2020-2035
  • Figure 71: North America Market Volume (Units) Analysis By Sales Channel, 2020-2035
  • Figure 72: North America Market Value Share (%) and BPS Analysis By Sales Channel, 2025-2035
  • Figure 73: North America Market Y-o-Y Growth (%) Projections By Sales Channel, 2025-2035
  • Figure 74: North America Market Value (USD Million) Analysis By End User, 2020-2035
  • Figure 75: North America Market Volume (Units) Analysis By End User, 2020-2035
  • Figure 76: North America Market Value Share (%) and BPS Analysis By End User, 2025-2035
  • Figure 77: North America Market Y-o-Y Growth (%) Projections By End User, 2025-2035
  • Figure 78: North America Market Attractiveness By Protein Type, 2025-2035
  • Figure 79: North America Market Attractiveness By Application, 2025-2035
  • Figure 80: North America Market Attractiveness By Product Format, 2025-2035
  • Figure 81: North America Market Attractiveness By Functionality, 2025-2035
  • Figure 82: North America Market Attractiveness By Sales Channel, 2025-2035
  • Figure 83: North America Market Attractiveness By End User, 2025-2035
  • Figure 84: North America Market Attractiveness by Country, 2025-2035
  • Figure 85: Latin America Market Value (USD Million) By Protein Type, 2025-2035
  • Figure 86: Latin America Market Value (USD Million) By Application, 2025-2035
  • Figure 87: Latin America Market Value (USD Million) By Product Format, 2025-2035
  • Figure 88: Latin America Market Value (USD Million) By Functionality, 2025-2035
  • Figure 89: Latin America Market Value (USD Million) By Sales Channel, 2025-2035
  • Figure 90: Latin America Market Value (USD Million) By End User, 2025-2035
  • Figure 91: Latin America Market Value (USD Million) by Country, 2025-2035
  • Figure 92: Latin America Market Value (USD Million) Analysis by Country, 2020-2035
  • Figure 93: Latin America Market Volume (Units) Analysis by Country, 2020-2035
  • Figure 94: Latin America Market Value Share (%) and BPS Analysis by Country, 2025-2035
  • Figure 95: Latin America Market Y-o-Y Growth (%) Projections by Country, 2025-2035
  • Figure 96: Latin America Market Value (USD Million) Analysis By Protein Type, 2020-2035
  • Figure 97: Latin America Market Volume (Units) Analysis By Protein Type, 2020-2035
  • Figure 98: Latin America Market Value Share (%) and BPS Analysis By Protein Type, 2025-2035
  • Figure 99: Latin America Market Y-o-Y Growth (%) Projections By Protein Type, 2025-2035
  • Figure 100: Latin America Market Value (USD Million) Analysis By Application, 2020-2035
  • Figure 101: Latin America Market Volume (Units) Analysis By Application, 2020-2035
  • Figure 102: Latin America Market Value Share (%) and BPS Analysis By Application, 2025-2035
  • Figure 103: Latin America Market Y-o-Y Growth (%) Projections By Application, 2025-2035
  • Figure 104: Latin America Market Value (USD Million) Analysis By Product Format, 2020-2035
  • Figure 105: Latin America Market Volume (Units) Analysis By Product Format, 2020-2035
  • Figure 106: Latin America Market Value Share (%) and BPS Analysis By Product Format, 2025-2035
  • Figure 107: Latin America Market Y-o-Y Growth (%) Projections By Product Format, 2025-2035
  • Figure 108: Latin America Market Value (USD Million) Analysis By Functionality, 2020-2035
  • Figure 109: Latin America Market Volume (Units) Analysis By Functionality, 2020-2035
  • Figure 110: Latin America Market Value Share (%) and BPS Analysis By Functionality, 2025-2035
  • Figure 111: Latin America Market Y-o-Y Growth (%) Projections By Functionality, 2025-2035
  • Figure 112: Latin America Market Value (USD Million) Analysis By Sales Channel, 2020-2035
  • Figure 113: Latin America Market Volume (Units) Analysis By Sales Channel, 2020-2035
  • Figure 114: Latin America Market Value Share (%) and BPS Analysis By Sales Channel, 2025-2035
  • Figure 115: Latin America Market Y-o-Y Growth (%) Projections By Sales Channel, 2025-2035
  • Figure 116: Latin America Market Value (USD Million) Analysis By End User, 2020-2035
  • Figure 117: Latin America Market Volume (Units) Analysis By End User, 2020-2035
  • Figure 118: Latin America Market Value Share (%) and BPS Analysis By End User, 2025-2035
  • Figure 119: Latin America Market Y-o-Y Growth (%) Projections By End User, 2025-2035
  • Figure 120: Latin America Market Attractiveness By Protein Type, 2025-2035
  • Figure 121: Latin America Market Attractiveness By Application, 2025-2035
  • Figure 122: Latin America Market Attractiveness By Product Format, 2025-2035
  • Figure 123: Latin America Market Attractiveness By Functionality, 2025-2035
  • Figure 124: Latin America Market Attractiveness By Sales Channel, 2025-2035
  • Figure 125: Latin America Market Attractiveness By End User, 2025-2035
  • Figure 126: Latin America Market Attractiveness by Country, 2025-2035
  • Figure 127: Europe Market Value (USD Million) By Protein Type, 2025-2035
  • Figure 128: Europe Market Value (USD Million) By Application, 2025-2035
  • Figure 129: Europe Market Value (USD Million) By Product Format, 2025-2035
  • Figure 130: Europe Market Value (USD Million) By Functionality, 2025-2035
  • Figure 131: Europe Market Value (USD Million) By Sales Channel, 2025-2035
  • Figure 132: Europe Market Value (USD Million) By End User, 2025-2035
  • Figure 133: Europe Market Value (USD Million) by Country, 2025-2035
  • Figure 134: Europe Market Value (USD Million) Analysis by Country, 2020-2035
  • Figure 135: Europe Market Volume (Units) Analysis by Country, 2020-2035
  • Figure 136: Europe Market Value Share (%) and BPS Analysis by Country, 2025-2035
  • Figure 137: Europe Market Y-o-Y Growth (%) Projections by Country, 2025-2035
  • Figure 138: Europe Market Value (USD Million) Analysis By Protein Type, 2020-2035
  • Figure 139: Europe Market Volume (Units) Analysis By Protein Type, 2020-2035
  • Figure 140: Europe Market Value Share (%) and BPS Analysis By Protein Type, 2025-2035
  • Figure 141: Europe Market Y-o-Y Growth (%) Projections By Protein Type, 2025-2035
  • Figure 142: Europe Market Value (USD Million) Analysis By Application, 2020-2035
  • Figure 143: Europe Market Volume (Units) Analysis By Application, 2020-2035
  • Figure 144: Europe Market Value Share (%) and BPS Analysis By Application, 2025-2035
  • Figure 145: Europe Market Y-o-Y Growth (%) Projections By Application, 2025-2035
  • Figure 146: Europe Market Value (USD Million) Analysis By Product Format, 2020-2035
  • Figure 147: Europe Market Volume (Units) Analysis By Product Format, 2020-2035
  • Figure 148: Europe Market Value Share (%) and BPS Analysis By Product Format, 2025-2035
  • Figure 149: Europe Market Y-o-Y Growth (%) Projections By Product Format, 2025-2035
  • Figure 150: Europe Market Value (USD Million) Analysis By Functionality, 2020-2035
  • Figure 151: Europe Market Volume (Units) Analysis By Functionality, 2020-2035
  • Figure 152: Europe Market Value Share (%) and BPS Analysis By Functionality, 2025-2035
  • Figure 153: Europe Market Y-o-Y Growth (%) Projections By Functionality, 2025-2035
  • Figure 154: Europe Market Value (USD Million) Analysis By Sales Channel, 2020-2035
  • Figure 155: Europe Market Volume (Units) Analysis By Sales Channel, 2020-2035
  • Figure 156: Europe Market Value Share (%) and BPS Analysis By Sales Channel, 2025-2035
  • Figure 157: Europe Market Y-o-Y Growth (%) Projections By Sales Channel, 2025-2035
  • Figure 158: Europe Market Value (USD Million) Analysis By End User, 2020-2035
  • Figure 159: Europe Market Volume (Units) Analysis By End User, 2020-2035
  • Figure 160: Europe Market Value Share (%) and BPS Analysis By End User, 2025-2035
  • Figure 161: Europe Market Y-o-Y Growth (%) Projections By End User, 2025-2035
  • Figure 162: Europe Market Attractiveness By Protein Type, 2025-2035
  • Figure 163: Europe Market Attractiveness By Application, 2025-2035
  • Figure 164: Europe Market Attractiveness By Product Format, 2025-2035
  • Figure 165: Europe Market Attractiveness By Functionality, 2025-2035
  • Figure 166: Europe Market Attractiveness By Sales Channel, 2025-2035
  • Figure 167: Europe Market Attractiveness By End User, 2025-2035
  • Figure 168: Europe Market Attractiveness by Country, 2025-2035
  • Figure 169: East Asia Market Value (USD Million) By Protein Type, 2025-2035
  • Figure 170: East Asia Market Value (USD Million) By Application, 2025-2035
  • Figure 171: East Asia Market Value (USD Million) By Product Format, 2025-2035
  • Figure 172: East Asia Market Value (USD Million) By Functionality, 2025-2035
  • Figure 173: East Asia Market Value (USD Million) By Sales Channel, 2025-2035
  • Figure 174: East Asia Market Value (USD Million) By End User, 2025-2035
  • Figure 175: East Asia Market Value (USD Million) by Country, 2025-2035
  • Figure 176: East Asia Market Value (USD Million) Analysis by Country, 2020-2035
  • Figure 177: East Asia Market Volume (Units) Analysis by Country, 2020-2035
  • Figure 178: East Asia Market Value Share (%) and BPS Analysis by Country, 2025-2035
  • Figure 179: East Asia Market Y-o-Y Growth (%) Projections by Country, 2025-2035
  • Figure 180: East Asia Market Value (USD Million) Analysis By Protein Type, 2020-2035
  • Figure 181: East Asia Market Volume (Units) Analysis By Protein Type, 2020-2035
  • Figure 182: East Asia Market Value Share (%) and BPS Analysis By Protein Type, 2025-2035
  • Figure 183: East Asia Market Y-o-Y Growth (%) Projections By Protein Type, 2025-2035
  • Figure 184: East Asia Market Value (USD Million) Analysis By Application, 2020-2035
  • Figure 185: East Asia Market Volume (Units) Analysis By Application, 2020-2035
  • Figure 186: East Asia Market Value Share (%) and BPS Analysis By Application, 2025-2035
  • Figure 187: East Asia Market Y-o-Y Growth (%) Projections By Application, 2025-2035
  • Figure 188: East Asia Market Value (USD Million) Analysis By Product Format, 2020-2035
  • Figure 189: East Asia Market Volume (Units) Analysis By Product Format, 2020-2035
  • Figure 190: East Asia Market Value Share (%) and BPS Analysis By Product Format, 2025-2035
  • Figure 191: East Asia Market Y-o-Y Growth (%) Projections By Product Format, 2025-2035
  • Figure 192: East Asia Market Value (USD Million) Analysis By Functionality, 2020-2035
  • Figure 193: East Asia Market Volume (Units) Analysis By Functionality, 2020-2035
  • Figure 194: East Asia Market Value Share (%) and BPS Analysis By Functionality, 2025-2035
  • Figure 195: East Asia Market Y-o-Y Growth (%) Projections By Functionality, 2025-2035
  • Figure 196: East Asia Market Value (USD Million) Analysis By Sales Channel, 2020-2035
  • Figure 197: East Asia Market Volume (Units) Analysis By Sales Channel, 2020-2035
  • Figure 198: East Asia Market Value Share (%) and BPS Analysis By Sales Channel, 2025-2035
  • Figure 199: East Asia Market Y-o-Y Growth (%) Projections By Sales Channel, 2025-2035
  • Figure 200: East Asia Market Value (USD Million) Analysis By End User, 2020-2035
  • Figure 201: East Asia Market Volume (Units) Analysis By End User, 2020-2035
  • Figure 202: East Asia Market Value Share (%) and BPS Analysis By End User, 2025-2035
  • Figure 203: East Asia Market Y-o-Y Growth (%) Projections By End User, 2025-2035
  • Figure 204: East Asia Market Attractiveness By Protein Type, 2025-2035
  • Figure 205: East Asia Market Attractiveness By Application, 2025-2035
  • Figure 206: East Asia Market Attractiveness By Product Format, 2025-2035
  • Figure 207: East Asia Market Attractiveness By Functionality, 2025-2035
  • Figure 208: East Asia Market Attractiveness By Sales Channel, 2025-2035
  • Figure 209: East Asia Market Attractiveness By End User, 2025-2035
  • Figure 210: East Asia Market Attractiveness by Country, 2025-2035
  • Figure 211: South Asia & Pacific Market Value (USD Million) By Protein Type, 2025-2035
  • Figure 212: South Asia & Pacific Market Value (USD Million) By Application, 2025-2035
  • Figure 213: South Asia & Pacific Market Value (USD Million) By Product Format, 2025-2035
  • Figure 214: South Asia & Pacific Market Value (USD Million) By Functionality, 2025-2035
  • Figure 215: South Asia & Pacific Market Value (USD Million) By Sales Channel, 2025-2035
  • Figure 216: South Asia & Pacific Market Value (USD Million) By End User, 2025-2035
  • Figure 217: South Asia & Pacific Market Value (USD Million) by Country, 2025-2035
  • Figure 218: South Asia & Pacific Market Value (USD Million) Analysis by Country, 2020-2035
  • Figure 219: South Asia & Pacific Market Volume (Units) Analysis by Country, 2020-2035
  • Figure 220: South Asia & Pacific Market Value Share (%) and BPS Analysis by Country, 2025-2035
  • Figure 221: South Asia & Pacific Market Y-o-Y Growth (%) Projections by Country, 2025-2035
  • Figure 222: South Asia & Pacific Market Value (USD Million) Analysis By Protein Type, 2020-2035
  • Figure 223: South Asia & Pacific Market Volume (Units) Analysis By Protein Type, 2020-2035
  • Figure 224: South Asia & Pacific Market Value Share (%) and BPS Analysis By Protein Type, 2025-2035
  • Figure 225: South Asia & Pacific Market Y-o-Y Growth (%) Projections By Protein Type, 2025-2035
  • Figure 226: South Asia & Pacific Market Value (USD Million) Analysis By Application, 2020-2035
  • Figure 227: South Asia & Pacific Market Volume (Units) Analysis By Application, 2020-2035
  • Figure 228: South Asia & Pacific Market Value Share (%) and BPS Analysis By Application, 2025-2035
  • Figure 229: South Asia & Pacific Market Y-o-Y Growth (%) Projections By Application, 2025-2035
  • Figure 230: South Asia & Pacific Market Value (USD Million) Analysis By Product Format, 2020-2035
  • Figure 231: South Asia & Pacific Market Volume (Units) Analysis By Product Format, 2020-2035
  • Figure 232: South Asia & Pacific Market Value Share (%) and BPS Analysis By Product Format, 2025-2035
  • Figure 233: South Asia & Pacific Market Y-o-Y Growth (%) Projections By Product Format, 2025-2035
  • Figure 234: South Asia & Pacific Market Value (USD Million) Analysis By Functionality, 2020-2035
  • Figure 235: South Asia & Pacific Market Volume (Units) Analysis By Functionality, 2020-2035
  • Figure 236: South Asia & Pacific Market Value Share (%) and BPS Analysis By Functionality, 2025-2035
  • Figure 237: South Asia & Pacific Market Y-o-Y Growth (%) Projections By Functionality, 2025-2035
  • Figure 238: South Asia & Pacific Market Value (USD Million) Analysis By Sales Channel, 2020-2035
  • Figure 239: South Asia & Pacific Market Volume (Units) Analysis By Sales Channel, 2020-2035
  • Figure 240: South Asia & Pacific Market Value Share (%) and BPS Analysis By Sales Channel, 2025-2035
  • Figure 241: South Asia & Pacific Market Y-o-Y Growth (%) Projections By Sales Channel, 2025-2035
  • Figure 242: South Asia & Pacific Market Value (USD Million) Analysis By End User, 2020-2035
  • Figure 243: South Asia & Pacific Market Volume (Units) Analysis By End User, 2020-2035
  • Figure 244: South Asia & Pacific Market Value Share (%) and BPS Analysis By End User, 2025-2035
  • Figure 245: South Asia & Pacific Market Y-o-Y Growth (%) Projections By End User, 2025-2035
  • Figure 246: South Asia & Pacific Market Attractiveness By Protein Type, 2025-2035
  • Figure 247: South Asia & Pacific Market Attractiveness By Application, 2025-2035
  • Figure 248: South Asia & Pacific Market Attractiveness By Product Format, 2025-2035
  • Figure 249: South Asia & Pacific Market Attractiveness By Functionality, 2025-2035
  • Figure 250: South Asia & Pacific Market Attractiveness By Sales Channel, 2025-2035
  • Figure 251: South Asia & Pacific Market Attractiveness By End User, 2025-2035
  • Figure 252: South Asia & Pacific Market Attractiveness by Country, 2025-2035
  • Figure 253: MEA Market Value (USD Million) By Protein Type, 2025-2035
  • Figure 254: MEA Market Value (USD Million) By Application, 2025-2035
  • Figure 255: MEA Market Value (USD Million) By Product Format, 2025-2035
  • Figure 256: MEA Market Value (USD Million) By Functionality, 2025-2035
  • Figure 257: MEA Market Value (USD Million) By Sales Channel, 2025-2035
  • Figure 258: MEA Market Value (USD Million) By End User, 2025-2035
  • Figure 259: MEA Market Value (USD Million) by Country, 2025-2035
  • Figure 260: MEA Market Value (USD Million) Analysis by Country, 2020-2035
  • Figure 261: MEA Market Volume (Units) Analysis by Country, 2020-2035
  • Figure 262: MEA Market Value Share (%) and BPS Analysis by Country, 2025-2035
  • Figure 263: MEA Market Y-o-Y Growth (%) Projections by Country, 2025-2035
  • Figure 264: MEA Market Value (USD Million) Analysis By Protein Type, 2020-2035
  • Figure 265: MEA Market Volume (Units) Analysis By Protein Type, 2020-2035
  • Figure 266: MEA Market Value Share (%) and BPS Analysis By Protein Type, 2025-2035
  • Figure 267: MEA Market Y-o-Y Growth (%) Projections By Protein Type, 2025-2035
  • Figure 268: MEA Market Value (USD Million) Analysis By Application, 2020-2035
  • Figure 269: MEA Market Volume (Units) Analysis By Application, 2020-2035
  • Figure 270: MEA Market Value Share (%) and BPS Analysis By Application, 2025-2035
  • Figure 271: MEA Market Y-o-Y Growth (%) Projections By Application, 2025-2035
  • Figure 272: MEA Market Value (USD Million) Analysis By Product Format, 2020-2035
  • Figure 273: MEA Market Volume (Units) Analysis By Product Format, 2020-2035
  • Figure 274: MEA Market Value Share (%) and BPS Analysis By Product Format, 2025-2035
  • Figure 275: MEA Market Y-o-Y Growth (%) Projections By Product Format, 2025-2035
  • Figure 276: MEA Market Value (USD Million) Analysis By Functionality, 2020-2035
  • Figure 277: MEA Market Volume (Units) Analysis By Functionality, 2020-2035
  • Figure 278: MEA Market Value Share (%) and BPS Analysis By Functionality, 2025-2035
  • Figure 279: MEA Market Y-o-Y Growth (%) Projections By Functionality, 2025-2035
  • Figure 280: MEA Market Value (USD Million) Analysis By Sales Channel, 2020-2035
  • Figure 281: MEA Market Volume (Units) Analysis By Sales Channel, 2020-2035
  • Figure 282: MEA Market Value Share (%) and BPS Analysis By Sales Channel, 2025-2035
  • Figure 283: MEA Market Y-o-Y Growth (%) Projections By Sales Channel, 2025-2035
  • Figure 284: MEA Market Value (USD Million) Analysis By End User, 2020-2035
  • Figure 285: MEA Market Volume (Units) Analysis By End User, 2020-2035
  • Figure 286: MEA Market Value Share (%) and BPS Analysis By End User, 2025-2035
  • Figure 287: MEA Market Y-o-Y Growth (%) Projections By End User, 2025-2035
  • Figure 288: MEA Market Attractiveness By Protein Type, 2025-2035
  • Figure 289: MEA Market Attractiveness By Application, 2025-2035
  • Figure 290: MEA Market Attractiveness By Product Format, 2025-2035
  • Figure 291: MEA Market Attractiveness By Functionality, 2025-2035
  • Figure 292: MEA Market Attractiveness By Sales Channel, 2025-2035
  • Figure 293: MEA Market Attractiveness By End User, 2025-2035
  • Figure 294: MEA Market Attractiveness by Country, 2025-2035

Frequently Asked Questions

How big is the Miniprotein Supplement Market in 2025?

The global Miniprotein Supplement Market is estimated to be valued at USD 435.6 million in 2025, driven by increasing demand for targeted protein delivery in clinical, performance, and active lifestyle nutrition applications.

What will be the size of the Miniprotein Supplement Market in 2035?

The market size for the Miniprotein Supplement Market is projected to reach USD 783.8 million by 2035, reflecting its expanding role across healthy aging, medical recovery, and functional food applications.

How much will the Miniprotein Supplement Market grow between 2025 and 2035?

The Miniprotein Supplement Market is expected to grow at a compound annual growth rate (CAGR) of 6.0% between 2025 and 2035, nearly doubling in size over the forecast decade.

What are the key protein types in the Miniprotein Supplement Market?

The key protein types in the Miniprotein Supplement Market include Whey, Collagen, Blended Plant, Casein, Egg White, Soy, Pea, Rice, and Other Specialty Miniproteins such as pumpkin seed and sunflower-based formulations.

Which application segment is projected to contribute the most in 2025?

In terms of application, the Sports Nutrition & Performance segment is projected to command the largest share at 35% in 2025, owing to strong adoption among athletes and active lifestyle consumers seeking rapid protein absorption.

Explore Similar Insights

Future Market Insights

Miniprotein Supplement Market