

- Market Size (2026)
- USD 881.0 Mn
- Forecast (2036)
- USD 4419.0 Mn
- CAGR (2026 to 2036)
- 17.5%
How big is the Neurosurgery & Spine Robots Market in 2026?
USD 881.0 million in 2026 and USD 4,419.0 million by 2036 at a 17.5% CAGR.
Demand for neurosurgery and spine robots is projected to expand at 17.5% CAGR between 2026 and 2036, increasing valuation from USD 881.0 million in 2026 to USD 4,419.0 million by 2036. Robotic assistance improves precision during complex neurosurgery and spine procedures. For example, pedicle screw workflows provide standardized trajectories for these delicate operations. These advanced systems also offer repeatable imaging checkpoints to guide the surgical team. Cranial biopsy and electrode placement further help extend platform use across stereotactic planning. Such diverse features ensure accurate instrument alignment throughout the surgery. High-volume clinical data strongly supports the real-world utility of these platforms. In July 2024, MacLean and colleagues reported reviewing 46 studies covering 25,054 screws. Hospitals expect this evidence to support their comparison of accuracy and revision performance during capital reviews.
Regional priorities heavily influence hospitals by selecting spine and cranial robotic platforms worldwide. Institutions in China weigh domestic service access and compact system availability during their reviews. Hospitals in the United States and Europe stress regulatory documentation and implant compatibility. Specialized cranial workflows provide critical data to guide these distinct purchasing decisions. In February 2024, Kaewborisutsakul and colleagues reported analyzing 11,257 SEEG electrode implantations across 15 studies. This evidence highlights cranial workflow efficiency strengthening specialist-center evaluation with standard spine applications.
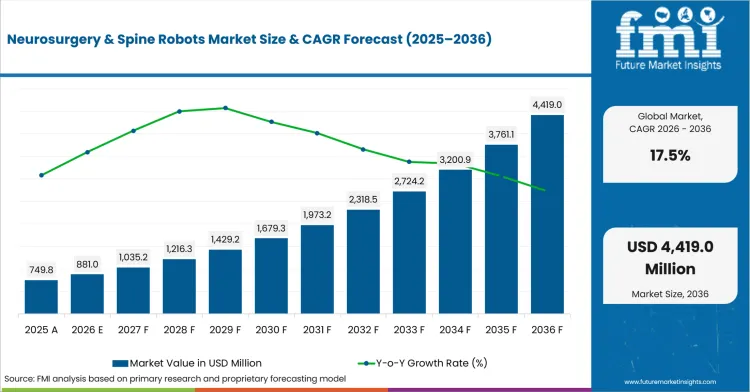
| Metric | Value |
|---|---|
| 2025 Market Size | USD 749.8 million |
| 2026 Market Size | USD 881.0 million |
| 2036 Market Size | USD 4,419.0 million |
| Forecast CAGR (2026-2036) | 17.5% |
| Component Focus | Systems |
| Systems Share (2026) | 52.0% |
| Business Model Focus | Capital Purchase |
| Capital Purchase Share (2026) | 50.0% |
| Technology Focus | Robotic Guidance Arms |
| Robotic Guidance Arms Share (2026) | 48.0% |
Summary of Neurosurgery & Spine Robots Market
| Market Signal | Commercial Impact |
|---|---|
| Demand and Growth Drivers | Neurosurgery and spine robot selection progresses as hospitals connect trajectory accuracy with procedural consistency. Program decisions reflect clinical evidence and specialist training.
|
| Product and Segment View | Segment direction is led by systems, followed by capital purchase and robotic guidance arms. Specification review is estimated to center on clinical range and imaging integration.
|
| Geography and Growth Outlook | Country movement differs due to regulatory access and specialist-center concentration. Commercial progress reflects local engineering support and clinical training capacity.
|
| Competitive View | Competition focuses on clinical range and dependable integration across spine and cranial workflows. Commercial progress favors companies providing regulatory support and responsive technical service.
|
| Analyst Perspective | Neurosurgery and spine robots are becoming workflow platforms for precision-dependent procedures. Vendor progress is improving based on broader indications and evidence-led hospital evaluation.
|
Source: Future Market Insights analysis, 2026.
How is neurosurgery & spine robots market segmented?
The neurosurgery & spine robots sector is segmented by application, technology, component, end user, business model, and region.
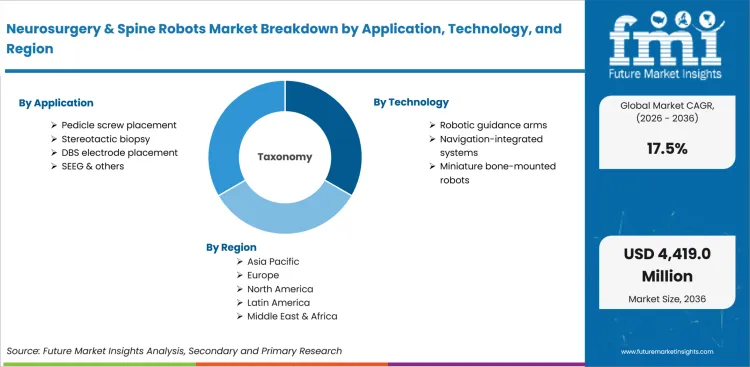
The neurosurgery & spine robots market is segmented by application and technology and component and end user and business model and region. Application coverage includes pedicle screw placement and stereotactic biopsy within spine and cranial surgical programs. Coverage extends to DBS electrode placement and SEEG and other uses involving planned cranial trajectories. Technology coverage includes robotic guidance arms and navigation-integrated systems serving different operating-room configurations throughout hospital settings. Miniature bone-mounted robots complete technology coverage through compact designs intended for selected complex spine procedures.
Component coverage includes systems and instruments with accessories and services supporting continuing clinical platform use. End users include academic medical centers and neuro specialty hospitals and general hospitals throughout care networks. Business models include capital purchase and per-procedure pricing and lease and placement programs for varied utilization needs. Regional coverage includes USA and EU and China and India and Japan and Rest of World within supplied scope.
Why does pedicle screw placement lead application selection?
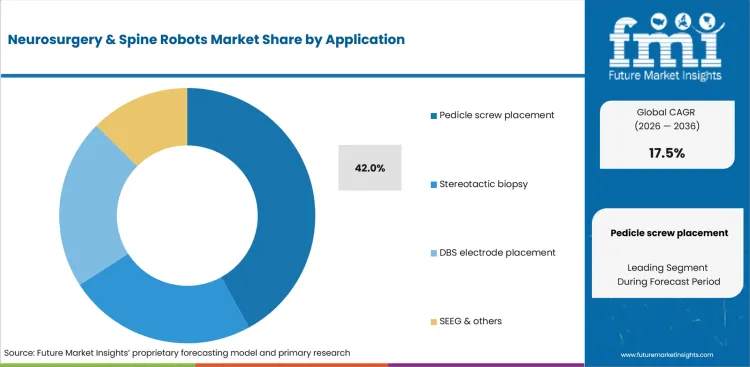
Dominguez and colleagues reported in November 2025 recording 99% Grade A placement among 590 evaluated screws, reflecting robotic guidance during thoracolumbar fusion procedures requiring accurate trajectories. Standardized planning helps surgeons align implants for deformity and multilevel cases based on repeatable image-based guidance. Stereotactic biopsy and DBS electrode placement require cranial registration suited to stereotactic surgery devices and specialist clinical teams.
- Pedicle screw placement is set to represent 42.0% share of application in 2026, backed by repeatable trajectories during spinal fusion procedures. Spine teams assess registration stability and implant planning throughout complete procedural stages to preserve placement accuracy.
- Stereotactic biopsy and DBS electrode placement address cranial targeting during tissue sampling and movement-disorder treatment programs. SEEG and other uses support electrode trajectories for epilepsy evaluation and selected functional neurosurgery procedures.
How do robotic guidance arms influence technology demand?
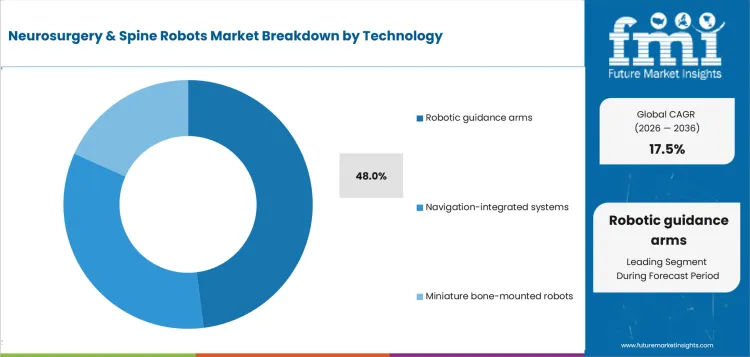
Navigation-integrated systems combine imaging and trajectory feedback within medical robot deployments throughout specialist hospital operating rooms. Lee and colleagues reported in March 2024 identifying 3 current robotic control architectures, clarifying design differences among supervised and remote and shared-control platforms. Robotic guidance arms align instruments to planned trajectories due to tracked movement during complex spinal procedures.
- Robotic guidance arms are anticipated to secure 48.0% share in 2026, led by planned trajectory alignment during pedicle screw procedures. Hospital teams compare arm rigidity and registration stability and imaging compatibility during detailed technology review.
- Navigation-integrated systems consolidate image review and instrument tracking within connected procedural workflows for surgical teams. Miniature bone-mounted robots provide compact assistance for selected spine procedures requiring a limited operating-room footprint.
Why do systems account for component leadership?
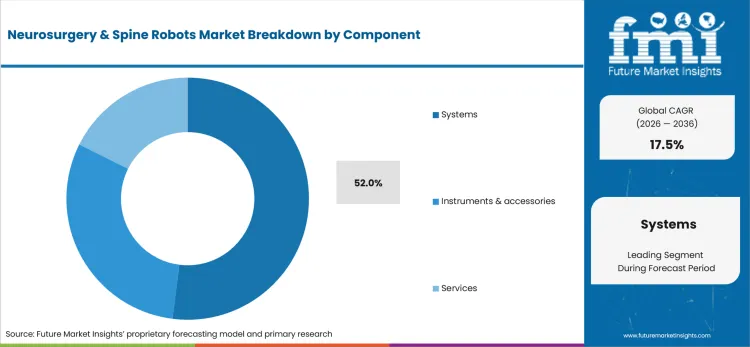
Kanhangad and colleagues reported in October 2024 evaluating 1,225 robot-assisted screws, illustrating repeated procedural load handled by complete robotic systems. System value includes arm mechanics and controls and planning interfaces supporting coordinated surgical guidance workflows. Instruments and accessories connect planned trajectories with surgical execution during demanding complex spinal fusion procedures.
- Based on component, systems are forecast to capture 52.0% share in 2026 since complete platforms concentrate robotic hardware and software and tracking controls. Buyers compare clinical range and service readiness and imaging compatibility during detailed institutional system selection.
- Instruments and accessories support drilling and implant delivery throughout assigned procedural workflows within specialist surgery programs. Services support installation and training and maintenance required for dependable equipment availability during scheduled cases.
Why do academic medical centers lead end-user demand?
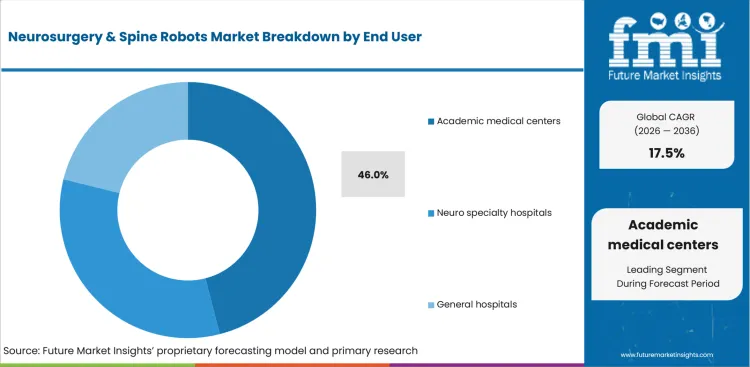
Brain Navi reported in January 2024 completion of 100 NaoTrac clinical cases at An-Nan National Hospital, demonstrating concentrated case experience within specialist institutions. Academic medical centers combine surgery and training and clinical evaluation depending on multidisciplinary specialist hospital programs. Neuro specialty hospitals extend focused adoption for biopsy and electrode placement and deep brain stimulator programs worldwide.
- In 2026, academic medical centers are projected to hold 46.0% share in 2026 as it is supported by specialist surgeons and clinical research infrastructure and multidisciplinary case review. Evaluation programs compare accuracy and workflow effects during complex spine and cranial procedures under clinical use.
- Neuro specialty hospitals focus on cranial targeting and complex spine care through dedicated clinical teams and specialized equipment. General hospitals require dependable service and clear utilization pathways supporting detailed institutional capital review processes.
How does capital purchase retain business model strength?
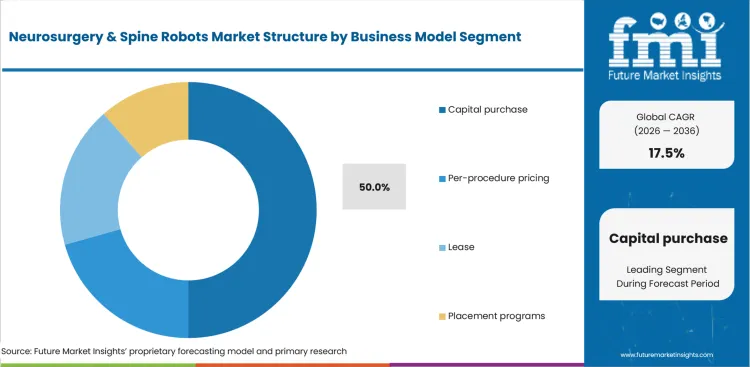
Per-procedure pricing and placement programs may extend access to medical automation without full permanent institutional ownership. AIIMS Bhopal listed 1 spine robotic system in July 2024, highlighting institution-led ownership led by formal equipment tendering. Capital purchase supports internal scheduling and asset control throughout several specialist hospital service lines globally.
- By business model, capital purchase is estimated to hold 50.0% share in 2026 owing to hospital control over scheduling and maintenance planning. Institutions connect ownership with trained users and documented equipment readiness for scheduled specialist surgery programs.
- Per-procedure pricing distributes platform cost among completed cases and expected utilization within defined clinical programs. Lease and placement programs offer staged access for hospitals assessing procedural demand and operational readiness.
What are drivers, restraints, and opportunities in neurosurgery & spine robots market?
Accuracy evidence and multi-indication utilization promote neurosurgery and spine robotics evaluation within specialist surgical programs. Capital intensity and workflow complexity may delay general-hospital adoption among institutions with limited procedural volume.
- Driver: Spine teams seek consistent trajectory guidance during complex fusion and deformity procedures involving difficult anatomy. Cranial programs value accurate alignment for biopsy and electrode placement through planned stereotactic guidance workflows.
- Restraint: Registration errors may disrupt planned trajectories during mobile or unstable anatomy within complex procedures. Training demands may delay dependable use among smaller clinical teams lacking extensive prior robotic experience.
- Opportunity: Modular platforms may connect spine and cranial applications through shared imaging infrastructure between hospital departments. Flexible service models are expected to expand access among mid-sized hospitals with selective clinical utilization.
Hospitals are estimated to be the main drivers for the sector by helping to connect clinical accuracy with revision avoidance and radiation management during complex spinal procedures. Guan and colleagues reported in July 2024 robotic assistance produced 74% fewer proximal facet violations during pooled TLIF analysis, highlighting precision-centered platform evaluation.
Technical faults may interrupt planned guidance despite accurate preoperative planning during complex spine surgery procedures. Clinical teams are likely to require registration checks and fallback protocols during every scheduled procedure. Wandvik and colleagues reported in December 2024 identifying 20 screw-related events within an initial 100-case series, reinforcing structured validation requirements.
Cranial indications are projected to extend utilization beyond spine-dominant programs within specialist hospital institutions worldwide. Shared platforms may support DBS and biopsy and SEEG through dedicated software and compatible instruments. Perera and colleagues reported in August 2025 a 1.01 mm robotic radial error during DBS electrode placement, influencing accurate stereotactic expansion.
How are country CAGRs aligned in neurosurgery & spine robots market?
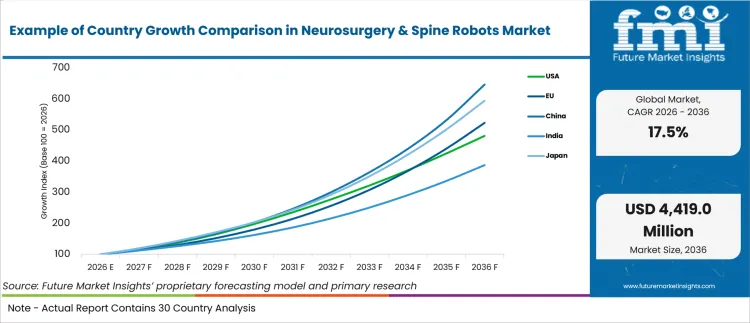
| Country | CAGR |
|---|---|
| China | 20.5% |
| Japan | 19.5% |
| European Union | 18.0% |
| United States | 17.0% |
| India | 14.5% |
Source: Future Market Insights analysis, 2026.
How do country-level CAGRs compare in neurosurgery & spine robots market?
The country comparison shows a gradual step-down in growth across the markets covered. China and Japan sit at the upper end of the range, followed by the European Union and the United States. India remains at the lower end of the comparison. The six-point spread shows that these markets share a strong growth outlook, although their relative positions indicate different levels of market momentum. European Union figure represents a regional average, so individual member countries may record higher or lower growth.
- China and Japan lead the comparison and establish East Asia as the notable growth cluster among the markets shown.
- European Union and United States follow, although both markets maintain measurable gaps from the leading group.
- India records the slowest growth among the listed markets, yet its forecast remains strong within the wider market context.
- Difference between the leading and middle markets remains moderate compared with India’s lower forecast position.
- Pattern resembles a gradual downward slope rather than a sharp separation between high-growth and low-growth markets.
Markets with broadly similar CAGRs can still present different entry conditions due to specialist-center capacity and regulatory access. The full report provides country-level analysis across North America, Latin America, Europe, East Asia, South Asia, Oceania and the Middle East and Africa.
Country-wise Analysis
- Neurosurgery and spine robots industry in China are anticipated to rise at 20.5% CAGR between 2026 and 2036, backed by domestic manufacturing and expanding specialist capacity. Local servicing helps hospitals evaluate compact and integrated platforms beyond major metropolitan academic centers throughout provincial care networks. National Bureau of Statistics of China reported in January 2025 a population of 220.23 million aged 65 years or older during 2024, increasing potential need for degenerative spine care.
- Concentrated surgical programs permit focused training and rapid diffusion among high-volume specialist institutions throughout Japan. Sales in Japan are projected to expand at 19.5% CAGR through 2036, aided by established robotics experience and structured device review. Statistics Bureau of Japan reported in 2025 an aged population of 36.24 million during 2024, attracting attention toward complex spine care among specialist centers.
- Public hospital systems assess incremental additions connecting robotic alignment with existing imaging equipment among member countries. Eurostat reported in February 2026 an estimated 22.0% of European Union residents aged 65 years or older in 2025, sustaining demand for age-linked spine treatment. The market in European Union is estimated to record 18.0% CAGR from 2026 to 2036, guided by modular navigation infrastructure and cross-border clinical training.
- Sector in the United States is forecast to grow at 17.0% CAGR by 2036, helped by integrated robotics portfolios and specialist training networks. Domestic vendor access supports product evaluation through academic centers and ambulatory programs within numerous states. United States Census Bureau reported in June 2025 a population of 61.2 million aged 65 years or older during 2024, expanding a major patient base for degenerative spine procedures.
- Major institutes provide demonstration sites for trained teams and detailed equipment evaluation throughout government hospital networks. Industry in India is predicted to scale at 14.5% CAGR during forecast period, influenced by selective capital allocation among government and private hospitals. Press Information Bureau projected in October 2025 about 230 million senior citizens by 2036, indicating expanding need for age-related surgical capacity.
Who are notable companies in neurosurgery & spine robots market?
Medtronic plc supports integrated spine and cranial guidance through Mazor and Stealth AXiS platforms within hospital programs. Globus Medical, Inc. adds ExcelsiusGPS navigation for pedicle screw planning during complex spinal procedures. Zimmer Biomet Holdings, Inc. and Brainlab SE serve cranial and spine applications led by robotic alignment and navigation. Renishaw plc and Brain Navi Biotechnology Co., Ltd. focus on stereotactic neurosurgery involving biopsy and electrode placement.
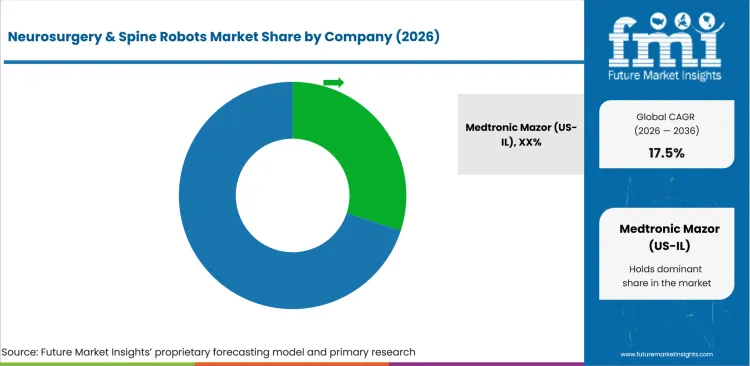
Clinical range and imaging integration and service readiness are likely to drive the competition in neurosurgery and spine robots sector. Medtronic plc is estimated to contribute based on Mazor-based robotics and Stealth AXiS development for clinical applications. Globus Medical, Inc. is expected to compete led by ExcelsiusGPS and connected spine technologies serving complex fusion programs. Zimmer Biomet Holdings, Inc. is projected to support biopsy and DBS and SEEG through ROSA ONE Brain installations.
Brainlab SE is likely to add modular robotic alignment during spine and cranial procedures within navigation-equipped hospitals. Renishaw plc and Brain Navi Biotechnology Co., Ltd. are estimated to serve stereotactic applications through neuromate and NaoTrac systems. eCential Robotics and CUREXO Inc. are anticipated to compete through open and regionally distributed spine platforms for new hospital programs. TINAVI Medical Technologies Co., Ltd. and Sino-European MicroRobotics (Shanghai) Co., Ltd. (SEMR) are projected to support Asian hospital access through domestic engineering and service networks.
- Medtronic plc and Globus Medical, Inc. are expected to receive attention due to integrated spine portfolios and established navigation infrastructure. Hospital teams are likely to assess imaging compatibility and implant workflows during planned fusion procedures.
- Zimmer Biomet Holdings, Inc. and Brainlab SE are anticipated to compete depending on cranial targeting and modular spine alignment. Academic programs are projected to compare application range and registration workflow among specialist clinical teams.
- Renishaw plc and Brain Navi Biotechnology Co., Ltd. are forecast to support DBS and SEEG and biopsy applications. Specialist centers are expected to examine stereotactic accuracy and staff training during planned cranial procedures.
- eCential Robotics and CUREXO Inc. are likely to support open-platform and regional spine programs within hospital networks. Local service access is anticipated to influence installation and continuing equipment readiness during scheduled cases.
Competitive Benchmarking: Neurosurgery & Spine Robots Market
| Company | Portfolio Depth | Spine Match | Cranial Match | Service Reach |
|---|---|---|---|---|
| Medtronic plc | High | High | High | Ireland, United States, and global |
| Globus Medical, Inc. | High | High | Medium | United States and global |
| Zimmer Biomet Holdings, Inc. | High | High | High | United States and global |
| Brainlab SE | High | High | High | Germany and global |
| Renishaw plc | Medium | Low | High | United Kingdom and global |
| eCential Robotics | Medium | High | Low | France, United States, and Europe |
| Brain Navi Biotechnology Co., Ltd. | Medium | Low | High | Taiwan, Asia, Europe, and United States |
| CUREXO Inc. | Medium | High | Low | South Korea and international markets |
| TINAVI Medical Technologies Co., Ltd. | Medium | High | Medium | China and selected international markets |
| Sino-European MicroRobotics (Shanghai) Co., Ltd. (SEMR) | Medium | High | Low | China and Europe |
Source: Future Market Insights competitive analysis, 2026.
Key Developments in Neurosurgery & Spine Robots Market
- In March 2025, eCential Robotics received United States FDA 510(k) clearance for Op.n GEN 1. Company reporting linked clearance with simplified third-party implant integration and added modularity for spine applications.
- In June 2025, Brain Navi received United States FDA 510(k) clearance for NaoTrac as a stereotaxic guiding surgical device. Company reporting connected approval with United States access for robotic neurosurgical trajectory guidance within specialist centers.
- In May 2026, CUREXO received Mexican medical-device approval for CUVIS-spine covering robotic spinal surgery applications. Company reporting associated approval with local commercialization and expanded Latin American access for robotic screw guidance.
Key Players in Neurosurgery & Spine Robots Market
Integrated spine and cranial robotics companies
- Medtronic plc
- Globus Medical, Inc.
- Zimmer Biomet Holdings, Inc.
- Brainlab SE
Focused stereotactic and open-platform specialists
- Renishaw plc
- eCential Robotics
- Brain Navi Biotechnology Co., Ltd.
Regional spine robotics manufacturers
- CUREXO Inc.
- TINAVI Medical Technologies Co., Ltd.
- Sino-European MicroRobotics (Shanghai) Co., Ltd. (SEMR)
Neurosurgery & Spine Robots Market Report Scope
| Coverage field | Report scope |
|---|---|
| Market breakdown | Neurosurgery & spine robots market breakdown by application, technology, component, end user, business model, and region |
| Quantitative Units | USD million in 2026 to USD million by 2036 at a CAGR |
| Market Definition | Neurosurgery and spine robots include robotic guidance and navigation-integrated platforms supporting spine and cranial procedures within specialist surgical institutions. |
| Regions Covered | North America, Latin America, Europe, East Asia, South Asia, Oceania, and Middle East and Africa. |
| Countries Covered | United States, China, European Union, Japan, Russia, Canada, Brazil, Mexico, Germany, France, United Kingdom, Italy, Spain, Poland, India, ASEAN, Australia, New Zealand, GCC countries, South Africa and Türkiye |
| Key Companies Profiled | Medtronic plc, Globus Medical, Inc., Zimmer Biomet Holdings, Inc., Brainlab SE, Renishaw plc, eCential Robotics, Brain Navi Biotechnology Co., Ltd., CUREXO Inc., TINAVI Medical Technologies Co., Ltd., and Sino-European MicroRobotics (Shanghai) Co., Ltd. (SEMR). |
| Forecast Period | 2026 to 2036 |
| Approach | Hybrid bottom-up and top-down methodology using segment share and country CAGR and procedure mix and product portfolio depth and clinical evidence and service coverage |
Source: Future Market Insights analysis, 2026.
Neurosurgery & Spine Robots Market - Research Methodology
| Method | Approach |
|---|---|
| Primary Research | FMI analysts gathered input from manufacturers, service providers, technology developers, distributors, end users, procurement teams, and subject-matter experts. Interviews examined purchasing decisions, product or service evaluation, adoption barriers, approval requirements, pricing considerations, and expectations for technical or commercial support. Respondents were also asked what evidence is required before a trial, pilot, or initial order develops into regular purchasing. |
| Desk Research | Desk research covered government statistics, regulatory publications, trade data, industry associations, technical literature, standards, company filings, product information, and official corporate announcements. Sources were reviewed for relevance, publication date, geographic coverage, and consistency with the defined market scope. Claims relating to performance, applications, approvals, capacity, investment, and commercial activity were retained only when supported by credible public evidence. |
| Market Sizing and Forecasting | The market model combined the baseline value with historical performance, segment structure, pricing and volume indicators, adoption levels, company participation, and country-level demand conditions. Forecast assumptions considered economic activity, investment trends, regulatory developments, technology adoption, purchasing cycles, supply availability, and barriers to wider market use. Segment and regional estimates were reconciled before the final market total was calculated. |
| Data Validation | Estimates were checked against multiple independent indicators, including public data, company activity, trade patterns, industry developments, and findings from primary interviews. Validation also tested whether products, services, applications, and company revenues fell within the defined market boundaries. Adjacent categories, unsupported claims, overlapping revenues, and activities without direct market relevance were excluded to reduce double counting and maintain consistency across segments and countries. |
Source: Future Market Insights analysis, 2026.
Neurosurgery & Spine Robots Market by Segments
Neurosurgery & Spine Robots Market segmented by Application:
- Pedicle screw placement
- Stereotactic biopsy
- DBS electrode placement
- SEEG and others
Neurosurgery & Spine Robots Market segmented by Technology:
- Robotic guidance arms
- Navigation-integrated systems
- Miniature bone-mounted robots
Neurosurgery & Spine Robots Market segmented by Component:
- Systems
- Instruments and accessories
- Services
Neurosurgery & Spine Robots Market segmented by End User:
- Academic medical centers
- Neuro specialty hospitals
- General hospitals
Neurosurgery & Spine Robots Market segmented by Business Model:
- Capital purchase
- Per-procedure pricing
- Lease
- Placement programs
Neurosurgery & Spine Robots Market segmented by Region:
- United States
- European Union
- China
- India
- Japan
- Rest of World
Research Sources and Bibliography
- MacLean, L., Hersh, A. M., Bhimreddy, M., Jiang, K., Davidar, A. D., Weber-Levine, C., Alomari, S., Judy, B. F., Lubelski, D., & Theodore, N. (2024). Comparison of accuracy, revision, and perioperative outcomes in robot-assisted spine surgeries: Systematic review and meta-analysis. Journal of Neurosurgery: Spine, 41(4), 519-531.
- Kaewborisutsakul, A., Chernov, M., Yokosako, S., & Kubota, Y. (2024). Usefulness of Robotic Stereotactic Assistance (ROSA®) device for stereoelectroencephalography electrode implantation: A systematic review and meta-analysis. Neurologia Medico-Chirurgica, 64(2), 71-86.
- Dominguez, I., Luque, R., Carrascosa, A., Castaño, J. P., Collado, A., Alonso Lera, P., & Marco, F. (2025). Accuracy of robotic-guided pedicular screw insertion in thoracolumbar spinal surgery. Journal of Clinical Medicine, 14(23), 8425.
- Lee, Y.-S., Cho, D.-C., & Kim, K.-T. (2024). Navigation-guided/robot-assisted spinal surgery: A review article. Neurospine, 21(1), 8-17.
- Kanhangad, M. P., Srinivasa, V., Thirugnanam, B., Soni, A., Kashyap, A., Vidyadhara, A., & Rao, S. K. (2024). Robotic spine systems: Overcoming surgeon experience in pedicle screw accuracy: A prospective study. Asian Spine Journal, 18(5), 663-672.
- Brain Navi Biotechnology Co., Ltd. (2024, January 17). Brain Navi announces 100th surgical procedure completed using NaoTrac.
- All India Institute of Medical Sciences Bhopal. (2024, July 31). Robotic system spine machine for Department of Orthopedics.
- Guan, J., Feng, N., Yu, X., & Yang, K. (2024). Comparison of robot-assisted versus fluoroscopy-guided transforaminal lumbar interbody fusion for lumbar degenerative diseases: A systematic review and meta-analysis of randomized controlled trails and cohort studies. Systematic Reviews, 13, 170.
- Wandvik, C., Greil, M. E., Colby, S., Gautam, D., & Mazur, M. D. (2024). Limitations of current robot-assisted pedicle screw insertion systems. Neurosurgical Focus, 57(6), E14.
- Perera, D., Roldán Ramos, P., Valldeoriola, F., Sánchez-Gómez, A., Ferrés, A., Pérez-Baldioceda, C., Cabrera, G., Mosteiro, A., Gómez, L., Codes, M., Manfrellotti, R., & Rumià, J. (2025). Robotic arm vs. stereotactic frame in deep brain stimulation surgery for movement disorders: A retrospective cohort study. Acta Neurochirurgica, 167, 219.
- National Bureau of Statistics of China. (2025, January 17). National economy witnessed steady progress amidst stability with major development targets achieved successfully in 2024.
- Statistics Bureau of Japan. (2025). Statistical handbook of Japan 2025.
- Eurostat. (2026, February 2). Population structure and ageing.
- United States Census Bureau. (2025, June 26). Older adults outnumber children in 11 states and nearly half of United States counties.
- Press Information Bureau. (2025, October 28). India’s silver dividend: Empowering senior citizens for a brighter future.
- eCential Robotics. (2025, March 14). eCential Robotics receives FDA 510(k) clearance for its next generation of open navigation and robotic platform for spine: Op.n GEN 1.
- Brain Navi Biotechnology Co., Ltd. (2025, June 19). Brain Navi achieves United States FDA approval for neurosurgical robot NaoTrac.
- CUREXO Inc. (2026, May 27). CUVIS-spine surgical robot receives medical device approval in Mexico.
This bibliography is provided for reader reference and is not exhaustive. The full report contains the complete reference list and detailed citations.
This Report Answers
- What segments influence demand across application and technology and component and end user and business model?
- How do hospitals evaluate neurosurgery and spine robots prior to replacing manual guidance routines across specialist procedures?
- How do country CAGRs differ across profiled markets with distinct regulatory and hospital investment conditions?
- What companies compete through spine and cranial portfolio depth and dependable service support across hospital programs?
- How are forecasts validated through a hybrid bottom-up and top-down approach across defined market segments?
- What factors do hospital teams examine prior to program expansion across spine and cranial service lines?
- How do application range and imaging compatibility affect platform selection across specialist surgical institutions?
- What limits return on investment for institutions adding neurosurgery and spine robots across several procedure types?
- How do clinical records and training guidance influence account approval across multidisciplinary hospital review teams?
- What vendor capabilities improve long-term hospital confidence across installation and training and continuing service support?
Frequently Asked Questions
What supports demand in neurosurgery & spine robots market?
Demand is likely to be supported by spine teams seeking accurate trajectory guidance across complex fusion procedures. Cranial programs are expected to favor platforms connecting stereotactic planning with dependable instrument alignment across specialist applications.
Who are key players in neurosurgery & spine robots market?
Key companies are anticipated to include Medtronic plc and Zimmer Biomet Holdings, Inc. among active competitors. Competition is likely to center on clinical range and imaging integration and regional service support across hospital programs.
What restraint affects neurosurgery & spine robots market?
A major restraint involves capital intensity combined with training and registration demands across multidisciplinary clinical teams. Hospitals may delay adoption if procedure utilization and service coverage remain uncertain across proposed installation programs.
Why do executives track neurosurgery & spine robots market?
Executives are expected to track neurosurgery and spine robots as platform choices affect surgical capacity and capital planning. Application range and service readiness influence equipment review across specialist programs and planned procedural expansion.
What business problem does neurosurgery & spine robots market address?
Neurosurgery and spine robots address procedural guidance needs involving precise trajectories and complex anatomy across surgical specialties. Hospitals need platforms supporting repeatable alignment and imaging integration and clinical documentation across scheduled cases.
What do hospital teams evaluate prior to selecting vendors?
Hospital teams are likely to evaluate clinical range and imaging compatibility and repeat-use reliability ahead of vendor approval. Training access and technical documentation are expected to guide final review across multidisciplinary selection committees.
What limits return on investment for purchasing teams?
Return on investment weakens if procedure volume or multi-indication use remains insufficient across installed platforms. Low utilization and interrupted workflows reduce expected operating gains across planned hospital service lines worldwide.
How do vendors build long-term hospital confidence?
Vendors build hospital confidence through consistent product performance and evidence specific to spine and cranial work. Training records and responsive troubleshooting are expected to influence repeat purchasing trust across hospital networks.
Preview the report firsthand - request a free sample
Get SampleGet the brochure for pricing and purchase details.
Get PDFTable of Content
- Key Takeaways
- Market Size and CAGR
- Top Growth Driver
- Fastest Growing Segment
- Leading Region
- Key Companies
- Emerging Opportunities
- Executive Summary
- Global Market Outlook
- Demand-side Trends
- Supply-side Trends
- Technology Roadmap Analysis
- Analysis and Recommendations
- Analyst Perspective (What is happening? Why now? What should investors know?)
- Key Questions Answered
- How large is the market?
- What is the CAGR?
- What are key trends?
- Which region dominates?
- Who are the leaders?
- Market Overview
- Market Coverage / Taxonomy
- Market Definition / Scope / Limitations
- Research Methodology
- Chapter Orientation
- Analytical Lens and Working Hypotheses
- Market Structure, Signals, and Trend Drivers
- Benchmarking and Cross-market Comparability
- Market Sizing, Forecasting, and Opportunity Mapping
- Research Design and Evidence Framework
- Desk Research Programme (Secondary Evidence)
- Expert Input and Fieldwork (Primary Evidence)
- Tooling, Models, and Reference Databases
- Data Engineering and Model Build
- Quality Assurance and Audit Trail
- Market Background
- Market Dynamics (Drivers, Restraints, Opportunity, Trends)
- Scenario Forecast (Optimistic, Likely, Conservative)
- Impact Analysis
- AI Impact
- Sustainability Impact
- Regulatory Impact
- Technology Impact
- Consumer / Buyer Analysis
- Purchase Drivers
- Adoption Barriers
- Buyer Journey
- Opportunity Map Analysis
- Product Life Cycle Analysis
- Supply Chain Analysis
- Investment Feasibility Matrix
- Value Chain Analysis
- PESTLE and Porter's Analysis
- Regulatory Landscape
- Regional Parent Market Outlook
- Production and Consumption Statistics
- Import and Export Statistics
- Global Market Analysis and Forecast, 2021 to 2036
- Historical Market Size Value (USD Mn) Analysis, 2021 to 2025
- Current and Future Market Size Value (USD Mn) Projections, 2026 to 2036
- Y-o-Y Growth Trend Analysis
- Absolute $ Opportunity Analysis
- Global Market Pricing Analysis, 2021 to 2036
- Global Market Analysis and Forecast, By Application, 2021 to 2036
- Introduction / Key Findings
- Historical Market Size Value (USD Mn) Analysis By Application, 2021 to 2025
- Current and Future Market Size Value (USD Mn) Analysis and Forecast By Application, 2026 to 2036
- Pedicle screw placement
- Stereotactic biopsy
- DBS electrode placement
- SEEG & others
- Pedicle screw placement
- Y-o-Y Growth Trend Analysis By Application, 2021 to 2025
- Absolute $ Opportunity Analysis By Application, 2026 to 2036
- Global Market Analysis and Forecast, By Technology, 2021 to 2036
- Introduction / Key Findings
- Historical Market Size Value (USD Mn) Analysis By Technology, 2021 to 2025
- Current and Future Market Size Value (USD Mn) Analysis and Forecast By Technology, 2026 to 2036
- Robotic guidance arms
- Navigation-integrated systems
- Miniature bone-mounted robots
- Robotic guidance arms
- Y-o-Y Growth Trend Analysis By Technology, 2021 to 2025
- Absolute $ Opportunity Analysis By Technology, 2026 to 2036
- Global Market Analysis and Forecast, By Component, 2021 to 2036
- Introduction / Key Findings
- Historical Market Size Value (USD Mn) Analysis By Component, 2021 to 2025
- Current and Future Market Size Value (USD Mn) Analysis and Forecast By Component, 2026 to 2036
- Systems
- Instruments & accessories
- Services
- Systems
- Y-o-Y Growth Trend Analysis By Component, 2021 to 2025
- Absolute $ Opportunity Analysis By Component, 2026 to 2036
- Global Market Analysis and Forecast, By End User, 2021 to 2036
- Introduction / Key Findings
- Historical Market Size Value (USD Mn) Analysis By End User, 2021 to 2025
- Current and Future Market Size Value (USD Mn) Analysis and Forecast By End User, 2026 to 2036
- Academic medical centers
- Neuro specialty hospitals
- General hospitals
- Academic medical centers
- Y-o-Y Growth Trend Analysis By End User, 2021 to 2025
- Absolute $ Opportunity Analysis By End User, 2026 to 2036
- Global Market Analysis and Forecast, By Business Model, 2021 to 2036
- Introduction / Key Findings
- Historical Market Size Value (USD Mn) Analysis By Business Model, 2021 to 2025
- Current and Future Market Size Value (USD Mn) Analysis and Forecast By Business Model, 2026 to 2036
- Capital purchase
- Per-procedure pricing
- Lease
- Placement programs
- Capital purchase
- Y-o-Y Growth Trend Analysis By Business Model, 2021 to 2025
- Absolute $ Opportunity Analysis By Business Model, 2026 to 2036
- Global Market Analysis and Forecast, By Region, 2021 to 2036
- Introduction
- Historical Market Size Value (USD Mn) Analysis By Region, 2021 to 2025
- Current Market Size Value (USD Mn) Analysis and Forecast By Region, 2026 to 2036
- North America
- Latin America
- Western Europe
- Eastern Europe
- East Asia
- South Asia and Pacific
- Middle East & Africa
- Market Attractiveness Analysis By Region
- North America Market Analysis and Forecast, By Country, 2021 to 2036
- Historical Market Size Value (USD Mn) Trend Analysis By Market Taxonomy, 2021 to 2025
- Market Size Value (USD Mn) Forecast By Market Taxonomy, 2026 to 2036
- By Country
- USA
- Canada
- By Application
- By Technology
- By Component
- By End User
- By Business Model
- By Country
- Market Attractiveness Analysis
- By Country
- By Application
- By Technology
- By Component
- By End User
- By Business Model
- Key Takeaways
- Latin America Market Analysis and Forecast, By Country
- Historical Market Size Value (USD Mn) Trend Analysis By Market Taxonomy, 2021 to 2025
- Market Size Value (USD Mn) Forecast By Market Taxonomy, 2026 to 2036
- By Country
- Brazil
- Mexico
- Chile
- Rest of Latin America
- By Application
- By Technology
- By Component
- By End User
- By Business Model
- By Country
- Market Attractiveness Analysis
- By Country
- By Application
- By Technology
- By Component
- By End User
- By Business Model
- Key Takeaways
- Western Europe Market Analysis and Forecast, By Country
- Historical Market Size Value (USD Mn) Trend Analysis By Market Taxonomy, 2021 to 2025
- Market Size Value (USD Mn) Forecast By Market Taxonomy, 2026 to 2036
- By Country
- Germany
- UK
- Italy
- Spain
- France
- Nordic
- BENELUX
- Rest of Western Europe
- By Application
- By Technology
- By Component
- By End User
- By Business Model
- By Country
- Market Attractiveness Analysis
- By Country
- By Application
- By Technology
- By Component
- By End User
- By Business Model
- Key Takeaways
- Eastern Europe Market Analysis and Forecast, By Country
- Historical Market Size Value (USD Mn) Trend Analysis By Market Taxonomy, 2021 to 2025
- Market Size Value (USD Mn) Forecast By Market Taxonomy, 2026 to 2036
- By Country
- Russia
- Poland
- Hungary
- Balkan & Baltic
- Rest of Eastern Europe
- By Application
- By Technology
- By Component
- By End User
- By Business Model
- By Country
- Market Attractiveness Analysis
- By Country
- By Application
- By Technology
- By Component
- By End User
- By Business Model
- Key Takeaways
- East Asia Market Analysis and Forecast, By Country
- Historical Market Size Value (USD Mn) Trend Analysis By Market Taxonomy, 2021 to 2025
- Market Size Value (USD Mn) Forecast By Market Taxonomy, 2026 to 2036
- By Country
- China
- Japan
- South Korea
- By Application
- By Technology
- By Component
- By End User
- By Business Model
- By Country
- Market Attractiveness Analysis
- By Country
- By Application
- By Technology
- By Component
- By End User
- By Business Model
- Key Takeaways
- South Asia and Pacific Market Analysis and Forecast, By Country
- Historical Market Size Value (USD Mn) Trend Analysis By Market Taxonomy, 2021 to 2025
- Market Size Value (USD Mn) Forecast By Market Taxonomy, 2026 to 2036
- By Country
- India
- ASEAN
- Australia & New Zealand
- Rest of South Asia and Pacific
- By Application
- By Technology
- By Component
- By End User
- By Business Model
- By Country
- Market Attractiveness Analysis
- By Country
- By Application
- By Technology
- By Component
- By End User
- By Business Model
- Key Takeaways
- Middle East & Africa Market Analysis and Forecast, By Country
- Historical Market Size Value (USD Mn) Trend Analysis By Market Taxonomy, 2021 to 2025
- Market Size Value (USD Mn) Forecast By Market Taxonomy, 2026 to 2036
- By Country
- Kingdom of Saudi Arabia
- Other GCC Countries
- Türkiye
- South Africa
- Other African Union
- Rest of Middle East & Africa
- By Application
- By Technology
- By Component
- By End User
- By Business Model
- By Country
- Market Attractiveness Analysis
- By Country
- By Application
- By Technology
- By Component
- By End User
- By Business Model
- Key Takeaways
- Key Countries Market Analysis
- USA
- Pricing Analysis
- Market Share Analysis, 2025
- By Application
- By Technology
- By Component
- By End User
- By Business Model
- Canada
- Pricing Analysis
- Market Share Analysis, 2025
- By Application
- By Technology
- By Component
- By End User
- By Business Model
- Mexico
- Pricing Analysis
- Market Share Analysis, 2025
- By Application
- By Technology
- By Component
- By End User
- By Business Model
- Brazil
- Pricing Analysis
- Market Share Analysis, 2025
- By Application
- By Technology
- By Component
- By End User
- By Business Model
- Chile
- Pricing Analysis
- Market Share Analysis, 2025
- By Application
- By Technology
- By Component
- By End User
- By Business Model
- Germany
- Pricing Analysis
- Market Share Analysis, 2025
- By Application
- By Technology
- By Component
- By End User
- By Business Model
- UK
- Pricing Analysis
- Market Share Analysis, 2025
- By Application
- By Technology
- By Component
- By End User
- By Business Model
- Italy
- Pricing Analysis
- Market Share Analysis, 2025
- By Application
- By Technology
- By Component
- By End User
- By Business Model
- Spain
- Pricing Analysis
- Market Share Analysis, 2025
- By Application
- By Technology
- By Component
- By End User
- By Business Model
- France
- Pricing Analysis
- Market Share Analysis, 2025
- By Application
- By Technology
- By Component
- By End User
- By Business Model
- India
- Pricing Analysis
- Market Share Analysis, 2025
- By Application
- By Technology
- By Component
- By End User
- By Business Model
- ASEAN
- Pricing Analysis
- Market Share Analysis, 2025
- By Application
- By Technology
- By Component
- By End User
- By Business Model
- Australia & New Zealand
- Pricing Analysis
- Market Share Analysis, 2025
- By Application
- By Technology
- By Component
- By End User
- By Business Model
- China
- Pricing Analysis
- Market Share Analysis, 2025
- By Application
- By Technology
- By Component
- By End User
- By Business Model
- Japan
- Pricing Analysis
- Market Share Analysis, 2025
- By Application
- By Technology
- By Component
- By End User
- By Business Model
- South Korea
- Pricing Analysis
- Market Share Analysis, 2025
- By Application
- By Technology
- By Component
- By End User
- By Business Model
- Russia
- Pricing Analysis
- Market Share Analysis, 2025
- By Application
- By Technology
- By Component
- By End User
- By Business Model
- Poland
- Pricing Analysis
- Market Share Analysis, 2025
- By Application
- By Technology
- By Component
- By End User
- By Business Model
- Hungary
- Pricing Analysis
- Market Share Analysis, 2025
- By Application
- By Technology
- By Component
- By End User
- By Business Model
- Kingdom of Saudi Arabia
- Pricing Analysis
- Market Share Analysis, 2025
- By Application
- By Technology
- By Component
- By End User
- By Business Model
- Türkiye
- Pricing Analysis
- Market Share Analysis, 2025
- By Application
- By Technology
- By Component
- By End User
- By Business Model
- South Africa
- Pricing Analysis
- Market Share Analysis, 2025
- By Application
- By Technology
- By Component
- By End User
- By Business Model
- USA
- Market Structure Analysis
- Competition Dashboard
- Competition Benchmarking
- Market Share Analysis of Top Players
- By Regional
- By Application
- By Technology
- By Component
- By End User
- By Business Model
- Emerging Startups
- Innovation Benchmarking
- Competition Analysis
- Competition Deep Dive
- Medtronic Mazor (US-IL)
- Overview
- Product Portfolio
- Profitability by Market Segments
- Sales Footprint
- Strategy Overview
- Marketing Strategy
- Product Strategy
- Channel Strategy
- Globus Excelsius (US)
- Brainlab (DE)
- Renishaw Neuromate (UK)
- Medtronic Mazor (US-IL)
- Case Studies
- Success Stories
- Recent Developments
- Competition Deep Dive
- Assumptions & Acronyms Used


