Obesity GLP-1 Market Forecast and Outlook 2025 to 2035

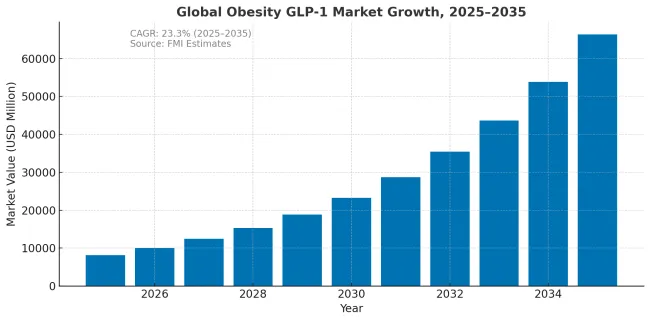
The obesity GLP-1 market is projected to grow from USD 8169 million in 2025 to approximately USD 65,364 million by 2035, recording an absolute increase of USD 57,195 million over the forecast period. This translates into a total growth of 700%, with the market forecast to expand at a compound annual growth rate (CAGR) of 23.1% between 2025 and 2035. The overall market size is expected to grow by 8X during the same period, supported by expanding treatment eligibility, increasing public reimbursement coverage, and growing clinical evidence for cardiovascular risk reduction benefits.
Obesity Glp 1 Market

Quick Stats for Obesity GLP-1 Market

  • Obesity GLP-1 Market Value (2025): USD 8,169 million
  • Obesity GLP-1 Market Forecast Value (2035): USD 65,364 million
  • Obesity GLP-1 Market Forecast CAGR: 23.1%
  • Leading Molecule Class in Obesity GLP-1 Market: Semaglutide (58.0%)
  • Key Growth Regions in Obesity GLP-1 Market: North America, Europe, and East Asia
  • Top Key Players in Obesity GLP-1 Market: Novo Nordisk, Eli Lilly, and emerging manufacturers

Obesity Glp 1 Market 2

Metric Value
Industry Size (2025E) USD 8,169 million
Industry Value (2035F) USD 65,364 million
CAGR (2025 to 2035) 23.1%

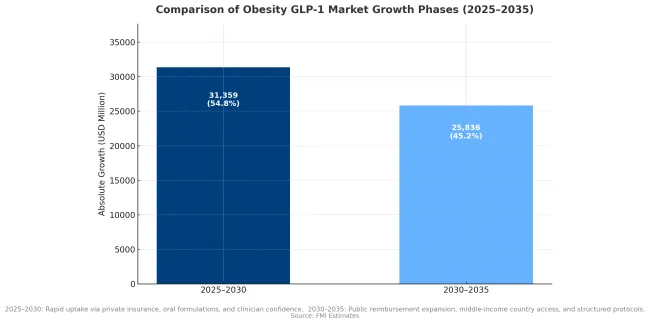
Between 2025 and 2030, the obesity GLP-1 market is projected to expand from USD 8169.0 million to USD 39,528 million, resulting in a value increase of USD 31359.0 million, which represents 54.8% of the total forecast growth for the decade. This phase of growth will be shaped by rapid expansion in treatment access through private insurance and self-pay channels, increasing clinical adoption for cardiovascular risk reduction, and growing physician confidence in long-term safety profiles. The introduction of oral formulations and improved supply capacity are expected to accelerate market penetration across major developed markets.

From 2030 to 2035, the market is forecast to grow from USD 39,528 million to USD 65,364 million, adding another USD 25836.0 million, which constitutes 45.2% of the overall ten-year expansion. This period is expected to be characterized by expansion of public reimbursement programs in major European and Asian markets, maturation of cardiovascular-anchored treatment protocols, and broader adoption across middle-income countries. The growing recognition of obesity as a chronic disease requiring sustained intervention will drive demand for structured treatment pathways and outcomes-based reimbursement arrangements.

Why the Obesity GLP-1 Market is Growing?

Market expansion is being supported by the growing recognition of obesity as a chronic disease requiring pharmacological intervention and the compelling clinical evidence demonstrating substantial cardiovascular risk reduction in treated populations. Modern GLP-1 receptor agonists have demonstrated average weight loss of 15-20% of body weight with sustained treatment, representing a breakthrough in obesity pharmacotherapy that approaches the effectiveness of bariatric surgery. The SELECT cardiovascular outcomes trial established that semaglutide reduces major adverse cardiovascular events by 20%, providing a strong clinical rationale for treatment that extends beyond weight management alone.

The expanding treatment eligibility criteria and increasing willingness of payers to cover GLP-1 medications are driving accelerated market growth. Public health systems in developed markets are establishing structured access pathways based on BMI thresholds combined with cardiovascular or metabolic comorbidities. The availability of oral formulations addresses patient preferences for non-injectable medications while the entry of additional manufacturers beyond the current duopoly is expected to improve supply availability and create pricing competition that will facilitate broader access.
Obesity Glp 1 Market Obesity Trends

Why Obesity Prevalence Alone is not an Accurate Driver for GLP-1 Sales

Perspective Analytical Insight
Addressable vs Total Population Only a subset of the 2.5 billion overweight adults meet medical criteria for GLP-1 therapy. Most people with obesity now live in low- and middle-income countries (LMICs), where adoption will be slower due to affordability, access, and policy barriers. Prevalence ≠ near-term demand.
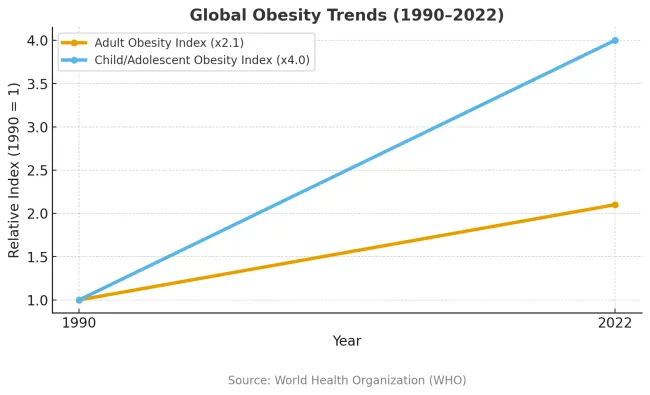
Pediatric Dynamics Obesity among children aged 5-19 has quadrupled since 1990, but GLP-1 use in youth is restricted under tight regulatory and ethical controls. These demographics shape future potential, not immediate sales.
Measurement Limitations (BMI) BMI remains the global surveillance standard but misclassifies individuals at both ends of the health spectrum. For commercial targeting, prevalence data must be adjusted for comorbidities, payer criteria, and reimbursement frameworks the true gating factors for GLP-1 adoption.
Geographic Paradox The Americas record the highest obesity rates, yet policy coverage and payer willingness drive uptake more than raw prevalence. Pacific Island nations show extreme obesity rates but contribute little to volume due to small populations.

Segmental Analysis

The market is segmented by molecule class, route of administration, payer type, use-case framing, and region. By molecule class, the market is divided into semaglutide, tirzepatide, and other molecules. Based on route of administration, the market is categorized into injectables and oral formulations. In terms of payer type, the market is segmented into public coverage and private or self-pay arrangements. By use-case framing, the market is classified into weight management and cardiovascular risk anchored indications. Regionally, the market is divided into North America, Europe, East Asia, South Asia and Pacific, Latin America, and Middle East and Africa.
By Molecule Class, Semaglutide Leads Today but Cedes Leadership by 2035

Obesity Glp 1 Market By Molecule Class

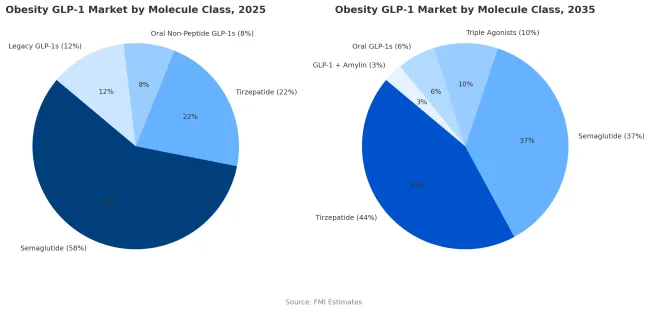
Semaglutide holds a commanding 58% share of the obesity GLP-1 market in 2025, underpinned by robust clinical validation from the STEPandSELECT trials, proven cardiovascular benefits, and extensive real-world use. Its first-mover advantage, combined with strong reimbursement coverage in major developed markets, has made it the reference molecule for obesity pharmacotherapy. The drug delivers a mean weight loss of around 15% with consistent tolerability, supporting long-term adherence and prescriber confidence. Broad familiarity among endocrinologists and primary care physicians carried over from type 2 diabetes care continues to reinforce its clinical dominance. The availability of both weekly injectable and daily oral formulations further broadens its reach across diverse patient and prescriber segments.

However, semaglutide’s share is projected to decline to 37% by 2035, as tirzepatide emerges as the new market leader. Tirzepatide’s dual GIP/GLP-1 mechanism has demonstrated superior weight-loss efficacy in both clinical trials and real-world studies, enabling stronger payer uptake and prescriber preference. Its growing cardiovascular-outcomes evidence, combined with expanding reimbursement and manufacturing capacity, positions it to capture an estimated 44% share of global obesity GLP-1 sales by 2035.

Beyond these two front-runners, next-generation molecules including triple agonists (GLP-1/GIP/glucagon) and GLP-1 + amylin combination therapiesare expected to gain low-to-mid-teens market share in the early 2030s as manufacturing and cardiovascular data mature. While semaglutide will remain a foundational therapy in the class, the market’s center of gravity is shifting toward multi-agonist and combination-based innovations that deliver higher efficacy with comparable safety and durability.
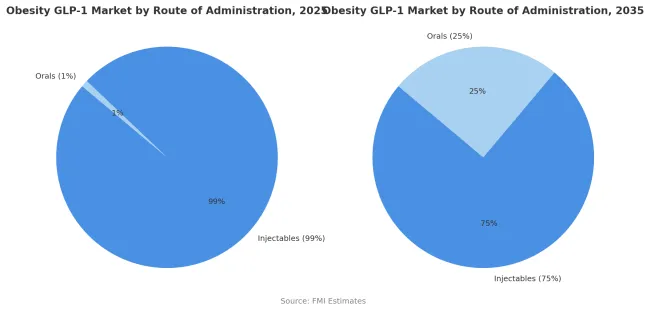
By Route of Administration, Injectables Remain the Backbone Through 2035

Obesity Glp 1 Market By Route Of Administration

Injectable formulations account for nearly 99% of obesity GLP-1 therapy use in 2025, reflecting their status as the established delivery route for both semaglutide and tirzepatide. Weekly subcutaneous injections currently offer the most reliable pharmacokinetics, bioavailability, and efficacy, producing consistent weight-loss outcomes and strong cardiovascular benefits. The segment’s dominance is reinforced by mature patient education systems, easy-to-use pen devices, and broad prescriber familiarity built over years of diabetes-care experience.

While patient preference is clearly shifting toward non-injectable options, injectables are projected to retain a 75% market share by 2035, not the minority. The continued strength of this route stems from its superior efficacy, durable outcomes, and expanding reimbursement for high-performing injectable therapies. Oral formulations will grow to capture 25% share as bioavailability improves and new small-molecule GLP-1s reach the market, appealing to segments seeking greater convenience or avoiding injection-site issues.

The transition toward oral delivery will be evolutionary, not disruptive, dependent on regulatory approvals, proven equivalence in cardiovascular outcomes, and competitive pricing. In the long term, injectables are expected to coexist with orals, with each addressing distinct patient and payer priorities rather than one displacing the other.
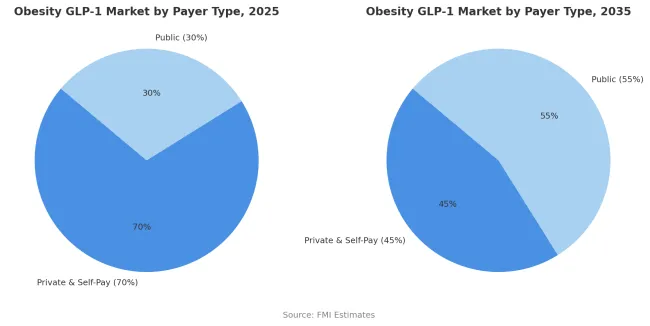
By Payer Type, Private and Self-Pay Segment Accounts for 70% Market Share

Obesity Glp 1 Market By Payer Type

Private insurance and self-pay arrangements are projected to contribute 70% of the market in 2025, representing patients who access treatment through commercial health insurance or direct cash payment. These payers demonstrate greater flexibility in coverage decisions and faster adoption of new obesity pharmacotherapy compared to public health systems with formal health technology assessment requirements. Private insurance plans in the United States and employer-sponsored health benefits increasingly include GLP-1 medications in formularies, though often with prior authorization requirements and step therapy protocols.

The self-pay segment includes patients willing to bear substantial out-of-pocket costs averaging USD 1000 per month to access treatment not covered by their insurance plans. The segment is supported by growing consumer awareness of GLP-1 medications through social media and direct-to-consumer marketing that has created strong patient demand. However, the private and self-pay share is projected to decline to 45% by 2035 as public health systems expand coverage. This transition will be driven by accumulating health economic evidence demonstrating cost-effectiveness through reduced cardiovascular events and progression of metabolic disease, leading to structured public reimbursement programs in Europe, Japan, and middle-income countries.
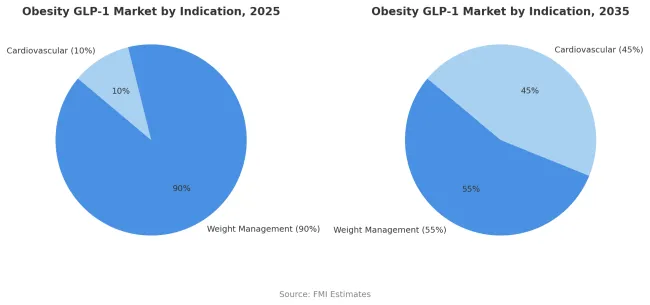
By Use-Case Framing, Weight Management Segment Accounts for 90% Market Share

Obesity Glp 1 Market By Use Case Framing

Weight management indications are estimated to hold 90% of the market share in 2025. This dominance reflects the current treatment paradigm where GLP-1 medications are primarily positioned and reimbursed for obesity management based on BMI criteria rather than cardiovascular risk reduction. Regulatory approvals have focused on weight loss efficacy as the primary endpoint with cardiovascular benefits considered secondary outcomes. Prescribers and patients approach treatment with weight reduction as the primary goal while cardiovascular benefits are viewed as additional advantages rather than primary treatment rationales.

Insurance coverage decisions typically require demonstration of obesity through BMI thresholds with or without metabolic comorbidities but do not specifically require established cardiovascular disease. However, this paradigm is shifting as health systems recognize the substantial cardiovascular benefits demonstrated in dedicated outcomes trials. The weight management share is projected to decline to 55% by 2035 as cardiovascular risk anchored indications grow to 45% of the market. This evolution will be driven by expanded clinical evidence, development of cardiovascular-specific treatment protocols, and modification of reimbursement criteria to include primary prevention of cardiovascular events in high-risk populations regardless of weight loss magnitude.
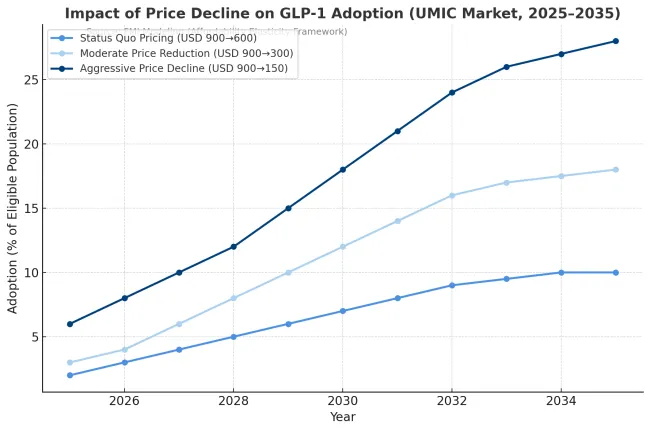
Opportunities for Manufacturers in UMIC: How Price Reduction Can Drive Adoption

Obesity Glp 1 Market Price Decline

Source: UMIC countries as per World Bank definition

In price-sensitive markets, affordability not awareness is the dominant adoption gate for GLP-1 obesity therapies. Where public coverage is limited and self-pay remains the main route, adoption follows a clear S-curve tied to the affordability ratio (AR) the share of a consumer’s disposable income required for one month of therapy. Once the AR falls below roughly 12% in upper-middle-income countries and 8% in lower-middle-income countries, adoption accelerates sharply. Above these thresholds, uptake stays confined to high-income percentiles despite strong demand signals. Current pricing levels (~USD 900/month) keep adoption in single digits, but every halving of net price can nearly double penetration, provided supply and prescriber infrastructure are stable.

Over the forecast period, price declines and payer diversification will reshape adoption curves more than marketing or awareness efforts. If net monthly costs fall to USD 300 or lower through local fill-finish operations, biosimilar competition, or dose optimization, adoption could reach 25-30% of eligible patients in upper-middle-income markets by 2035, versus <10% under status-quo pricing. In contrast, price-driven adoption in lower-middle-income countries remains capped near 15% unless public reimbursement expands. The underlying red pill: price elasticity alone cannot deliver scale it must coincide with supply reliability, clinician coverage, and payer-side incentives. Markets that treat affordability thresholds as strategic levers, not afterthoughts, will own the volume growth phase of global GLP-1 adoption.
Analysis of Obesity GLP-1 Market by Key Country

Obesity Glp 1 Market By Country

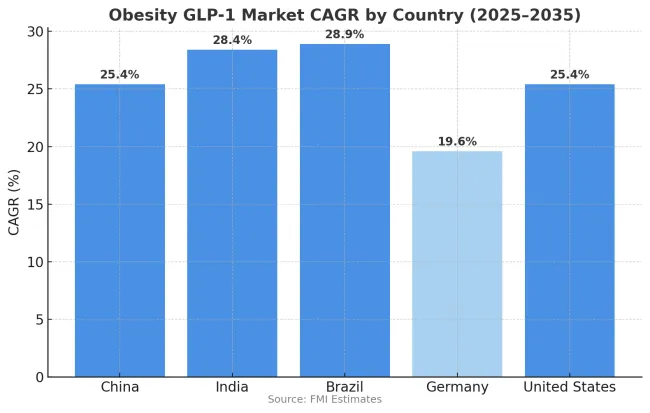
The obesity GLP-1 market is growing rapidly across major economies, with China and the United States both recording 25.4% CAGR through 2035, driven by large treatment-eligible populations and expanding access frameworks. India demonstrates the highest growth at 28.4%, supported by rising obesity prevalence in urban populations and increasing availability of treatment through private healthcare channels. Brazil records 28.9% growth, reflecting rapid expansion of private insurance coverage and growing physician adoption of obesity pharmacotherapy.

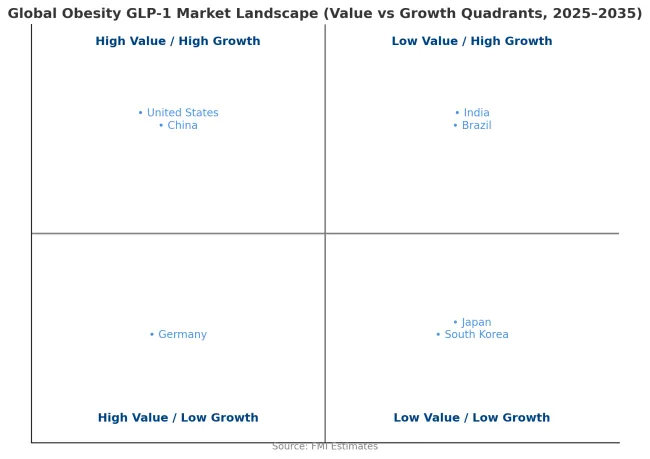
Germany shows more moderate growth at 19.6%, reflecting the statutory health insurance exclusion of anti-obesity medications that limits public reimbursement. Overall, middle-income markets in Asia and Latin America are emerging as key drivers of global market expansion as treatment access improves and physician familiarity with GLP-1 medications increases.
China Leads Market Growth with Rapid Treatment Adoption

Obesity Glp 1 Market Landscape

Revenue from obesity GLP-1 treatment in China is projected to exhibit strong growth with a CAGR of 25.4% through 2035, driven by rapidly increasing obesity rates in urban populations and growing consumer demand for weight management solutions. The country's expanding middle class demonstrates willingness to pay for effective obesity treatment through private healthcare channels and international prescription services. Major pharmaceutical manufacturers are establishing local production capacity and distribution networks to improve treatment access and reduce costs. The growing recognition of obesity as a major public health challenge is driving government consideration of structured treatment programs and potential reimbursement frameworks for effective pharmacotherapy.

  • Urban population growth and dietary shifts are increasing obesity prevalence rates, creating expanding demand for medical weight management interventions.
  • Private healthcare expansion and international pharmacy channels are improving treatment accessibility despite limited public reimbursement coverage.
  • Pharmaceutical industry development and local manufacturing capabilities are supporting improved supply availability and competitive pricing structures.
  • Medical community engagement and professional education programs are building physician confidence in prescribing GLP-1 medications for obesity management.

India Demonstrates Strong Market Potential with Rising Obesity Prevalence

Revenue from obesity GLP-1 treatment in India is expanding at a CAGR of 28.4%, supported by increasing obesity rates in metropolitan areas and growing awareness of cardiovascular risk factors. The country's expanding private healthcare sector demonstrates willingness to adopt new obesity pharmacotherapy despite high treatment costs. Endocrinologists and cardiologists in major cities are gaining experience with GLP-1 medications through diabetes management applications, facilitating confidence in prescribing for obesity indications. The development of patient assistance programs and structured payment options is improving treatment affordability for middle-income populations.

  • Metropolitan population health trends show rising obesity prevalence correlated with lifestyle changes and increased cardiovascular disease risk.
  • Private hospital networks and specialty clinics are establishing structured weight management programs incorporating pharmacotherapy alongside lifestyle interventions.
  • Medical community development through continued education programs supports growing physician comfort with obesity pharmacotherapy prescribing.
  • Patient awareness campaigns and digital health platforms are increasing treatment-seeking behavior among urban populations with obesity concerns.

Brazil Maintains Rapid Growth with Healthcare Market Development

Revenue from obesity GLP-1 treatment in Brazil is growing at a CAGR of 28.9%, driven by expanding private health insurance coverage and increasing physician adoption of obesity pharmacotherapy. The country's established pharmaceutical distribution infrastructure facilitates treatment access in major metropolitan areas. Private healthcare providers are developing comprehensive weight management programs that integrate GLP-1 medications with nutritional counseling and behavioral support. Growing consumer awareness of obesity health risks and treatment options is driving increased consultation rates with endocrinology specialists.

  • Private insurance market expansion is improving coverage availability for obesity treatment, though significant cost-sharing requirements remain common.
  • Medical community engagement through professional societies supports standardization of treatment protocols and prescribing practices.
  • Pharmaceutical company investment in market development activities builds treatment awareness among both physicians and potential patients.
  • Healthcare facility capacity development in obesity management creates infrastructure for comprehensive patient care delivery.

Germany Focuses on Private Sector Treatment Access

Demand for obesity GLP-1 treatment in Germany is projected to grow at a CAGR of 19.6%, constrained by statutory health insurance exclusions for anti-obesity medications that limit public reimbursement. German patients access treatment primarily through private insurance arrangements or self-pay mechanisms. The country's well-developed private healthcare sector demonstrates strong uptake of obesity pharmacotherapy among patients willing to bear treatment costs. Medical professionals maintain high standards for treatment protocols and patient selection criteria based on comprehensive clinical guidelines.

  • Healthcare policy discussions continue regarding potential modification of statutory insurance restrictions to include evidence-based obesity pharmacotherapy.
  • Private medical practices and specialty obesity clinics provide structured treatment programs combining medication with comprehensive lifestyle intervention.
  • Professional medical societies actively engage in developing clinical practice guidelines and treatment quality standards.
  • Patient advocacy organizations work to increase awareness of obesity as chronic disease requiring sustained medical management.

United States Maintains Market Leadership with Commercial Insurance Coverage

Demand for obesity GLP-1 treatment in the United States is expanding at a CAGR of 25.4%, driven by growing commercial insurance coverage and strong consumer awareness of available treatments. Large employer health benefit plans increasingly include GLP-1 medications in formularies, though typically with prior authorization requirements and step therapy protocols. The market benefits from robust direct-to-consumer marketing efforts that drive patient demand and consultation rates. Professional medical organizations are developing comprehensive obesity treatment guidelines that position pharmacotherapy as integral component of multimodal management strategies.
  • Insurance coverage expansion through commercial plans and Medicare Advantage products improves treatment accessibility across demographic segments.
  • Healthcare provider networks develop specialized obesity medicine programs integrating pharmacotherapy with comprehensive lifestyle intervention services.
  • Medical education initiatives enhance physician training in obesity pharmacotherapy management and patient selection criteria.
  • Regulatory environment supports continued innovation in obesity treatment with streamlined approval pathways for novel GLP-1 formulations.

Injectable Formulations Dominate Treatment Delivery in Japan

Obesity Glp 1 Market Growth Trajectory

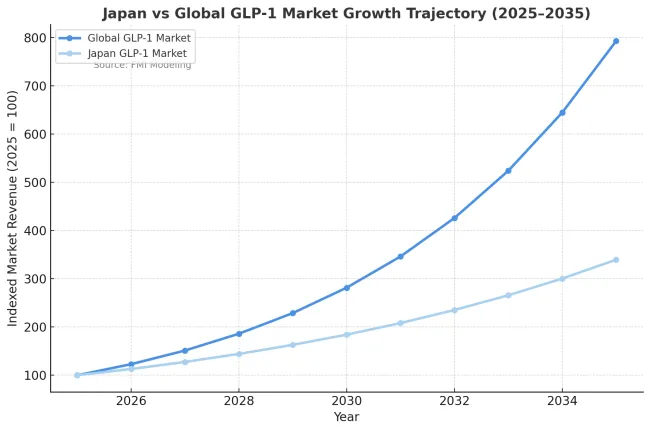
Japan will be an outlier on size, not direction. Expect steady but smallerGLP-1 revenues versus the USA/China/Brazil because obesity prevalence is among the lowest in the OECD on the BMI≥30 cut and coverage and pricing are tightly controlled under national insurance. Japan clinically labels "obesity" at BMI≥25, so the eligible pool is larger than the BMI≥30 headline suggests, but still far below USA levels. I’m not sure of the exact latest percentages, but the relative ranking (Japan low vs peers) holds.

Public reimbursement, HTA-style conservatism, and price revisions dominate adoption not self-pay hype. GLP-1 uptake for obesity-only stays cautious; CV-anchored protocols will drive the bigger wave. Net prices will be cut on schedule (NHI revisions), DTC pull is muted, and prescribers are conservative. Result: high adherence, slower initiation, lower commercial upside for premium brands. Orals may do well with preference-sensitive patients, but injectables remain the backbone unless pills hit efficacy/CV parity at better net price.

Private and Self-Pay Arrangements Lead Treatment Access in South Korea

In South Korea, the market is expected to remain dominated by private insurance and self-pay arrangements, which hold an 85% share in 2025. These payer mechanisms reflect limited public reimbursement coverage for obesity pharmacotherapy under the National Health Insurance system. Korean patients demonstrate willingness to invest in weight management treatments through private payment, supported by cultural emphasis on appearance and health optimization. Private healthcare clinics specializing in aesthetic and metabolic medicine provide primary access channels for GLP-1 treatment. Public reimbursement accounts for only 15% of the market, primarily covering patients with severe obesity and documented metabolic complications.
  • Private medical sector development creates accessible treatment pathways with minimal administrative barriers for eligible patients.
  • Consumer health awareness campaigns emphasize obesity-related health risks and available treatment interventions.
  • Healthcare policy discussions address potential expansion of public coverage based on emerging cardiovascular outcomes evidence.
  • Medical community engagement through professional education programs builds standardized prescribing practices across treatment settings.

Competitive Landscape of Obesity GLP-1 Market

Obesity Glp 1 Market By Company

Player Core asset(s) Strengths Exposed flanks
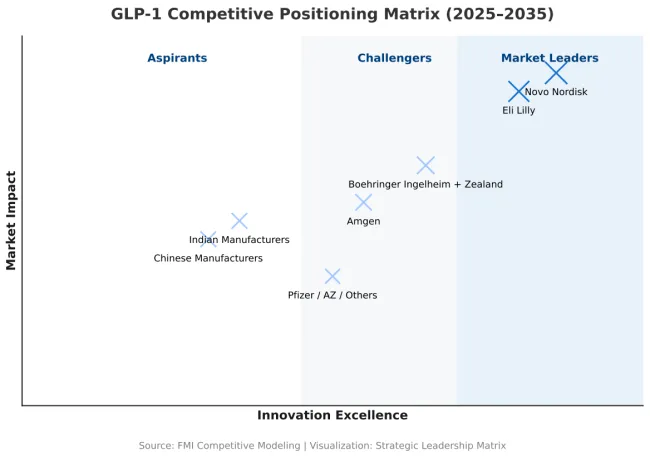
Novo Nordisk Semaglutide (inj /oral); GLP-1+amylin combo in dev Global scale in pens/APIs; SELECT CV evidence; payer relationships Reliance on sema; supply has been tight; efficacy gap vs tirzepatide; China/EU price compression
Eli Lilly Tirzepatide; triple agonist in dev Best-in-class weight loss; rapid prescriber adoption; heavy capex in capacity GI/tolerability management; must prove long-term CV + maintenance superiority; supply ramp risk
Boehringer Ingelheim + Zealand Pharma GLP-1/glucagon (survodutide) Strong efficacy signal; NASH crossover optionality CVOT + scale pending; payer proof not yet locked
Amgen Long-acting GLP-1 (e.g., monthly) Dosing convenience; antibody-peptide tech; big balance sheet Timelines; need head-to-head vs class leaders; manufacturing learning curve
Chinese manufacturers (multiple) Domestic GLP-1s; duals/triples Local cost base; NRDL access potential; massive volume Initial efficacy gaps; IP/quality scrutiny; export credibility
Pfizer/AZ/others (orals & combos) Oral GLP-1s; small molecules; combos If parity on efficacy + lower COGS → big unlock Many orals to date trade efficacy/tolerability; CV parity uncertain

The global GLP-1 and obesity drug landscape is entering a transformative phase as patent protections for semaglutide near expiry in key markets such as India and China by 2026. This shift is unlocking a wave of biosimilar and next-generation innovation from Asian pharmaceutical majors. Companies such as Biocon, Sun Pharma, Cipla, Dr. Reddy’s Laboratories, and Glenmarkin India, along with Huadong Medicine, Benemae Pharmaceutical, Hangzhou Jiuyuan Gene Engineering, and Innovent Biologics in China, are actively developing biosimilar and modified GLP-1 analogues targeting both domestic and global markets.

Across the full GLP-1 and obesity drug space, the post-2026 picture is a price-expansion wave led by Indian and Chinese biosimilars and by new dual or triple-agonist molecules, yet real uptake in the USA and EU will be shaped less by tariffs and more by regulatory timing, drug-device parity on pens and human-factors equivalence for AB-substitution, secondary IP and Orange Book hurdles, and payer or formulary contracting.

Incumbents will defend with brand trust, real-world outcomes, rebate economics, patient programs, and next-gen pipelines, while entrants counter with cost leadership, domestic-first capture, and localized fill-finish to blunt rules-of-origin. Winners will pair low price with fast regulatory clearance, device equivalence, and contracted access; otherwise even a large list-price gap will not force rapid switching in premium markets, while emerging markets tilt quickly to the lowest credible supplier.

As a result, Novo Nordisk and Eli Lilly’s historical dominance will face its first real structural challenge, not from USA or European biotech startups, but from Indian and Chinese players scaling biosimilars and new molecular entities for export. These entrants are leveraging strengths in peptide synthesis, low-cost biologics manufacturing, and regulatory agility to shorten development cycles and undercut price points, potentially halving or even reducing cost to one-tenth of current therapy levels.

Analysts expect this wave to expand the addressable market dramatically, as millions of patients priced out of branded GLP-1s finally gain access. However, brand trust, IP defense, and clinical validation will remain Novo and Lilly’s strongest moats in premium markets such as the USA, EU, and Japan, where regulatory standards and reimbursement frameworks still favor established innovators.

Key Players in the Obesity GLP-1 Market

  • Novo Nordisk
  • Eli Lilly and Company
  • Amgen
  • BoehringerIngelheim
  • AstraZeneca
  • Pfizer
  • Roche
  • Viking Therapeutics
  • Structure Therapeutics
  • Zealand Pharma

Scope of the Report

Item Value
Quantitative Units Million
Molecule Class Semaglutide, tirzepatide, and other GLP-1 receptor agonists
Route of Administration Injectables and oral formulations
Payer Type Public coverage, private insurance, and self-pay arrangements
Use-Case Framing Weight management and cardiovascular risk anchored indications
Regions Covered North America, Europe, East Asia, South Asia and Pacific, Latin America, Middle East and Africa
Countries Covered United States, Canada, Germany, United Kingdom, France, Italy, Spain, Japan, China, India, Brazil, Australia, South Korea, and others
Key Companies Profiled Novo Nordisk, Eli Lilly and Company, Amgen, Boehringer Ingelheim, AstraZeneca, Pfizer, Roche, Viking Therapeutics, Structure Therapeutics, Zealand Pharma
Additional Attributes Market value by molecule class, route of administration, and payer type, regional treatment adoption patterns across North America, Europe, and Asia Pacific, competitive landscape with established manufacturers and emerging biotechnology companies, reimbursement frameworks and health technology assessment outcomes, cardiovascular outcomes evidence and clinical practice guideline development, manufacturing capacity expansion and supply chain considerations, and patient access programs addressing treatment affordability barriers

Obesity GLP-1 Market by Segments

By Molecule Class:

  • Semaglutide
  • Tirzepatide
  • Other GLP-1 Receptor Agonists

By Route of Administration:

  • Injectables
  • Oral Formulations

By Payer Type:

  • Public Coverage
  • Private Insurance and Self-Pay

By Use-Case Framing:

  • Weight Management
  • Cardiovascular Risk Anchored

By Region:

  • North America
  • United States
  • Canada
  • Mexico
  • Europe
  • Germany
  • United Kingdom
  • France
  • Italy
  • Spain
  • Netherlands
  • Rest of Europe
  • East Asia
  • China
  • Japan
  • South Korea
  • South Asia and Pacific
  • India
  • Australia
  • New Zealand

Table of Content

  1. Executive Summary
    • Global Market Outlook
    • Demand-side Trends
    • Supply-side Trends
    • Technology Roadmap Analysis
    • Analysis and Recommendations
  2. Market Overview
    • Market Coverage / Taxonomy
    • Market Definition / Scope / Limitations
  3. Market Background
    • Market Dynamics
      • Drivers
      • Restraints
      • Opportunity
      • Trends
    • Scenario Forecast
      • Demand in Optimistic Scenario
      • Demand in Likely Scenario
      • Demand in Conservative Scenario
    • Opportunity Map Analysis
    • Product Life Cycle Analysis
    • Supply Chain Analysis
      • Supply Side Participants and their Roles
        • Pharmaceutical Manufacturers
        • Mid-Level Participants (Distributors/ Wholesalers/ GPOs)
        • Healthcare Providers and Pharmacies
      • Value Added and Value Created at Node in the Supply Chain
      • List of Raw Material Suppliers
      • List of Existing and Potential Payers
    • Investment Feasibility Matrix
    • Value Chain Analysis
      • Profit Margin Analysis
      • Wholesalers and Distributors
      • Healthcare Providers
    • PESTLE and Porter's Analysis
    • Regulatory Landscape
      • By Key Regions
      • By Key Countries
    • Regional Parent Market Outlook
    • Production and Distribution Statistics
    • Market Access and Reimbursement Statistics
  4. Global Market Analysis 2020 to 2024 and Forecast, 2025 to 2035
    • Historical Market Size Value (USD Million) Analysis, 2020 to 2024
    • Current and Future Market Size Value (USD Million) Projections, 2025 to 2035
      • Y-o-Y Growth Trend Analysis
      • Absolute $ Opportunity Analysis
  5. Global Market Pricing Analysis 2020 to 2024 and Forecast 2025 to 2035
  6. Global Market Analysis 2020 to 2024 and Forecast 2025 to 2035, By Molecule Class
    • Introduction / Key Findings
    • Historical Market Size Value (USD Million) Analysis By Molecule Class, 2020 to 2024
    • Current and Future Market Size Value (USD Million) Analysis and Forecast By Molecule Class, 2025 to 2035
      • Semaglutide
      • Tirzepatide
      • Other GLP-1 Receptor Agonists
    • Y-o-Y Growth Trend Analysis By Molecule Class, 2020 to 2024
    • Absolute $ Opportunity Analysis By Molecule Class, 2025 to 2035
  7. Global Market Analysis 2020 to 2024 and Forecast 2025 to 2035, By Route of Administration
    • Introduction / Key Findings
    • Historical Market Size Value (USD Million) Analysis By Route of Administration, 2020 to 2024
    • Current and Future Market Size Value (USD Million) Analysis and Forecast By Route of Administration, 2025 to 2035
      • Injectables
      • Oral Formulations
    • Y-o-Y Growth Trend Analysis By Route of Administration, 2020 to 2024
    • Absolute $ Opportunity Analysis By Route of Administration, 2025 to 2035
  8. Global Market Analysis 2020 to 2024 and Forecast 2025 to 2035, By Payer Type
    • Introduction / Key Findings
    • Historical Market Size Value (USD Million) Analysis By Payer Type, 2020 to 2024
    • Current and Future Market Size Value (USD Million) Analysis and Forecast By Payer Type, 2025 to 2035
      • Public Coverage
      • Private Insurance and Self-Pay
    • Y-o-Y Growth Trend Analysis By Payer Type, 2020 to 2024
    • Absolute $ Opportunity Analysis By Payer Type, 2025 to 2035
  9. Global Market Analysis 2020 to 2024 and Forecast 2025 to 2035, By Use-Case Framing
    • Introduction / Key Findings
    • Historical Market Size Value (USD Million) Analysis By Use-Case Framing, 2020 to 2024
    • Current and Future Market Size Value (USD Million) Analysis and Forecast By Use-Case Framing, 2025 to 2035
      • Weight Management
      • Cardiovascular Risk Anchored
    • Y-o-Y Growth Trend Analysis By Use-Case Framing, 2020 to 2024
    • Absolute $ Opportunity Analysis By Use-Case Framing, 2025 to 2035
  10. Global Market Analysis 2020 to 2024 and Forecast 2025 to 2035, By Region
    • Introduction
    • Historical Market Size Value (USD Million) Analysis By Region, 2020 to 2024
    • Current Market Size Value (USD Million) Analysis and Forecast By Region, 2025 to 2035
      • North America
      • Europe
      • East Asia
      • South Asia & Pacific
      • Latin America
      • Middle East and Africa
    • Market Attractiveness Analysis By Region
  11. North America Market Analysis 2020 to 2024 and Forecast 2025 to 2035, By Country
    • Historical Market Size Value (USD Million) Trend Analysis By Market Taxonomy, 2020 to 2024
    • Market Size Value (USD Million) Forecast By Market Taxonomy, 2025 to 2035
      • By Country
        • USA
        • Canada
        • Mexico
      • By Molecule Class
      • By Route of Administration
      • By Payer Type
      • By Use-Case Framing
    • Market Attractiveness Analysis
      • By Country
      • By Molecule Class
      • By Route of Administration
      • By Payer Type
      • By Use-Case Framing
    • Key Takeaways
  12. Europe Market Analysis 2020 to 2024 and Forecast 2025 to 2035, By Country
    • Historical Market Size Value (USD Million) Trend Analysis By Market Taxonomy, 2020 to 2024
    • Market Size Value (USD Million) Forecast By Market Taxonomy, 2025 to 2035
      • By Country
        • Germany
        • United Kingdom
        • France
        • Italy
        • Spain
        • Netherlands
        • Rest of Europe
      • By Molecule Class
      • By Route of Administration
      • By Payer Type
      • By Use-Case Framing
    • Market Attractiveness Analysis
      • By Country
      • By Molecule Class
      • By Route of Administration
      • By Payer Type
      • By Use-Case Framing
    • Key Takeaways
  13. East Asia Market Analysis 2020 to 2024 and Forecast 2025 to 2035, By Country
    • Historical Market Size Value (USD Million) Trend Analysis By Market Taxonomy, 2020 to 2024
    • Market Size Value (USD Million) Forecast By Market Taxonomy, 2025 to 2035
      • By Country
        • China
        • Japan
        • South Korea
      • By Molecule Class
      • By Route of Administration
      • By Payer Type
      • By Use-Case Framing
    • Market Attractiveness Analysis
      • By Country
      • By Molecule Class
      • By Route of Administration
      • By Payer Type
      • By Use-Case Framing
    • Key Takeaways
  14. South Asia & Pacific Market Analysis 2020 to 2024 and Forecast 2025 to 2035, By Country
    • Historical Market Size Value (USD Million) Trend Analysis By Market Taxonomy, 2020 to 2024
    • Market Size Value (USD Million) Forecast By Market Taxonomy, 2025 to 2035
      • By Country
        • India
        • Australia & New Zealand
        • ASEAN
        • Rest of SAP
      • By Molecule Class
      • By Route of Administration
      • By Payer Type
      • By Use-Case Framing
    • Market Attractiveness Analysis
      • By Country
      • By Molecule Class
      • By Route of Administration
      • By Payer Type
      • By Use-Case Framing
    • Key Takeaways
  15. Latin America Market Analysis 2020 to 2024 and Forecast 2025 to 2035, By Country
    • Historical Market Size Value (USD Million) Trend Analysis By Market Taxonomy, 2020 to 2024
    • Market Size Value (USD Million) Forecast By Market Taxonomy, 2025 to 2035
      • By Country
        • Brazil
        • Argentina
        • Rest of LATAM
      • By Molecule Class
      • By Route of Administration
      • By Payer Type
      • By Use-Case Framing
    • Market Attractiveness Analysis
      • By Country
      • By Molecule Class
      • By Route of Administration
      • By Payer Type
      • By Use-Case Framing
    • Key Takeaways
  16. Middle East and Africa Market Analysis 2020 to 2024 and Forecast 2025 to 2035, By Country
    • Historical Market Size Value (USD Million) Trend Analysis By Market Taxonomy, 2020 to 2024
    • Market Size Value (USD Million) Forecast By Market Taxonomy, 2025 to 2035
      • By Country
        • GCC Countries
        • Northern Africa
        • South Africa
        • Turkey
        • Rest of MEA
      • By Molecule Class
      • By Route of Administration
      • By Payer Type
      • By Use-Case Framing
    • Market Attractiveness Analysis
      • By Country
      • By Molecule Class
      • By Route of Administration
      • By Payer Type
      • By Use-Case Framing
    • Key Takeaways
  17. Key Countries Market Analysis
    • USA
      • Pricing Analysis
      • Market Share Analysis, 2024
        • By Molecule Class
        • By Route of Administration
        • By Payer Type
    • China
      • Pricing Analysis
      • Market Share Analysis, 2024
        • By Molecule Class
        • By Route of Administration
        • By Payer Type
    • India
      • Pricing Analysis
      • Market Share Analysis, 2024
        • By Molecule Class
        • By Route of Administration
        • By Payer Type
    • Brazil
      • Pricing Analysis
      • Market Share Analysis, 2024
        • By Molecule Class
        • By Route of Administration
        • By Payer Type
    • Germany
      • Pricing Analysis
      • Market Share Analysis, 2024
        • By Molecule Class
        • By Route of Administration
        • By Payer Type
    • Japan
      • Pricing Analysis
      • Market Share Analysis, 2024
        • By Molecule Class
        • By Route of Administration
        • By Payer Type
  18. Market Structure Analysis
    • Competition Dashboard
    • Competition Benchmarking
    • Market Share Analysis of Top Players
      • By Regional
      • By Molecule Class
      • By Route of Administration
      • By Payer Type
  19. Competition Analysis
    • Competition Deep Dive
      • Novo Nordisk
        • Overview
        • Product Portfolio
        • Profitability by Market Segments (Molecule/Route/Payer Type/Region)
        • Sales Footprint
        • Strategy Overview
          • Marketing Strategy
          • Product Strategy
          • Channel Strategy
      • Eli Lilly and Company
        • Overview
        • Product Portfolio
        • Profitability by Market Segments (Molecule/Route/Payer Type/Region)
        • Sales Footprint
        • Strategy Overview
          • Marketing Strategy
          • Product Strategy
          • Channel Strategy
      • Amgen
        • Overview
        • Product Portfolio
        • Profitability by Market Segments (Molecule/Route/Payer Type/Region)
        • Sales Footprint
        • Strategy Overview
          • Marketing Strategy
          • Product Strategy
          • Channel Strategy
      • Boehringer Ingelheim
        • Overview
        • Product Portfolio
        • Profitability by Market Segments (Molecule/Route/Payer Type/Region)
        • Sales Footprint
        • Strategy Overview
          • Marketing Strategy
          • Product Strategy
          • Channel Strategy
      • AstraZeneca
        • Overview
        • Product Portfolio
        • Profitability by Market Segments (Molecule/Route/Payer Type/Region)
        • Sales Footprint
        • Strategy Overview
          • Marketing Strategy
          • Product Strategy
          • Channel Strategy
      • Pfizer
        • Overview
        • Product Portfolio
        • Profitability by Market Segments (Molecule/Route/Payer Type/Region)
        • Sales Footprint
        • Strategy Overview
          • Marketing Strategy
          • Product Strategy
          • Channel Strategy
      • Roche
        • Overview
        • Product Portfolio
        • Profitability by Market Segments (Molecule/Route/Payer Type/Region)
        • Sales Footprint
        • Strategy Overview
          • Marketing Strategy
          • Product Strategy
          • Channel Strategy
      • Viking Therapeutics
        • Overview
        • Product Portfolio
        • Profitability by Market Segments (Molecule/Route/Payer Type/Region)
        • Sales Footprint
        • Strategy Overview
          • Marketing Strategy
          • Product Strategy
          • Channel Strategy
      • Structure Therapeutics
        • Overview
        • Product Portfolio
        • Profitability by Market Segments (Molecule/Route/Payer Type/Region)
        • Sales Footprint
        • Strategy Overview
          • Marketing Strategy
          • Product Strategy
          • Channel Strategy
      • Zealand Pharma
        • Overview
        • Product Portfolio
        • Profitability by Market Segments (Molecule/Route/Payer Type/Region)
        • Sales Footprint
        • Strategy Overview
          • Marketing Strategy
          • Product Strategy
          • Channel Strategy
  20. Assumptions & Acronyms Used
  21. Research Methodology

List of Tables

  • Table 1: Global Market Value (USD Million) Forecast by Region, 2020-2035
  • Table 2: Global Market Value (USD Million) Forecast by Molecule Class, 2020-2035
  • Table 3: Global Market Value (USD Million) Forecast by Route of Administration, 2020-2035
  • Table 4: Global Market Value (USD Million) Forecast by Payer Type, 2020-2035
  • Table 5: Global Market Value (USD Million) Forecast by Use-Case Framing, 2020-2035
  • Table 6: North America Market Value (USD Million) Forecast by Country, 2020-2035
  • Table 7: North America Market Value (USD Million) Forecast by Molecule Class, 2020-2035
  • Table 8: North America Market Value (USD Million) Forecast by Route of Administration, 2020-2035
  • Table 9: North America Market Value (USD Million) Forecast by Payer Type, 2020-2035
  • Table 10: North America Market Value (USD Million) Forecast by Use-Case Framing, 2020-2035
  • Table 11: Europe Market Value (USD Million) Forecast by Country, 2020-2035
  • Table 12: Europe Market Value (USD Million) Forecast by Molecule Class, 2020-2035
  • Table 13: Europe Market Value (USD Million) Forecast by Route of Administration, 2020-2035
  • Table 14: Europe Market Value (USD Million) Forecast by Payer Type, 2020-2035
  • Table 15: Europe Market Value (USD Million) Forecast by Use-Case Framing, 2020-2035
  • Table 16: East Asia Market Value (USD Million) Forecast by Country, 2020-2035
  • Table 17: East Asia Market Value (USD Million) Forecast by Molecule Class, 2020-2035
  • Table 18: East Asia Market Value (USD Million) Forecast by Route of Administration, 2020-2035
  • Table 19: East Asia Market Value (USD Million) Forecast by Payer Type, 2020-2035
  • Table 20: East Asia Market Value (USD Million) Forecast by Use-Case Framing, 2020-2035
  • Table 21: South Asia & Pacific Market Value (USD Million) Forecast by Country, 2020-2035
  • Table 22: South Asia & Pacific Market Value (USD Million) Forecast by Molecule Class, 2020-2035
  • Table 23: South Asia & Pacific Market Value (USD Million) Forecast by Route of Administration, 2020-2035
  • Table 24: South Asia & Pacific Market Value (USD Million) Forecast by Payer Type, 2020-2035
  • Table 25: South Asia & Pacific Market Value (USD Million) Forecast by Use-Case Framing, 2020-2035
  • Table 26: Latin America Market Value (USD Million) Forecast by Country, 2020-2035
  • Table 27: Latin America Market Value (USD Million) Forecast by Molecule Class, 2020-2035
  • Table 28: Latin America Market Value (USD Million) Forecast by Route of Administration, 2020-2035
  • Table 29: Latin America Market Value (USD Million) Forecast by Payer Type, 2020-2035
  • Table 30: Latin America Market Value (USD Million) Forecast by Use-Case Framing, 2020-2035
  • Table 31: Middle East and Africa Market Value (USD Million) Forecast by Country, 2020-2035
  • Table 32: Middle East and Africa Market Value (USD Million) Forecast by Molecule Class, 2020-2035
  • Table 33: Middle East and Africa Market Value (USD Million) Forecast by Route of Administration, 2020-2035
  • Table 34: Middle East and Africa Market Value (USD Million) Forecast by Payer Type, 2020-2035
  • Table 35: Middle East and Africa Market Value (USD Million) Forecast by Use-Case Framing, 2020-2035
  • Table 36: USA Market Value (USD Million) Analysis by Molecule Class, 2020-2035
  • Table 37: USA Market Value (USD Million) Analysis by Route of Administration, 2020-2035
  • Table 38: USA Market Value (USD Million) Analysis by Payer Type, 2020-2035
  • Table 39: USA Market Share Analysis by Molecule Class, 2024
  • Table 40: USA Market Pricing Analysis by Molecule Class, 2020-2035
  • Table 41: China Market Value (USD Million) Analysis by Molecule Class, 2020-2035
  • Table 42: China Market Value (USD Million) Analysis by Route of Administration, 2020-2035
  • Table 43: China Market Value (USD Million) Analysis by Payer Type, 2020-2035
  • Table 44: China Market Share Analysis by Molecule Class, 2024
  • Table 45: China Market Pricing Analysis by Molecule Class, 2020-2035
  • Table 46: India Market Value (USD Million) Analysis by Molecule Class, 2020-2035
  • Table 47: India Market Value (USD Million) Analysis by Route of Administration, 2020-2035
  • Table 48: India Market Value (USD Million) Analysis by Payer Type, 2020-2035
  • Table 49: India Market Share Analysis by Molecule Class, 2024
  • Table 50: India Market Pricing Analysis by Molecule Class, 2020-2035
  • Table 51: Brazil Market Value (USD Million) Analysis by Molecule Class, 2020-2035
  • Table 52: Brazil Market Value (USD Million) Analysis by Route of Administration, 2020-2035
  • Table 53: Brazil Market Value (USD Million) Analysis by Payer Type, 2020-2035
  • Table 54: Brazil Market Share Analysis by Molecule Class, 2024
  • Table 55: Brazil Market Pricing Analysis by Molecule Class, 2020-2035
  • Table 56: Germany Market Value (USD Million) Analysis by Molecule Class, 2020-2035
  • Table 57: Germany Market Value (USD Million) Analysis by Route of Administration, 2020-2035
  • Table 58: Germany Market Value (USD Million) Analysis by Payer Type, 2020-2035
  • Table 59: Germany Market Share Analysis by Molecule Class, 2024
  • Table 60: Germany Market Pricing Analysis by Molecule Class, 2020-2035
  • Table 61: Japan Market Value (USD Million) Analysis by Molecule Class, 2020-2035
  • Table 62: Japan Market Value (USD Million) Analysis by Route of Administration, 2020-2035
  • Table 63: Japan Market Value (USD Million) Analysis by Payer Type, 2020-2035
  • Table 64: Japan Market Share Analysis by Molecule Class, 2024
  • Table 65: Japan Market Pricing Analysis by Molecule Class, 2020-2035
  • Table 66: Competitive Landscape - Market Share Analysis by Company, 2024
  • Table 67: Competitive Landscape - Market Share Analysis by Region, 2024
  • Table 68: Novo Nordisk - Financial Performance Analysis, 2020-2024
  • Table 69: Novo Nordisk - Product Portfolio Analysis
  • Table 70: Novo Nordisk - Regional Market Share Analysis, 2024
  • Table 71: Eli Lilly and Company - Financial Performance Analysis, 2020-2024
  • Table 72: Eli Lilly and Company - Product Portfolio Analysis
  • Table 73: Eli Lilly and Company - Regional Market Share Analysis, 2024
  • Table 74: Amgen - Financial Performance Analysis, 2020-2024
  • Table 75: Amgen - Product Portfolio Analysis
  • Table 76: Boehringer Ingelheim - Financial Performance Analysis, 2020-2024
  • Table 77: Boehringer Ingelheim - Product Portfolio Analysis
  • Table 78: AstraZeneca - Financial Performance Analysis, 2020-2024
  • Table 79: AstraZeneca - Product Portfolio Analysis
  • Table 80: Pfizer - Financial Performance Analysis, 2020-2024
  • Table 81: Pfizer - Product Portfolio Analysis
  • Table 82: Roche - Financial Performance Analysis, 2020-2024
  • Table 83: Roche - Product Portfolio Analysis
  • Table 84: Viking Therapeutics - Financial Performance Analysis, 2020-2024
  • Table 85: Viking Therapeutics - Product Portfolio Analysis
  • Table 86: Structure Therapeutics - Financial Performance Analysis, 2020-2024
  • Table 87: Structure Therapeutics - Product Portfolio Analysis
  • Table 88: Zealand Pharma - Financial Performance Analysis, 2020-2024
  • Table 89: Zealand Pharma - Product Portfolio Analysis
  • Table 90: Pipeline Analysis - GLP-1 Receptor Agonists in Development
  • Table 91: Clinical Trial Analysis - Phase II and Phase III Studies
  • Table 92: Regulatory Approval Timeline Analysis - Key Markets
  • Table 93: Patent Expiry Analysis - Major GLP-1 Products
  • Table 94: Biosimilar Development Analysis - Pipeline Overview
  • Table 95: Manufacturing Capacity Analysis - Key Players
  • Table 96: Supply Chain Analysis - Distribution Networks
  • Table 97: Reimbursement Analysis - Coverage by Region and Payer Type
  • Table 98: Health Economics Analysis - Cost-Effectiveness Studies
  • Table 99: Patient Access Programs - Coverage and Impact Analysis
  • Table 100: Market Entry Strategies - New Player Analysis
  • Table 101: Investment Analysis - Venture Capital and Private Equity Activity
  • Table 102: Merger and Acquisition Analysis - Strategic Transactions
  • Table 103: Technology Platform Analysis - Novel Drug Delivery Systems
  • Table 104: Combination Therapy Analysis - GLP-1 with Other Agents
  • Table 105: Digital Health Integration - Connected Device Analysis
  • Table 106: Real-World Evidence Analysis - Post-Market Surveillance Studies
  • Table 107: Cardiovascular Outcomes Analysis - Clinical Trial Results
  • Table 108: Side Effect Profile Analysis - Safety and Tolerability
  • Table 109: Patient Adherence Analysis - Treatment Persistence Rates
  • Table 110: Healthcare Provider Survey Analysis - Prescribing Patterns
  • Table 111: Payer Survey Analysis - Coverage Decision Factors
  • Table 112: Patient Survey Analysis - Treatment Preferences and Barriers
  • Table 113: Epidemiology Analysis - Obesity Prevalence by Region
  • Table 114: Comorbidity Analysis - Associated Conditions and Treatment Impact
  • Table 115: Age Demographics Analysis - Treatment Uptake by Age Group
  • Table 116: Gender Demographics Analysis - Treatment Patterns by Gender
  • Table 117: Socioeconomic Analysis - Treatment Access by Income Level
  • Table 118: Geographic Analysis - Urban vs Rural Treatment Patterns
  • Table 119: Healthcare Setting Analysis - Treatment Initiation by Care Level
  • Table 120: Quality of Life Analysis - Patient Reported Outcome Measures
  • Table 121: Economic Impact Analysis - Healthcare Cost Savings
  • Table 122: Productivity Impact Analysis - Work Performance Improvements
  • Table 123: Insurance Claims Analysis - Utilization Patterns
  • Table 124: Prior Authorization Analysis - Approval Rates by Region
  • Table 125: Step Therapy Analysis - Treatment Pathway Requirements
  • Table 126: Formulary Analysis - Tier Placement by Payer
  • Table 127: Copay Analysis - Patient Out-of-Pocket Costs
  • Table 128: Deductible Analysis - Impact on Treatment Initiation
  • Table 129: Medicare Coverage Analysis - Part D Plan Variations
  • Table 130: Medicaid Coverage Analysis - State-by-State Variations
  • Table 131: Commercial Insurance Analysis - Employer Plan Coverage
  • Table 132: International Coverage Analysis - Public Health System Policies
  • Table 133: Health Technology Assessment Analysis - HTA Body Decisions
  • Table 134: Value-Based Contracting Analysis - Outcomes-Based Agreements
  • Table 135: Risk-Sharing Agreement Analysis - Manufacturer-Payer Contracts
  • Table 136: Specialty Pharmacy Analysis - Distribution Channel Performance
  • Table 137: Retail Pharmacy Analysis - Dispensing Patterns
  • Table 138: Mail-Order Pharmacy Analysis - Home Delivery Trends
  • Table 139: Hospital Pharmacy Analysis - Inpatient Treatment Patterns
  • Table 140: Clinic-Based Dispensing Analysis - Provider-Direct Models
  • Table 141: Telemedicine Analysis - Virtual Care Adoption
  • Table 142: Mobile Health Analysis - App-Based Support Programs
  • Table 143: Wearable Device Analysis - Integration with Treatment
  • Table 144: Artificial Intelligence Analysis - Predictive Analytics Applications
  • Table 145: Data Analytics Analysis - Real-World Evidence Generation
  • Table 146: Biomarker Analysis - Predictive and Prognostic Indicators
  • Table 147: Pharmacogenomics Analysis - Personalized Treatment Approaches
  • Table 148: Companion Diagnostic Analysis - Treatment Selection Tools
  • Table 149: Clinical Decision Support Analysis - Provider Tools
  • Table 150: Patient Education Analysis - Support Program Effectiveness
  • Table 151: Training Program Analysis - Healthcare Provider Education
  • Table 152: Quality Improvement Analysis - Care Standardization Initiatives
  • Table 153: Outcome Measurement Analysis - Performance Metrics
  • Table 154: Benchmarking Analysis - Best Practice Identification
  • Table 155: Risk Assessment Analysis - Treatment Safety Monitoring
  • Table 156: Adverse Event Analysis - Post-Market Surveillance Data
  • Table 157: Drug Interaction Analysis - Contraindication Profiles
  • Table 158: Special Population Analysis - Elderly and Pediatric Considerations
  • Table 159: Pregnancy and Lactation Analysis - Safety Profile
  • Table 160: Comorbidity Management Analysis - Multi-Condition Treatment
  • Table 161: Treatment Duration Analysis - Long-term Therapy Patterns
  • Table 162: Dose Optimization Analysis - Titration Strategies
  • Table 163: Treatment Switching Analysis - Therapy Transition Patterns
  • Table 164: Discontinuation Analysis - Reasons for Treatment Cessation
  • Table 165: Restart Analysis - Treatment Re-initiation Patterns
  • Table 166: Combination Therapy Analysis - Multi-Drug Regimens
  • Table 167: Lifestyle Intervention Analysis - Comprehensive Care Programs
  • Table 168: Surgical Option Analysis - Bariatric Surgery Comparison
  • Table 169: Alternative Treatment Analysis - Non-GLP-1 Options
  • Table 170: Market Access Strategy Analysis - Launch Approaches
  • Table 171: Pricing Strategy Analysis - Global Price Comparison
  • Table 172: Revenue Forecast Analysis - Company-Specific Projections
  • Table 173: Market Share Evolution Analysis - Historical and Projected
  • Table 174: Competitive Response Analysis - Strategic Reactions
  • Table 175: Future Outlook Analysis - Long-term Market Projections

List of Figures

  • Figure 1: Global Market Value (USD Million) Forecast 2020-2035
  • Figure 2: Global Market Pricing Analysis
  • Figure 3: Global Market Y-o-Y Growth Trend Analysis
  • Figure 4: Global Market Value Share and BPS Analysis by Molecule Class, 2025 and 2035
  • Figure 5: Global Market Y-o-Y Growth Comparison by Molecule Class, 2025-2035
  • Figure 6: Global Market Attractiveness Analysis by Molecule Class
  • Figure 7: Global Market Value Share and BPS Analysis by Route of Administration, 2025 and 2035
  • Figure 8: Global Market Y-o-Y Growth Comparison by Route of Administration, 2025-2035
  • Figure 9: Global Market Attractiveness Analysis by Route of Administration
  • Figure 10: Global Market Value Share and BPS Analysis by Payer Type, 2025 and 2035
  • Figure 11: Global Market Y-o-Y Growth Comparison by Payer Type, 2025-2035
  • Figure 12: Global Market Attractiveness Analysis by Payer Type
  • Figure 13: Global Market Value Share and BPS Analysis by Use-Case Framing, 2025 and 2035
  • Figure 14: Global Market Y-o-Y Growth Comparison by Use-Case Framing, 2025-2035
  • Figure 15: Global Market Attractiveness Analysis by Use-Case Framing
  • Figure 16: Global Market Value (USD Million) Share and BPS Analysis by Region, 2025 and 2035
  • Figure 17: Global Market Y-o-Y Growth Comparison by Region, 2025-2035
  • Figure 18: Global Market Attractiveness Analysis by Region
  • Figure 19: North America Market Incremental $ Opportunity, 2025-2035
  • Figure 20: Europe Market Incremental $ Opportunity, 2025-2035
  • Figure 21: East Asia Market Incremental $ Opportunity, 2025-2035
  • Figure 22: South Asia & Pacific Market Incremental $ Opportunity, 2025-2035
  • Figure 23: Latin America Market Incremental $ Opportunity, 2025-2035
  • Figure 24: Middle East and Africa Market Incremental $ Opportunity, 2025-2035
  • Figure 25: North America Market Value Share and BPS Analysis by Country, 2025 and 2035
  • Figure 26: North America Market Value Share and BPS Analysis by Molecule Class, 2025 and 2035
  • Figure 27: North America Market Y-o-Y Growth Comparison by Molecule Class, 2025-2035
  • Figure 28: North America Market Attractiveness Analysis by Molecule Class
  • Figure 29: North America Market Value Share and BPS Analysis by Route of Administration, 2025 and 2035
  • Figure 30: North America Market Y-o-Y Growth Comparison by Route of Administration, 2025-2035
  • Figure 31: North America Market Attractiveness Analysis by Route of Administration
  • Figure 32: North America Market Value Share and BPS Analysis by Payer Type, 2025 and 2035
  • Figure 33: North America Market Y-o-Y Growth Comparison by Payer Type, 2025-2035
  • Figure 34: North America Market Attractiveness Analysis by Payer Type
  • Figure 35: Europe Market Value Share and BPS Analysis by Country, 2025 and 2035
  • Figure 36: Europe Market Value Share and BPS Analysis by Molecule Class, 2025 and 2035
  • Figure 37: Europe Market Y-o-Y Growth Comparison by Molecule Class, 2025-2035
  • Figure 38: Europe Market Attractiveness Analysis by Molecule Class
  • Figure 39: Europe Market Value Share and BPS Analysis by Route of Administration, 2025 and 2035
  • Figure 40: Europe Market Y-o-Y Growth Comparison by Route of Administration, 2025-2035
  • Figure 41: Europe Market Attractiveness Analysis by Route of Administration
  • Figure 42: Europe Market Value Share and BPS Analysis by Payer Type, 2025 and 2035
  • Figure 43: Europe Market Y-o-Y Growth Comparison by Payer Type, 2025-2035
  • Figure 44: Europe Market Attractiveness Analysis by Payer Type
  • Figure 45: East Asia Market Value Share and BPS Analysis by Country, 2025 and 2035
  • Figure 46: East Asia Market Value Share and BPS Analysis by Molecule Class, 2025 and 2035
  • Figure 47: East Asia Market Y-o-Y Growth Comparison by Molecule Class, 2025-2035
  • Figure 48: East Asia Market Attractiveness Analysis by Molecule Class
  • Figure 49: East Asia Market Value Share and BPS Analysis by Route of Administration, 2025 and 2035
  • Figure 50: East Asia Market Y-o-Y Growth Comparison by Route of Administration, 2025-2035
  • Figure 51: East Asia Market Attractiveness Analysis by Route of Administration
  • Figure 52: East Asia Market Value Share and BPS Analysis by Payer Type, 2025 and 2035
  • Figure 53: East Asia Market Y-o-Y Growth Comparison by Payer Type, 2025-2035
  • Figure 54: East Asia Market Attractiveness Analysis by Payer Type
  • Figure 55: South Asia & Pacific Market Value Share and BPS Analysis by Country, 2025 and 2035
  • Figure 56: South Asia & Pacific Market Value Share and BPS Analysis by Molecule Class, 2025 and 2035
  • Figure 57: South Asia & Pacific Market Y-o-Y Growth Comparison by Molecule Class, 2025-2035
  • Figure 58: South Asia & Pacific Market Attractiveness Analysis by Molecule Class
  • Figure 59: South Asia & Pacific Market Value Share and BPS Analysis by Route of Administration, 2025 and 2035
  • Figure 60: South Asia & Pacific Market Y-o-Y Growth Comparison by Route of Administration, 2025-2035
  • Figure 61: South Asia & Pacific Market Attractiveness Analysis by Route of Administration
  • Figure 62: South Asia & Pacific Market Value Share and BPS Analysis by Payer Type, 2025 and 2035
  • Figure 63: South Asia & Pacific Market Y-o-Y Growth Comparison by Payer Type, 2025-2035
  • Figure 64: South Asia & Pacific Market Attractiveness Analysis by Payer Type
  • Figure 65: Latin America Market Value Share and BPS Analysis by Country, 2025 and 2035
  • Figure 66: Latin America Market Value Share and BPS Analysis by Molecule Class, 2025 and 2035
  • Figure 67: Latin America Market Y-o-Y Growth Comparison by Molecule Class, 2025-2035
  • Figure 68: Latin America Market Attractiveness Analysis by Molecule Class
  • Figure 69: Latin America Market Value Share and BPS Analysis by Route of Administration, 2025 and 2035
  • Figure 70: Latin America Market Y-o-Y Growth Comparison by Route of Administration, 2025-2035
  • Figure 71: Latin America Market Attractiveness Analysis by Route of Administration
  • Figure 72: Latin America Market Value Share and BPS Analysis by Payer Type, 2025 and 2035
  • Figure 73: Latin America Market Y-o-Y Growth Comparison by Payer Type, 2025-2035
  • Figure 74: Latin America Market Attractiveness Analysis by Payer Type
  • Figure 75: Middle East and Africa Market Value Share and BPS Analysis by Country, 2025 and 2035
  • Figure 76: Middle East and Africa Market Value Share and BPS Analysis by Molecule Class, 2025 and 2035
  • Figure 77: Middle East and Africa Market Y-o-Y Growth Comparison by Molecule Class, 2025-2035
  • Figure 78: Middle East and Africa Market Attractiveness Analysis by Molecule Class
  • Figure 79: Middle East and Africa Market Value Share and BPS Analysis by Route of Administration, 2025 and 2035
  • Figure 80: Middle East and Africa Market Y-o-Y Growth Comparison by Route of Administration, 2025-2035
  • Figure 81: Middle East and Africa Market Attractiveness Analysis by Route of Administration
  • Figure 82: Middle East and Africa Market Value Share and BPS Analysis by Payer Type, 2025 and 2035
  • Figure 83: Middle East and Africa Market Y-o-Y Growth Comparison by Payer Type, 2025-2035
  • Figure 84: Middle East and Africa Market Attractiveness Analysis by Payer Type
  • Figure 85: USA Market Share Analysis by Molecule Class, 2024
  • Figure 86: USA Market Pricing Trend Analysis, 2020-2035
  • Figure 87: China Market Share Analysis by Molecule Class, 2024
  • Figure 88: China Market Pricing Trend Analysis, 2020-2035
  • Figure 89: India Market Share Analysis by Molecule Class, 2024
  • Figure 90: India Market Pricing Trend Analysis, 2020-2035
  • Figure 91: Brazil Market Share Analysis by Molecule Class, 2024
  • Figure 92: Brazil Market Pricing Trend Analysis, 2020-2035
  • Figure 93: Germany Market Share Analysis by Molecule Class, 2024
  • Figure 94: Germany Market Pricing Trend Analysis, 2020-2035
  • Figure 95: Japan Market Share Analysis by Molecule Class, 2024
  • Figure 96: Japan Market Pricing Trend Analysis, 2020-2035
  • Figure 97: Global Market - Tier Structure Analysis
  • Figure 98: Global Market - Company Share Analysis
  • Figure 99: Competitive Landscape Dashboard - Market Position Analysis
  • Figure 100: Pipeline Analysis - Development Stage Distribution
  • Figure 101: Clinical Trial Timeline - Key Studies and Milestones
  • Figure 102: Regulatory Approval Process - Global Timeline Comparison
  • Figure 103: Patent Landscape Analysis - Expiry Timeline
  • Figure 104: Biosimilar Development Timeline - Market Entry Projections
  • Figure 105: Manufacturing Capacity Analysis - Global Production Overview
  • Figure 106: Supply Chain Analysis - Distribution Network Mapping
  • Figure 107: Reimbursement Coverage Analysis - Global Payer Landscape
  • Figure 108: Health Technology Assessment Outcomes - HTA Body Decisions
  • Figure 109: Value-Based Contracting Analysis - Agreement Types and Outcomes
  • Figure 110: Patient Access Program Analysis - Coverage and Impact
  • Figure 111: Market Access Strategy Analysis - Launch Approach Comparison
  • Figure 112: Pricing Strategy Analysis - Global Price Waterfall
  • Figure 113: Investment Activity Analysis - Funding Trends and Deal Flow
  • Figure 114: Merger and Acquisition Analysis - Strategic Transaction Timeline
  • Figure 115: Technology Platform Analysis - Innovation Pipeline
  • Figure 116: Combination Therapy Analysis - Development Strategies
  • Figure 117: Digital Health Integration Analysis - Connected Care Solutions
  • Figure 118: Real-World Evidence Analysis - Study Design and Outcomes
  • Figure 119: Cardiovascular Outcomes Analysis - Clinical Trial Results Summary
  • Figure 120: Safety Profile Analysis - Adverse Event Incidence Rates
  • Figure 121: Patient Adherence Analysis - Treatment Persistence Curves
  • Figure 122: Healthcare Provider Survey Analysis - Prescribing Pattern Insights
  • Figure 123: Payer Survey Analysis - Coverage Decision Tree
  • Figure 124: Patient Survey Analysis - Treatment Preference Ranking
  • Figure 125: Epidemiology Analysis - Global Obesity Prevalence Trends
  • Figure 126: Comorbidity Analysis - Associated Condition Impact
  • Figure 127: Demographic Analysis - Age and Gender Distribution
  • Figure 128: Socioeconomic Analysis - Treatment Access by Income Level
  • Figure 129: Geographic Analysis - Urban vs Rural Treatment Uptake
  • Figure 130: Healthcare Setting Analysis - Care Level Distribution
  • Figure 131: Quality of Life Analysis - Patient Reported Outcomes
  • Figure 132: Economic Impact Analysis - Healthcare Cost Savings Timeline
  • Figure 133: Productivity Impact Analysis - Work Performance Improvements
  • Figure 134: Insurance Claims Analysis - Utilization Trend Analysis
  • Figure 135: Prior Authorization Analysis - Approval Rate Trends
  • Figure 136: Step Therapy Analysis - Treatment Pathway Flowchart
  • Figure 137: Formulary Analysis - Tier Placement Distribution
  • Figure 138: Patient Cost Analysis - Out-of-Pocket Expense Distribution
  • Figure 139: Telemedicine Analysis - Virtual Care Adoption Trends
  • Figure 140: Mobile Health Analysis - Digital Support Tool Usage
  • Figure 141: Wearable Device Analysis - Integration with Treatment Programs
  • Figure 142: Artificial Intelligence Analysis - Predictive Analytics Applications
  • Figure 143: Biomarker Analysis - Predictive and Prognostic Indicator Performance
  • Figure 144: Pharmacogenomics Analysis - Personalized Treatment Algorithm
  • Figure 145: Clinical Decision Support Analysis - Provider Tool Effectiveness
  • Figure 146: Patient Education Analysis - Program Effectiveness Metrics
  • Figure 147: Training Program Analysis - Healthcare Provider Education Impact
  • Figure 148: Quality Improvement Analysis - Care Standardization Outcomes
  • Figure 149: Outcome Measurement Analysis - Performance Metrics Dashboard
  • Figure 150: Benchmarking Analysis - Best Practice Identification Framework
  • Figure 151: Risk Assessment Analysis - Treatment Safety Monitoring Framework
  • Figure 152: Special Population Analysis - Elderly and Pediatric Considerations
  • Figure 153: Treatment Duration Analysis - Long-term Therapy Pattern Trends
  • Figure 154: Dose Optimization Analysis - Titration Strategy Effectiveness
  • Figure 155: Treatment Switching Analysis - Therapy Transition Pathways
  • Figure 156: Discontinuation Analysis - Cessation Reason Distribution
  • Figure 157: Combination Therapy Analysis - Multi-Drug Regimen Effectiveness
  • Figure 158: Lifestyle Intervention Analysis - Comprehensive Care Program Outcomes
  • Figure 159: Alternative Treatment Analysis - Comparative Effectiveness Research
  • Figure 160: Future Outlook Analysis - Long-term Market Evolution Timeline

Frequently Asked Questions

How big is the obesity GLP-1 market in 2025?

The global obesity GLP-1 market is valued at USD 8,169 million in 2025.

What will be the size of obesity GLP-1 market in 2035?

The size for the obesity GLP-1 market is projected to reach USD 65,364 million by 2035.

How much will be the obesity GLP-1 market growth between 2025 and 2035?

The obesity GLP-1 market is expected to grow at a 23.1% CAGR between 2025 and 2035.

What are the key molecule class segments in the obesity GLP-1 market?

The key molecule class segments in the obesity GLP-1 market are semaglutide, tirzepatide, and other GLP-1 receptor agonists.

Which molecule class segment is expected to contribute significant share in the obesity GLP-1 market in 2025?

In terms of molecule class, semaglutide segment is set to command 58.0% share in the obesity GLP-1 market in 2025.

Explore Similar Insights

Future Market Insights

Obesity GLP-1 Market

Chat With MaRIA

Chat With

MaRIA

Hi There, I am MaRIA, Your Market Research Intelligence Assistant. How may I help you?